
Canada's Deleveraging Result Is a Risk Story: +3.30% vs TSX
D/E reduction + ROE > 8% screen on TSX stocks from 2000-2025. CAGR 8.38% vs TSX Composite 5.08%, +3.30% excess. Down capture 65.7%, Sharpe 0.358 (more than double the TSX). Strong alpha with two-thirds the downside. Full data, SQL screen included.

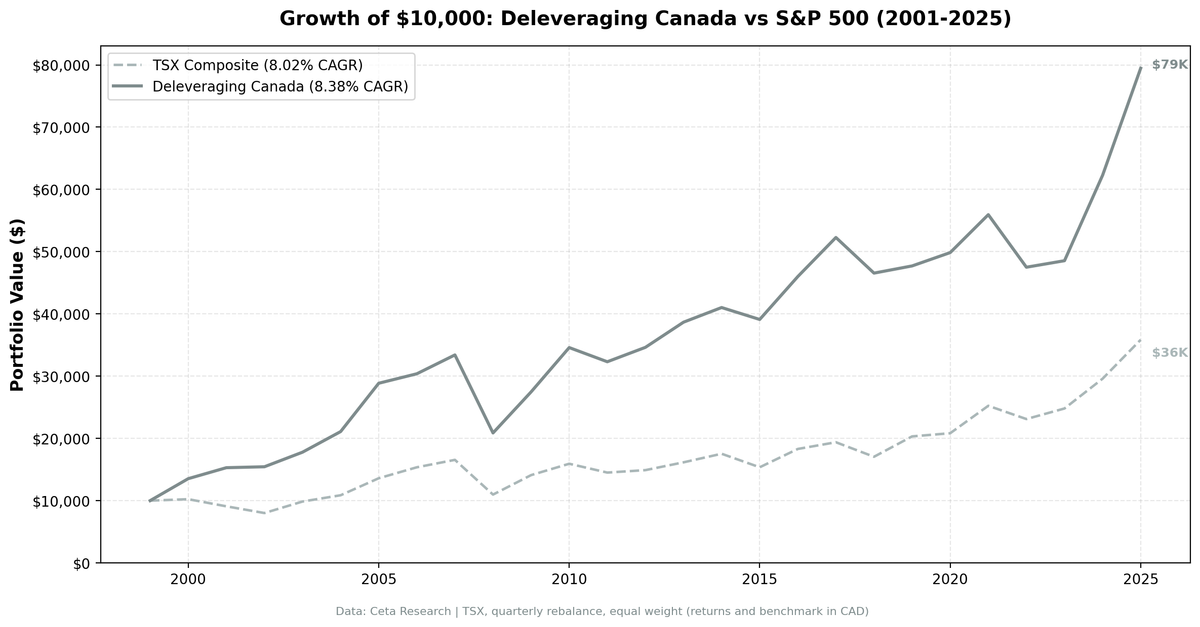
The TSX produces one of the best risk-adjusted results of any exchange we tested. Sharpe 0.358. Down capture 65.74%. Beta 0.84. The portfolio falls about two-thirds as much as the TSX Composite when the market drops, while still compounding ahead of it.
Contents
- The Strategy
- Results
- Why Resource Economies Reward Deleveraging
- The Strong Periods
- The Weak Stretch: 2019-2023
- The Down Capture Story
- Full Annual Returns
- Run This Screen
- Limitations
- Takeaway
The headline return of 8.38% CAGR vs TSX Composite's 5.08% is a +3.30% annual edge. A portfolio that earns more than the local market while falling less when markets drop is a genuine alpha source.
Part of the Deleveraging series. US flagship blog
Returns are in CAD. Benchmark is the S&P/TSX Composite Index (local).
Data: FMP financial data warehouse, 2000-2025. Updated June 2026.
The Strategy
We screen TSX-listed stocks quarterly for companies meeting two conditions:
- Debt-to-equity ratio declined at least 10% year-over-year (annual filing data, 45-day lag)
- Return on equity above 8%
From that filtered universe, we hold the top 30 stocks ranked by magnitude of D/E reduction. Equal-weight, quarterly rebalance, next-day-close execution.
The ROE filter does the heavy lifting. Without it, the signal catches distressed companies shedding debt because their lenders are demanding it. With it, the screen targets profitable businesses that are voluntarily reducing leverage while generating returns for shareholders.
Methodology
| Parameter | Value |
|---|---|
| Universe | TSX (Canada) |
| Signal | D/E reduction ≥ 10% YoY + ROE > 8% |
| Prior D/E | > 0.1 (excludes near-zero leverage), current D/E > 0.01 |
| Market cap | > C$500M |
| Selection | Top 30 by D/E reduction magnitude |
| Weighting | Equal weight |
| Rebalance | Quarterly |
| Execution | Next-day close (MOC) |
| Filing lag | 45 days (annual data) |
| Benchmark | S&P/TSX Composite Index (local) |
| Period | Q2 2000 - Q4 2025 |
| Returns currency | CAD |
Results
The strategy was always invested. Zero cash periods across 103 quarters. The +3.30% excess return and 65.74% down capture are uninterrupted 25-year numbers.
Key Performance Metrics
| Metric | Deleveraging (Canada) | TSX Comp |
|---|---|---|
| CAGR | 8.38% | 5.08% |
| Excess vs TSX | +3.30% | - |
| Total Return | 694.68% | 258.47% |
| C$10K grows to | C$79,468 | C$35,847 |
| Max Drawdown | -43.32% | -41.58% |
| Sharpe Ratio | 0.358 | 0.166 |
| Volatility | 16.41% | 15.55% |
| Up Capture | 99.97% | 100% |
| Down Capture | 65.74% | 100% |
| Beta | 0.84 | 1.00 |
| Alpha | +3.72% | - |
| Win Rate vs TSX | 58.25% | - |
| Avg Stocks Held | 23.3 | - |
| Cash Periods | 0 of 103 | - |
Two numbers stand out. Down capture of 65.74% means when the TSX falls, this portfolio historically falls about two-thirds as much, while up capture stays near 100%. That asymmetry is the whole premise of a deleveraging screen, and Canada delivers it. The Sharpe ratio of 0.358 is more than double the TSX Composite's 0.166.
The C$10K to C$79K vs C$36K comparison tells the compounding story. The strategy doesn't produce dramatic annual spreads. It compounds steadily with lower beta, and over 25 years that adds up to more than 2x the local market.
Why Resource Economies Reward Deleveraging
Canada's TSX is nothing like the S&P 500. Energy, materials, and industrials dominate the index. These are sectors where cash flows are cyclical, leverage is structural, and companies that actively reduce debt during good years are genuinely different from those that don't.
A technology company deleveraging on the S&P 500 might be doing so for many reasons, some reflecting genuine quality and some reflecting quiet deterioration. The signal is noisy. In an efficient market with deep analyst coverage, that noise gets priced quickly, often before you can act on it.
A Canadian oil sands or mining company paying down 15% of its debt during a commodity upcycle while generating 12% ROE is a cleaner signal. The company has real cash flows, real capital discipline, and less institutional coverage chasing the same data. The TSX's mid-cap energy and materials universe doesn't attract the same density of analysts and algorithmic pricing that US markets do. The signal has more room to work.
The sector composition also creates a natural asymmetry around commodity cycles. When global commodity prices rise, Canadian resource companies generate outsized cash flows. The deleveraging signal captures those using that cash to strengthen their balance sheets rather than increase dividends or repurchase shares. That subset has historically had better outcomes in the next downturn.
The Strong Periods
2000-2002: Dotcom crash, +33%, +24%, +13% excess
Three consecutive years of large outperformance. The dotcom crash destroyed US technology companies with speculative balance sheets. Canada's TSX, heavy in energy and materials, was a different market. Companies in oil sands, diversified mining, and industrials were using commodity revenues to pay down debt. The deleveraging signal fired on exactly the right businesses.
2000: +35.31% vs +2.35%. A +32.96% spread. 2001: +13.02% vs -11.20%. A +24.22% spread. 2002: +0.99% vs -11.86%. A +12.85% spread.
This is the ideal environment for the strategy: a selective bear market that punishes leverage in one sector while leaving profitable, debt-reducing companies in other sectors mostly untouched.
2005: +36.81% vs +25.14%, +11.7% excess
The early commodity supercycle. Energy and materials companies had strong cash flows and were deploying them against debt. ROE was elevated, D/E ratios were falling, and the signal was capturing genuinely healthy businesses at the right point in the cycle.
2010: +25.90% vs +12.94%, +13.0% excess
Recovery outperformance. Companies that maintained balance sheet discipline through the 2008 downturn were positioned better for the rebound than the leveraged names forced into restructuring.
2024-2025: Signal revival
2024: +28.28% vs +19.29% (+8.99% excess). 2025: +27.61% vs +21.14% (+6.47% excess).
Two consecutive years of outperformance. Canadian energy and materials companies benefited from commodity demand, and the deleveraging filter captured the disciplined subset.
The Weak Stretch: 2019-2023
Being honest about the bad years matters.
2019: +2.48% vs +19.19% (-16.70%). The TSX rallied hard while the strategy's energy and materials holdings ran into pipeline capacity constraints and US shale competition. Companies that had been deleveraging hit earnings headwinds.
2021: +12.22% vs +21.16% (-8.94%). Strong absolute return, but a large gap in a year when speculative growth dominated.
2022: -15.09% vs -8.44% (-6.65%). The portfolio fell harder than the TSX in a year when energy actually held up. Sector timing worked against the screen.
2023: +2.20% vs +7.35% (-5.15%). Lagged a modest TSX year.
The low-rate years created a specific problem. When rates are near zero, the signal that distinguishes a genuinely disciplined company from a merely profitable one weakens. Every company can borrow cheaply, so voluntary deleveraging is a weaker differentiator. Anyone running this strategy from 2019 to 2023 would have underperformed the TSX. That requires conviction the 25-year data and structural logic support.
The Down Capture Story
The 65.74% down capture is the most distinctive number in this backtest.
In years when the TSX Composite falls, this portfolio historically falls about two-thirds as much. The reasons compound. Beta of 0.84 means lower systematic market exposure than the index. The ROE plus deleveraging filter naturally excludes the most financially fragile companies, which tend to fall hardest in drawdowns. Canadian resource companies, when filtered for capital discipline, have real asset backing that supports valuations during equity market stress.
2022 shows the limit of the mechanism. Rising rates hurt levered companies, but a commodity-driven year kept the TSX relatively resilient while the strategy's specific holdings fell. The portfolio dropped -15.09% vs the TSX's -8.44%. Down capture protects across most drawdowns, not every single one.
Full Annual Returns
| Year | Strategy | TSX Comp | Excess |
|---|---|---|---|
| 2000 | +35.31% | +2.35% | +32.96% |
| 2001 | +13.02% | -11.20% | +24.22% |
| 2002 | +0.99% | -11.86% | +12.85% |
| 2003 | +15.15% | +23.05% | -7.90% |
| 2004 | +18.61% | +10.24% | +8.37% |
| 2005 | +36.81% | +25.14% | +11.67% |
| 2006 | +5.27% | +12.95% | -7.68% |
| 2007 | +9.97% | +7.76% | +2.20% |
| 2008 | -37.51% | -33.70% | -3.81% |
| 2009 | +31.60% | +28.51% | +3.09% |
| 2010 | +25.90% | +12.94% | +12.96% |
| 2011 | -6.58% | -8.91% | +2.32% |
| 2012 | +7.16% | +2.72% | +4.43% |
| 2013 | +11.67% | +8.40% | +3.27% |
| 2014 | +6.09% | +8.53% | -2.44% |
| 2015 | -4.67% | -12.38% | +7.71% |
| 2016 | +17.62% | +19.15% | -1.53% |
| 2017 | +13.65% | +5.89% | +7.76% |
| 2018 | -10.95% | -12.03% | +1.09% |
| 2019 | +2.48% | +19.19% | -16.70% |
| 2020 | +4.49% | +2.50% | +1.99% |
| 2021 | +12.22% | +21.16% | -8.94% |
| 2022 | -15.09% | -8.44% | -6.65% |
| 2023 | +2.20% | +7.35% | -5.15% |
| 2024 | +28.28% | +19.29% | +8.99% |
| 2025 | +27.61% | +21.14% | +6.47% |
Returns are in CAD. The S&P/TSX Composite benchmark is in CAD (local currency comparison).
Run This Screen
The SQL below replicates the screen on TSX stocks. It pulls the most recent two annual D/E ratios, computes the year-over-year change, filters for meaningful prior leverage, ROE above 8%, and market cap above C$500M. Results are sorted by largest D/E reduction.
WITH current_fy AS (
    SELECT symbol, debtToEquityRatio AS de_current, date AS current_date
    FROM financial_ratios
    WHERE period = 'FY'
      AND debtToEquityRatio IS NOT NULL
      AND date >= CAST(CURRENT_DATE::DATE - INTERVAL '18 months' AS VARCHAR)
    QUALIFY ROW_NUMBER() OVER (PARTITION BY symbol ORDER BY date DESC) = 1
),
prior_fy AS (
    SELECT symbol, debtToEquityRatio AS de_prior
    FROM financial_ratios
    WHERE period = 'FY'
      AND debtToEquityRatio IS NOT NULL
      AND date >= CAST(CURRENT_DATE::DATE - INTERVAL '30 months' AS VARCHAR)
      AND date < CAST(CURRENT_DATE::DATE - INTERVAL '12 months' AS VARCHAR)
    QUALIFY ROW_NUMBER() OVER (PARTITION BY symbol ORDER BY date DESC) = 1
),
km AS (
    SELECT symbol, returnOnEquityTTM AS roe, marketCap
    FROM key_metrics_ttm
)
SELECT
    c.symbol, p.companyName, p.exchange, p.sector,
    ROUND(c.de_current, 2) AS de_current,
    ROUND(pr.de_prior, 2) AS de_prior,
    ROUND((c.de_current - pr.de_prior) / pr.de_prior * 100, 1) AS de_change_pct,
    ROUND(k.roe * 100, 1) AS roe_pct,
    ROUND(k.marketCap / 1e9, 2) AS market_cap_bn
FROM current_fy c
JOIN prior_fy pr ON c.symbol = pr.symbol
JOIN km k ON c.symbol = k.symbol
JOIN profile p ON c.symbol = p.symbol
WHERE pr.de_prior > 0.1
  AND c.de_current > 0.01
  AND (c.de_current - pr.de_prior) / pr.de_prior < -0.10
  AND k.roe > 0.08
  AND k.marketCap > 500000000
  AND p.exchange IN ('TSX')
ORDER BY (c.de_current - pr.de_prior) / pr.de_prior ASC
LIMIT 30
Limitations
Sector concentration. The TSX's energy and materials weighting means this portfolio carries implicit sector bets. When commodities underperform, as in 2019-2023, the strategy underperforms. It's a factor strategy operating inside a cyclical sector ecosystem, not a sector-neutral one.
Currency. Returns are in CAD. For USD investors, the CAD/USD exchange rate adds volatility on top of market risk. The comparison to the local TSX Composite removes currency from the alpha measurement, which is the honest way to judge the signal.
+3.30% excess is meaningful but not huge. Withholding taxes on dividends for foreign investors and rebalancing friction reduce the gap somewhat. The backtest already includes size-tiered transaction costs, so the net alpha is real but should not be overstated.
Annual data lag. The 45-day filing lag creates backward-looking bias. Commodity companies can deteriorate faster than their annual filings reflect, particularly in sharp commodity downturns.
Concentrated selection. 23.3 average stocks is a small portfolio. Individual company events move annual returns in ways a broad index does not.
Takeaway
Canada's deleveraging backtest earns its place as one of the best risk-adjusted results in the global series, not because the excess return is large but because the return comes with a risk profile genuinely different from the market.
Down capture of 65.74%. Beta 0.84. Sharpe 0.358, more than double the TSX Composite's. A C$10K investment compounding to C$79K vs the TSX Composite's C$36K.
The structural reason holds up. Canada's resource-heavy economy creates recurring opportunities for capital-disciplined companies to deleverage meaningfully, and the TSX's thinner coverage gives the signal room to work before the market fully prices it. The result is a portfolio that earns modestly more over 25 years while falling substantially less when markets drop.
The weak 2019-2023 stretch is honest context. This strategy does not outperform in a low-rate environment that rewards leverage and growth. It outperforms in commodity cycles, rising-rate environments, and selective bear markets. The 2024 and 2025 results suggest that environment may be returning.
Data: Ceta Research (FMP financial data warehouse). Backtest period Q2 2000 - Q4 2025. Returns in CAD. Benchmark is S&P/TSX Composite Index (local). Not investment advice.

