
India Is the Top Performer: Deleveraging Earns +3.85% Annual Excess on NSE
D/E reduction + ROE > 8% screen delivers +3.85% annually vs the Sensex in India. CAGR 14.97%, down capture 77%, total return 3,534%. The signal works here because balance sheet discipline is genuinely scarce in India's growth economy.

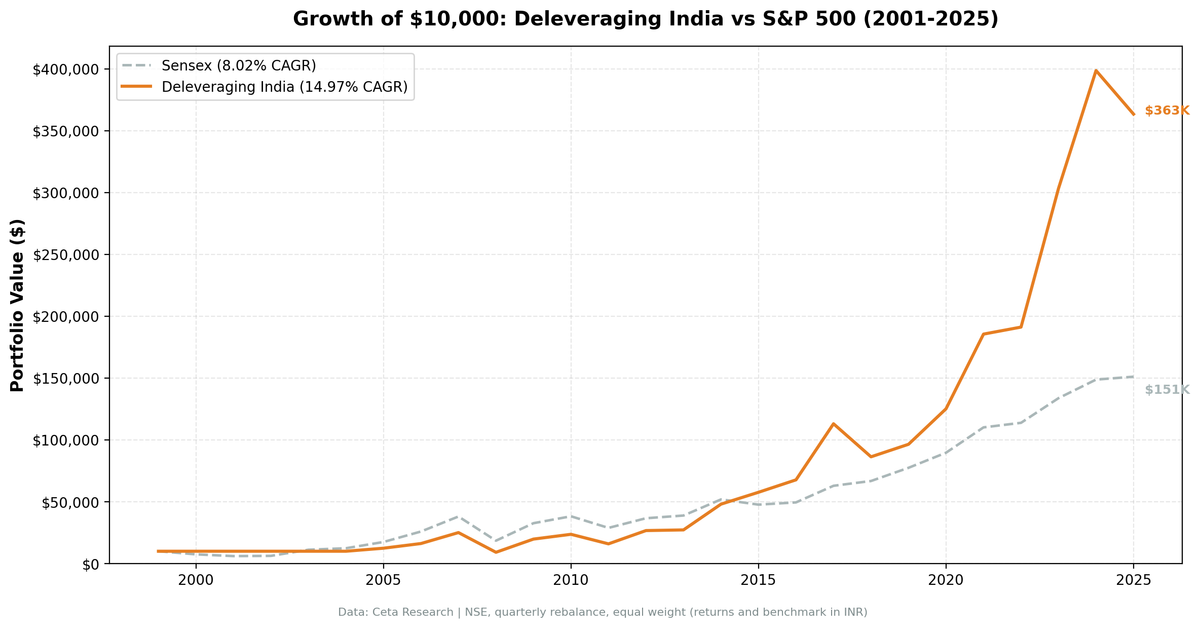
The same signal that roughly matches the market in the US generates 14.97% CAGR in India, beating the Sensex by 3.85 percentage points a year. Down capture is 77% vs the local benchmark. This isn't noise. It's a structural difference in how these markets price balance sheet discipline.
Contents
- Method
- Results
- Why India Is Different
- The Highlights
- The Failures
- Recent Pattern
- The Screen
- Limitations
- Takeaway
One caveat upfront: the strategy sat in cash for 22 of 103 quarters. The first invested year is 2005. From 2000 through 2004 there weren't enough Indian companies meeting both conditions to build a portfolio. So the 14.97% CAGR is built on roughly 20 of the 25 years. When it can find qualifying companies, the returns are strong. The question is whether those conditions hold going forward.
Part of the Deleveraging series. US flagship →
Data: FMP financial data warehouse, 2000-2025. Updated June 2026.
Method
We screen NSE stocks quarterly for three conditions:
- Debt-to-equity ratio declined by at least 10% year-over-year (annual filing data, 45-day lag)
- Prior D/E > 0.1, current D/E > 0.01 (excludes erroneous zero-leverage data)
- Return on equity above 8%
Top 30 stocks by magnitude of D/E reduction. Equal-weight, quarterly rebalance, next-day-close execution. When the qualifying universe is too thin, the portfolio moves to cash.
The ROE filter matters. Without it, the signal picks up distressed companies shedding debt because they have no choice. With it, the screen looks for companies reducing leverage from a position of strength: cash flows good enough to retire borrowings while still generating real shareholder returns.
Methodology
| Parameter | Value |
|---|---|
| Universe | NSE (India) |
| Signal | D/E reduction ≥ 10% YoY, prior D/E > 0.1, current > 0.01, ROE > 8% |
| MCap filter | ≥ ₹20B (~$250M USD) |
| Selection | Top 30 by D/E reduction magnitude |
| Weighting | Equal weight |
| Rebalance | Quarterly |
| Execution | Next-day close (MOC) |
| Filing lag | 45 days (annual data) |
| Benchmark | BSE Sensex (local) |
| Period | Q2 2000 - Q4 2025 |
| Returns currency | INR |
Returns are in INR. Benchmark is the Sensex (BSE SENSEX index) for local market comparison.
Results
14.97% CAGR over 25 years against the Sensex's 11.12%. A +3.85% annual excess. ₹10,000 invested in 2001 grew to ₹363,400 in the portfolio versus ₹151,100 in the Sensex, more than 2x the benchmark.
The alpha comes from selective timing and quality filtering in a less-efficient market. Down capture of 77.0% vs the Sensex provides meaningful downside protection while up capture stays above 100% (108%). The strategy tracks the Sensex closely (beta 0.89) but adds consistent alpha through its balance-sheet-discipline filter.
Key Performance Metrics
| Metric | Deleveraging (India) | Sensex |
|---|---|---|
| CAGR | 14.97% | 11.12% |
| Excess vs Sensex | +3.85% | - |
| Total Return | 3,534% | 1,411% |
| Max Drawdown | -67.81% | -51.34% |
| Sharpe Ratio | 0.282 | 0.194 |
| Volatility | 30.05% | 23.83% |
| Up Capture | 108.0% | 100% |
| Down Capture | 77.0% | 100% |
| Beta | 0.89 | 1.00 |
| Alpha | +4.37% | - |
| Win Rate vs Sensex | 60.19% | - |
| Avg Stocks (invested) | 21.6 | - |
| Cash Periods | 22 of 103 | - |
The max drawdown of -67.81% is worth pausing on. It's worse than the Sensex's -51.34%. Indian bear markets can be severe, and a concentrated portfolio of around 22 stocks amplifies them. The combination of 77% down capture and 14.97% CAGR means the strategy compounds via alpha accumulation over time, not dramatic crash protection.
Why India Is Different
In the US, the deleveraging signal works in theory but faces efficient-market headwinds. Everyone sees the same annual filings at the same time. The market reprices companies showing balance sheet improvement within days, and the US result lands at parity with SPY.
India has different characteristics that amplify the signal.
Analyst coverage on mid-cap NSE companies is thinner. Financial data reaches institutional investors more slowly and less uniformly. A mid-cap industrial in Pune paying down 15% of its debt while maintaining 12% ROE doesn't get immediately arbitraged. A quarterly rebalancing strategy running on annual filing data can still act on it before it's fully priced in.
The more important structural reason is scarcity. In India's high-growth environment, most growing companies are leveraging up to fund expansion. Debt is cheap relative to returns, and growth requires capital. Companies that manage to deleverage while maintaining ROE above 8% are doing something that requires genuine management quality. They're either generating enough cash to fund operations internally, or disciplined enough to resist easy credit when peers are taking it.
That scarcity is what creates the alpha. In the US, many companies deleverage. In India, far fewer do while maintaining strong profitability. When you find them, the market hasn't already priced them as exceptional.
The Highlights
2009: +116.6% vs +76.3%. The 2008 crash was violent in both directions. After -63.5% in 2008, the recovery was explosive. Companies that survived the crisis with manageable debt loads were repriced dramatically. The +40.3% excess in 2009 partially offset the prior year's underperformance.
2012: +67.2% vs +27.0%. A +40.2% excess year. The screen's capital-disciplined operators outpaced a recovering Sensex.
2014: +76.4% vs +33.5%. The BJP election year. Policy optimism drove Indian equities broadly, but the strategy's selection of capital-disciplined operators concentrated in industrials and infrastructure, the exact names that benefited from expectations of public spending and reform. A +42.9% excess in a single year.
2017: +67.0% vs +27.1%. Another year of strong Indian momentum, with the quality filter adding +39.8% excess over the Sensex.
2023: +58.7% vs +17.5%. A strong Indian market year. The strategy captured substantial upside with +41.1% excess, driven by quality selection. 2024 followed with +20.2% excess.
The Failures
2008: -63.5% vs -51.3%. The worst year in the dataset. The global financial crisis hit Indian equities hard, and the concentrated portfolio amplified the damage. A -12.2% gap vs the Sensex. The ROE filter doesn't protect against sudden earnings collapse during a credit crisis.
2018: -23.6% vs +6.2%. The clearest single-year failure. The Sensex gained while the strategy's mid-cap industrial and financial holdings got caught in the NBFC sector stress and a domestic credit crunch. A -29.8% gap. The signal can fire on companies that look like quality deleveragers on annual filings but are entering sector-specific deterioration in real time.
2005-2006: -16.0% and -18.2%. The early invested years lagged a Sensex that was running hot on the commodity supercycle. The screen's quality bias underperformed a broad momentum rally.
2018 is the honest stress test for this strategy. When the screen's holdings enter a credit crunch the annual data hasn't caught up to, and the broad index keeps rising, the comparison looks terrible.
Recent Pattern
2023 and 2024 were strong: +58.7% and +31.4%, producing +41.1% and +20.2% excess respectively. The India macro story, decoupling from US rate pressure with strong domestic demand, aligned with the strategy's quality filter.
2025 reversed that. The portfolio fell -8.8% while the Sensex gained +1.6%, a -10.4% gap. One weak year after two exceptional ones.
The pattern is consistent with the strategy's long-run character: it delivers in years when the Indian market rewards quality fundamentals, and lags when momentum or credit cycles run against its mid-cap holdings. Recent performance doesn't invalidate the signal, but it shows that 2023-2024 should not be extrapolated.
The Screen
Run this on the Ceta Research data explorer to see current qualifying Indian stocks.
WITH current_fy AS (
    SELECT symbol, debtToEquityRatio AS de_current, date AS current_date
    FROM financial_ratios
    WHERE period = 'FY'
      AND debtToEquityRatio IS NOT NULL
      AND date >= CAST(CURRENT_DATE::DATE - INTERVAL '18 months' AS VARCHAR)
    QUALIFY ROW_NUMBER() OVER (PARTITION BY symbol ORDER BY date DESC) = 1
),
prior_fy AS (
    SELECT symbol, debtToEquityRatio AS de_prior
    FROM financial_ratios
    WHERE period = 'FY'
      AND debtToEquityRatio IS NOT NULL
      AND date >= CAST(CURRENT_DATE::DATE - INTERVAL '30 months' AS VARCHAR)
      AND date < CAST(CURRENT_DATE::DATE - INTERVAL '12 months' AS VARCHAR)
    QUALIFY ROW_NUMBER() OVER (PARTITION BY symbol ORDER BY date DESC) = 1
),
km AS (
    SELECT symbol, returnOnEquityTTM AS roe, marketCap
    FROM key_metrics_ttm
)
SELECT
    c.symbol, p.companyName, p.exchange, p.sector,
    ROUND(c.de_current, 2) AS de_current,
    ROUND(pr.de_prior, 2) AS de_prior,
    ROUND((c.de_current - pr.de_prior) / pr.de_prior * 100, 1) AS de_change_pct,
    ROUND(k.roe * 100, 1) AS roe_pct,
    ROUND(k.marketCap / 1e9, 2) AS market_cap_bn
FROM current_fy c
JOIN prior_fy pr ON c.symbol = pr.symbol
JOIN km k ON c.symbol = k.symbol
JOIN profile p ON c.symbol = p.symbol
WHERE pr.de_prior > 0.1
  AND c.de_current > 0.01
  AND (c.de_current - pr.de_prior) / pr.de_prior < -0.10
  AND k.roe > 0.08
  AND k.marketCap > 20000000000
  AND p.exchange IN ('NSE')
ORDER BY (c.de_current - pr.de_prior) / pr.de_prior ASC
LIMIT 30
Limitations
Currency risk. Returns are in INR. An investor converting to USD faces rupee depreciation on top of market risk. The long-run rupee trend against the dollar is negative, so USD-denominated returns from Indian equities are consistently lower than INR returns. Comparing against the local Sensex removes currency from the alpha measurement, which is the honest way to judge the signal.
21% cash periods. The strategy sat out 22 quarters, mostly 2000-2004 when the Indian corporate universe was too thin to generate a qualifying portfolio. If conditions shift and fewer Indian companies combine D/E reduction with ROE above 8%, cash periods return. This is not a set-and-forget exposure to India.
Max drawdown -67.81%. Worse than the Sensex in absolute terms. Indian bear markets are more severe than US ones, and a concentrated portfolio amplifies them. The 2008 drawdown shows what this looks like in practice.
Annual filing lag. The 45-day lag on annual data means the signal is backward-looking. In India's less efficient market this is less damaging than in the US, but companies can still deteriorate between filings. 2018 is the clearest example.
Small universe. 21.6 average stocks when invested. Idiosyncratic risk is high. Accounting irregularities, regulatory actions, or single-sector shocks move annual returns materially.
Data starts 2005 in practice. The 14.97% CAGR is built on approximately 20 effective years, not 25. Early-2000s India market movements are not reflected.
Takeaway
The deleveraging signal works best in India. 14.97% CAGR, 77% down capture, +3.85% annual excess vs the Sensex over 25 years. The structural reasons are real: thinner analyst coverage, genuine scarcity of capital-disciplined operators, and a market that reprices balance sheet improvement more slowly than the US.
The volatility is also real. -63.5% in 2008. -23.6% vs a rising Sensex in 2018. -10.4% vs the Sensex in 2025. This is not a smooth ride. Years like 2018 test conviction hard.
The honest framing: in markets where debt discipline is scarce and prices move slowly, the signal earns its keep. India is the clearest case in the dataset. Same screen, same logic, different market. The theory becomes returns instead of drag.
Data: Ceta Research (FMP financial data warehouse). Backtest period Q2 2000 - Q4 2025. Returns in INR. Benchmark is BSE Sensex (local). Not investment advice.

