
Earnings Surprise Drift in China: The Market That Beats the Least but Drifts on Beats
China has the lowest beat rate of any exchange we tested: 34.8%. But when Chinese companies beat, the drift survives a next-day entry: Q5 +2.58% at T+63, or +1.46% net of baseline. Q5-Q1 spread: +2.33%.

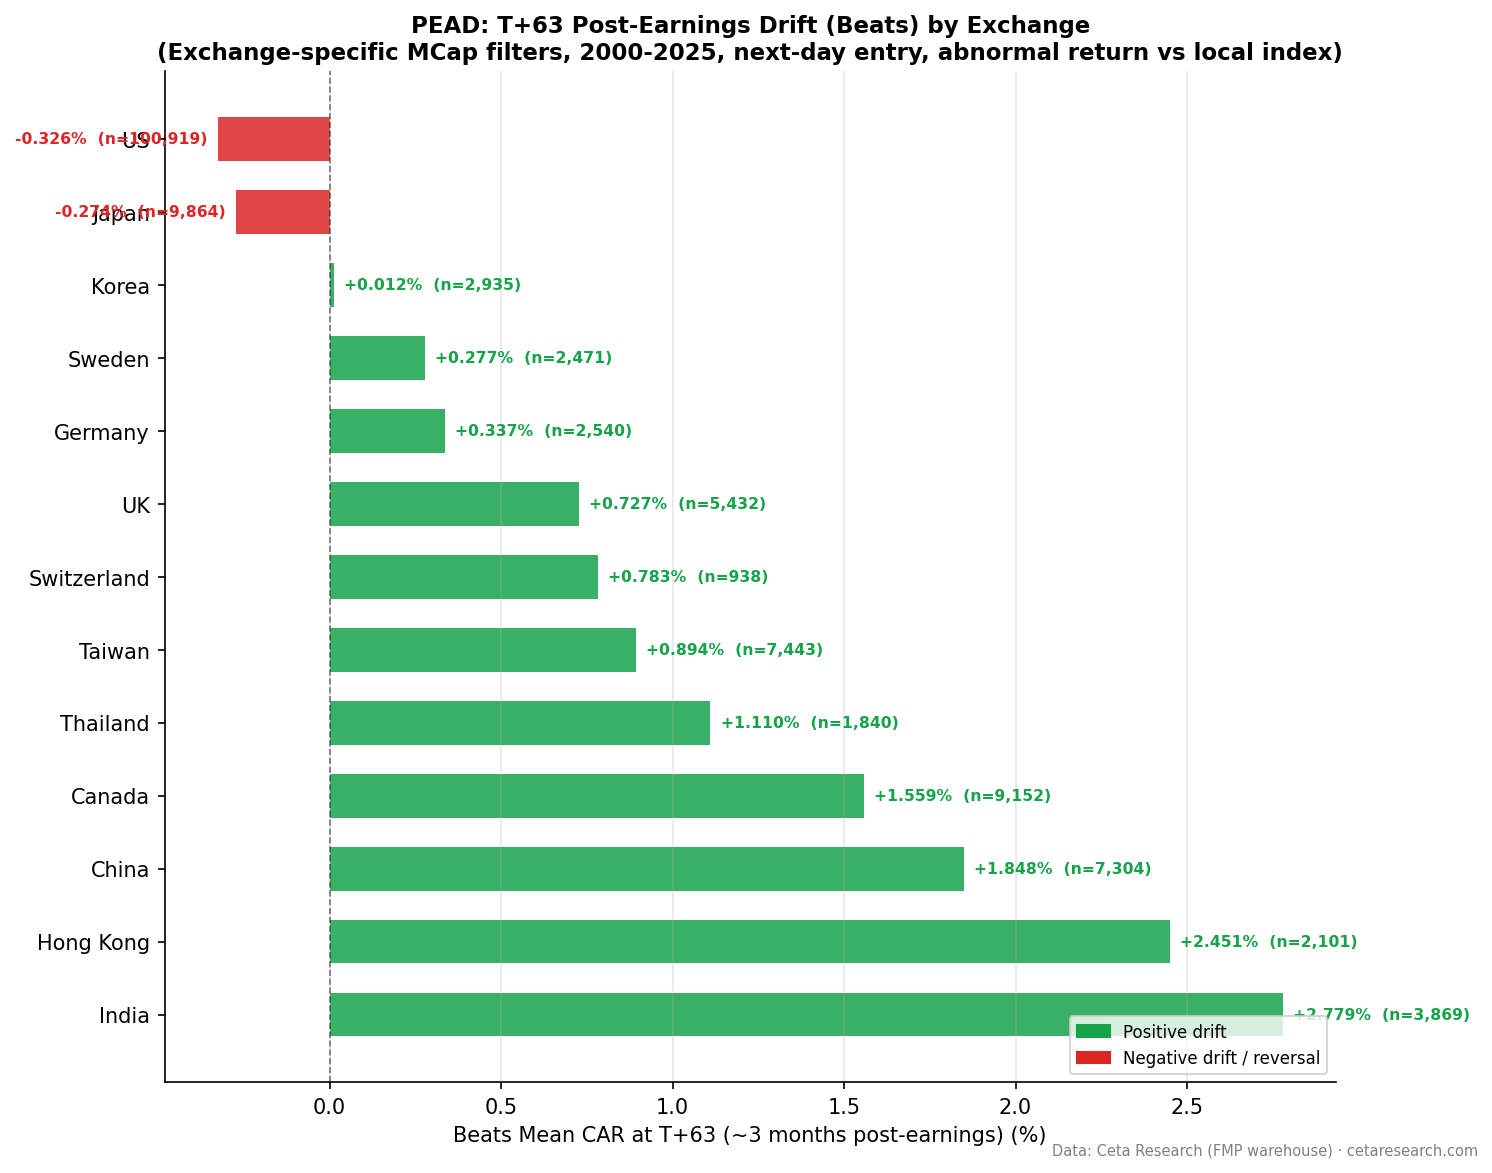
China has the lowest beat rate of any exchange we tested: just 34.8% of earnings announcements come in above analyst estimates. Nearly two thirds of Chinese companies miss. Yet when they beat, the drift is real and it survives a realistic next-day entry. The biggest beats produce +2.58% cumulative abnormal return at T+63 against the SSE Composite, and against the near-consensus baseline that's +1.46% of genuine beat-side drift. The miss side is quieter but not empty: the worst misses underperform near-consensus by -0.87%. China is a beat-led market with a modest second side.
Contents
- Method
- The Strategy
- What We Found
- Positive vs Negative Surprise Drift
- Quintile Analysis at T+63
- Why China's Beat Rate Is So Low
- When It Works and When It Struggles
- Run It Yourself
- Limitations
- Part of a Series
- References
Data: FMP financial data warehouse, 2000–2025. Updated July 2026.
Method
| Parameter | Details |
|---|---|
| Data source | FMP earnings_surprises + stock_eod (Ceta Research warehouse) |
| Universe | SHZ + SHH (China A-shares), market cap threshold applied per exchange |
| Period | 2000–2025 (26 years) |
| Events | 21,010 total (deduplicated per symbol/date) |
| Benchmark | SSE Composite (000001.SS, local currency) |
| Execution | Enter at the next day's close (T+1), skipping the announcement day |
| Data quality | Oscillation rows removed, entry price > $1, single-window return capped at 200% |
| Surprise metric | (epsActual − epsEstimated) / ABS(epsEstimated) |
| Windows | T+1, T+5, T+21, T+63 trading days, measured from entry |
The Strategy
Post-Earnings Announcement Drift (PEAD) documents that stocks keep drifting in the direction of their earnings surprise for weeks after the announcement. Ball and Brown (1968) established it, and Bernard and Thomas (1989) confirmed it persists up to 60 trading days.
China A-shares are a distinctive test case. The market is retail-dominated, has a shorter analyst-coverage history, and operates under different disclosure norms than Western markets. We ran the event study on 21,010 Chinese earnings announcements with a next-day entry and the local SSE Composite benchmark.
What We Found
Positive vs Negative Surprise Drift
| Direction | Events | T+1 | T+5 | T+21 | T+63 |
|---|---|---|---|---|---|
| Positive surprises | 7,304 | +0.30% | +0.52% | +0.33% | +1.85% |
| Negative surprises | 13,706 | -0.01% | +0.11% | +0.27% | +0.70% |
Positive surprises drift up steadily, reaching +1.85% by T+63 with a t-statistic of +8.7. Negative surprises drift up too, in absolute terms (+0.70%), which looks like misses do nothing. That reading comes from the baseline, and the quintile table separates the two.
Quintile Analysis at T+63
| Quintile | Description | Events | CAR at T+63 | t-stat |
|---|---|---|---|---|
| Q5 | Biggest beats | 4,230 | +2.58% | +8.7 |
| Q4 | Moderate beats | 4,230 | +0.89% | +3.5 |
| Q3 | Near-consensus | 4,227 | +1.12% | +4.3 |
| Q2 | Moderate misses | 4,190 | +0.61% | +2.2 |
| Q1 | Worst misses | 4,133 | +0.25% | +0.8 |
The Chinese event universe drifts up against the SSE Composite, so the near-consensus quintile Q3 sits at +1.12%, not zero. Against that baseline, the beat side is strong: Q5 minus Q3 is +1.46%, highly significant. The miss side is real but smaller: Q1 minus Q3 is -0.87%. So the raw "misses drift up +0.70%" is the buoyant baseline, not the earnings signal. Relative to comparable non-surprising stocks, the worst misses do underperform.
The Q5-Q1 spread is +2.33%. It's beat-led (+1.46% from the top) with a modest miss contribution (-0.87% from the bottom). Q5's t-statistic of +8.7 across more than 4,200 events makes the beat side the reliable part of the trade.
Why China's Beat Rate Is So Low
China's 34.8% beat rate is the lowest across all 13 exchanges. Analyst coverage of A-shares has historically been optimistic, creating high baseline estimates that are hard to clear. State-owned enterprise reporting norms differ from private companies, and the share of stocks with genuine multi-analyst consensus is lower in the early years of the sample.
The low beat rate has a practical upside: a Chinese beat is a real surprise against a hard-to-clear bar, not a routine clearing of lowered guidance. That's consistent with China keeping strong beat-side drift where more efficient, higher-beat-rate markets lose it.
When It Works and When It Struggles
China's cleaner signal is the long side. Q5 beats produce +2.58% at T+63, +1.46% net of the baseline, with a strong t-statistic. The drift builds over time (T+1 +0.30%, T+63 +1.85% for the positive category), so the capture window is wide and execution doesn't need to be immediate.
The miss side is a secondary, relative signal. Because the whole universe drifts up, shorting misses outright fights the baseline. Underweighting the worst misses within a Chinese book is the more sensible expression of the -0.87% net figure.
China A-shares have daily price limits (10% for most stocks), which spread the price adjustment over multiple days and can contribute to the gradual drift pattern.
Run It Yourself
-- Recent large positive earnings surprises on China A-shares
WITH deduped AS (
  SELECT
    es.symbol,
    es.date,
    es.epsActual,
    es.epsEstimated,
    (es.epsActual - es.epsEstimated) / NULLIF(ABS(es.epsEstimated), 0) AS std_surprise,
    ROW_NUMBER() OVER (PARTITION BY es.symbol, es.date ORDER BY es.lastUpdated DESC) AS rn
  FROM earnings_surprises es
  JOIN profile p ON es.symbol = p.symbol
  WHERE p.exchange IN ('SHZ', 'SHH')
    AND p.isActivelyTrading = true
    AND CAST(es.date AS DATE) >= CURRENT_DATE - INTERVAL '90 days'
    AND ABS(es.epsEstimated) > 0.01
)
SELECT
  symbol,
  date,
  epsActual,
  epsEstimated,
  ROUND(std_surprise * 100, 1) AS surprise_pct
FROM deduped
WHERE rn = 1
  AND std_surprise > 0.10
ORDER BY date DESC, std_surprise DESC
LIMIT 50
Run this query on Ceta Research →
Limitations
21,010 events is the second-largest sample in our study after the US. But the beat side is much smaller than the miss side in event count: 7,304 positive versus 13,706 negative, a direct consequence of the 34.8% beat rate. The Q5 quintile still holds more than 4,200 events, which is ample.
Analyst coverage quality for A-shares improved substantially after 2005. The early years (2000 to 2004) have sparse consensus data, and estimates then may be single-analyst rather than true consensus, adding noise to the surprise metric for that period.
Raw CAR includes a positive universe-versus-index baseline (Q3 at +1.12%), which is why the miss side looks flat in raw terms. We report the Q5 minus Q3 and Q1 minus Q3 decomposition to keep the attribution honest.
Part of a Series
- PEAD Across 13 Global Exchanges: The Drift Shrinks Everywhere
- Earnings Surprise Drift on US Stocks: Most of It Vanishes If You Wait One Day
References
- Ball, R. & Brown, P. (1968). An empirical evaluation of accounting income numbers. Journal of Accounting Research.
- Bernard, V. & Thomas, J. (1989). Post-earnings-announcement drift: Delayed price response or risk premium? Journal of Accounting Research.
- Foster, G., Olsen, C. & Shevlin, T. (1984). Earnings releases, anomalies, and the behavior of security returns. The Accounting Review.
Data: Ceta Research, FMP financial data warehouse. Not investment advice.

