
Earnings Surprise Drift on US Stocks: Most of It Vanishes If You Wait One Day
We tested 161,243 US earnings announcements from 2000 to 2025 and entered at the next day's close. The beat-side drift vanishes, and only the miss side survives (Q1 -1.46%). Q5-Q1 spread: +1.42%.

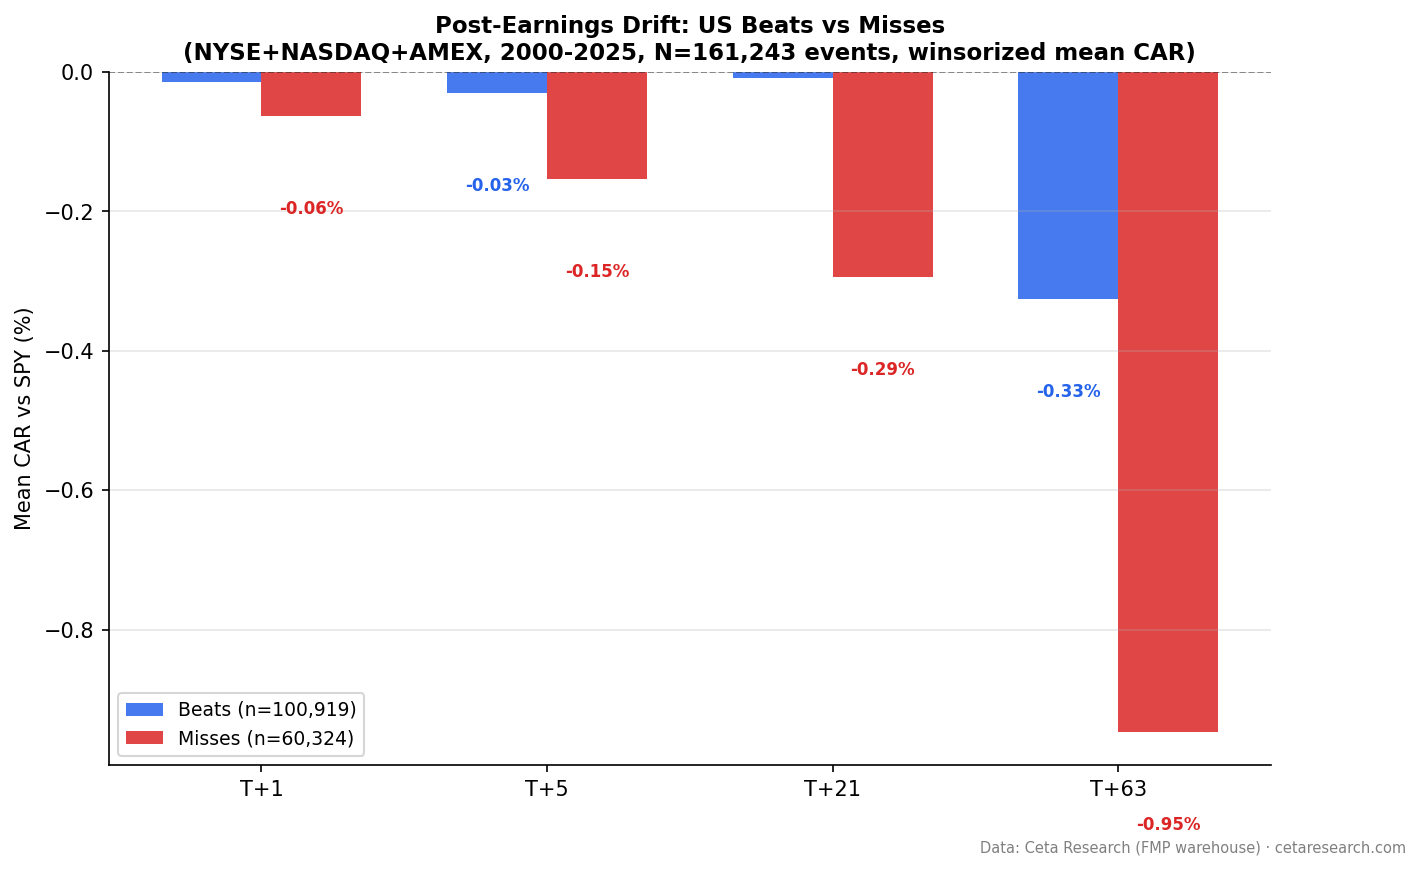
Post-earnings drift on US stocks is real, but most of what looks like drift is the announcement-day move you can't actually trade. We tested 161,243 US earnings announcements from 2000 to 2025 and entered each position at the next day's close, skipping the announcement day. Once you do that, the positive drift disappears: the biggest beats drift just -0.04% over the next 63 trading days. The miss side survives. Worst-miss stocks drift -1.46%. The Q5-Q1 quintile spread is +1.42%, less than half the +3.72% you get if you cheat and enter at the announcement-day close.
Contents
- Method
- The Strategy
- What We Found
- Positive vs Negative Surprise Drift
- Quintile Analysis at T+63
- Beat Rate Trend
- When It Works and When It Struggles
- Run It Yourself
- Limitations
- Part of a Series
- References
Data: FMP financial data warehouse, 2000–2025. Updated July 2026.
Method
| Parameter | Details |
|---|---|
| Data source | FMP earnings_surprises + stock_eod (Ceta Research warehouse) |
| Universe | NYSE, NASDAQ, AMEX, market cap threshold applied per exchange |
| Period | 2000–2025 (26 years) |
| Events | 161,243 total (deduplicated per symbol/date) |
| Benchmark | S&P 500 (SPY), dividend-adjusted |
| Execution | Enter at the next day's close (T+1), skipping the announcement day |
| Data quality | Oscillation rows removed, entry price > $1, single-window return capped at 200% |
| Surprise metric | (epsActual − epsEstimated) / ABS(epsEstimated) |
| Windows | T+1, T+5, T+21, T+63 trading days, measured from entry |
The Strategy
Post-Earnings Announcement Drift (PEAD) is one of the oldest documented market anomalies. The finding: stocks with large positive earnings surprises keep drifting up for weeks, and stocks with large negative surprises keep drifting down. Ball and Brown documented it in 1968. Bernard and Thomas replicated it in 1989 and showed the drift persists for up to 60 trading days.
The catch is execution. Most earnings land after the market closes. The stock gaps the next morning and does most of its repricing on the first post-announcement day. An event study that enters at the announcement-day close captures that gap as if it were tradeable drift. It isn't. You didn't know the result when that close printed.
So we skip a day. Each position enters at the next day's close, and every window is measured from there. This removes the announcement-day jump and leaves only the drift you could actually have captured. We stratified all events into quintiles by standardized surprise: Q1 is the worst 20% of misses, Q5 is the best 20% of beats.
What We Found
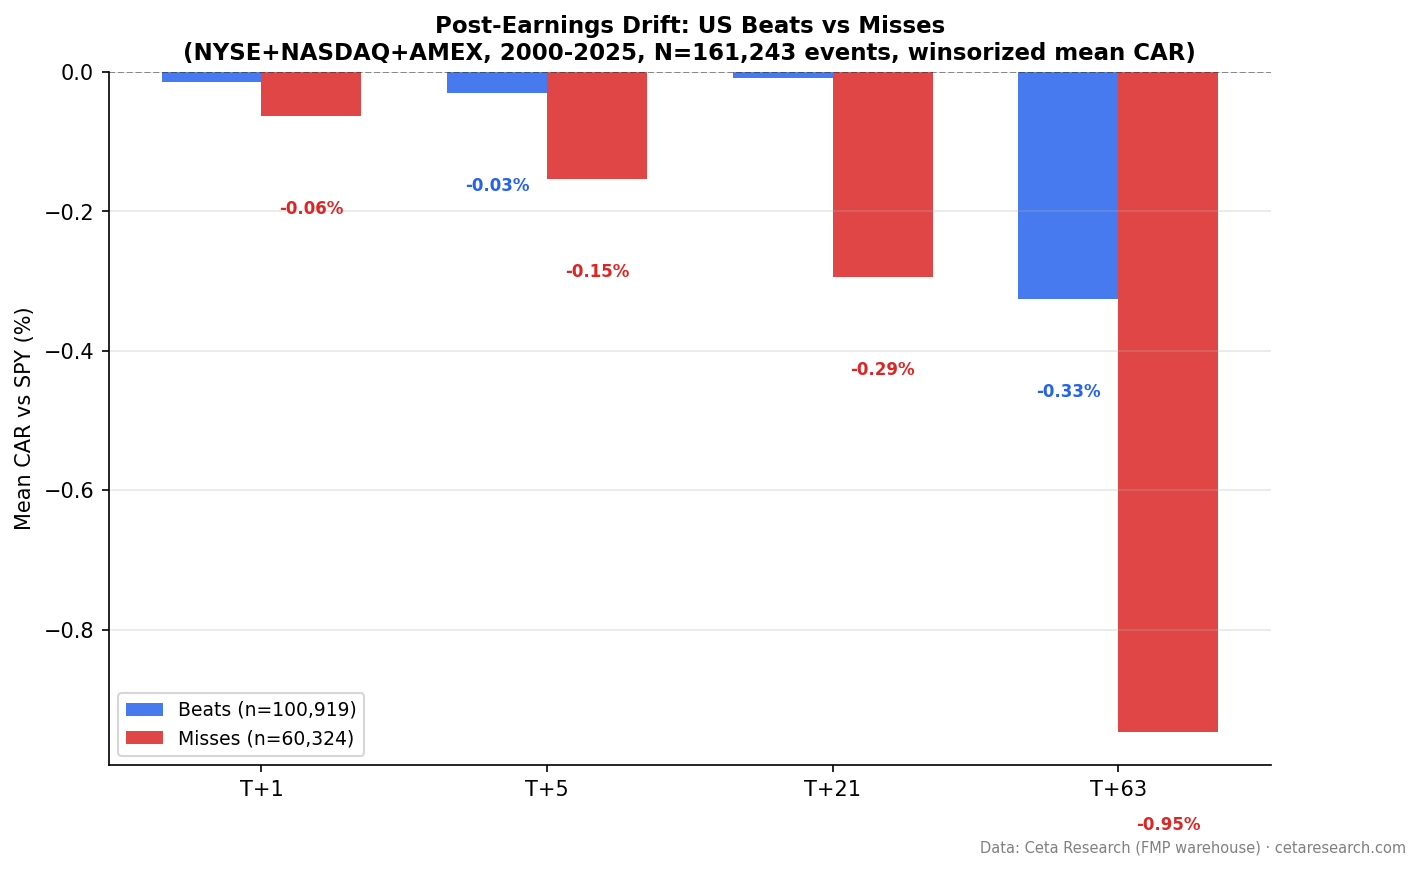
Positive vs Negative Surprise Drift
| Direction | Events | T+1 | T+5 | T+21 | T+63 |
|---|---|---|---|---|---|
| Positive surprises | 100,919 (62.6%) | -0.01% | -0.03% | -0.01% | -0.33% |
| Negative surprises | 60,324 (37.4%) | -0.06% | -0.15% | -0.29% | -0.95% |
Once the announcement day is excluded, the beat side is gone. Positive surprises produce no meaningful drift at any window, and by T+63 they are slightly negative (-0.33%). This is the whole point of the correction. The +0.63% "T+1 beat drift" that same-day studies report is the announcement-day pop, and you can't buy at a price that printed before the news.
The miss side survives. Negative surprises keep drifting down through the full window, reaching -0.95% at T+63 with a t-statistic of -13.1. Bad news gets priced in slowly enough that a next-day entry still captures roughly a percent of underperformance over the following quarter.
Quintile Analysis at T+63
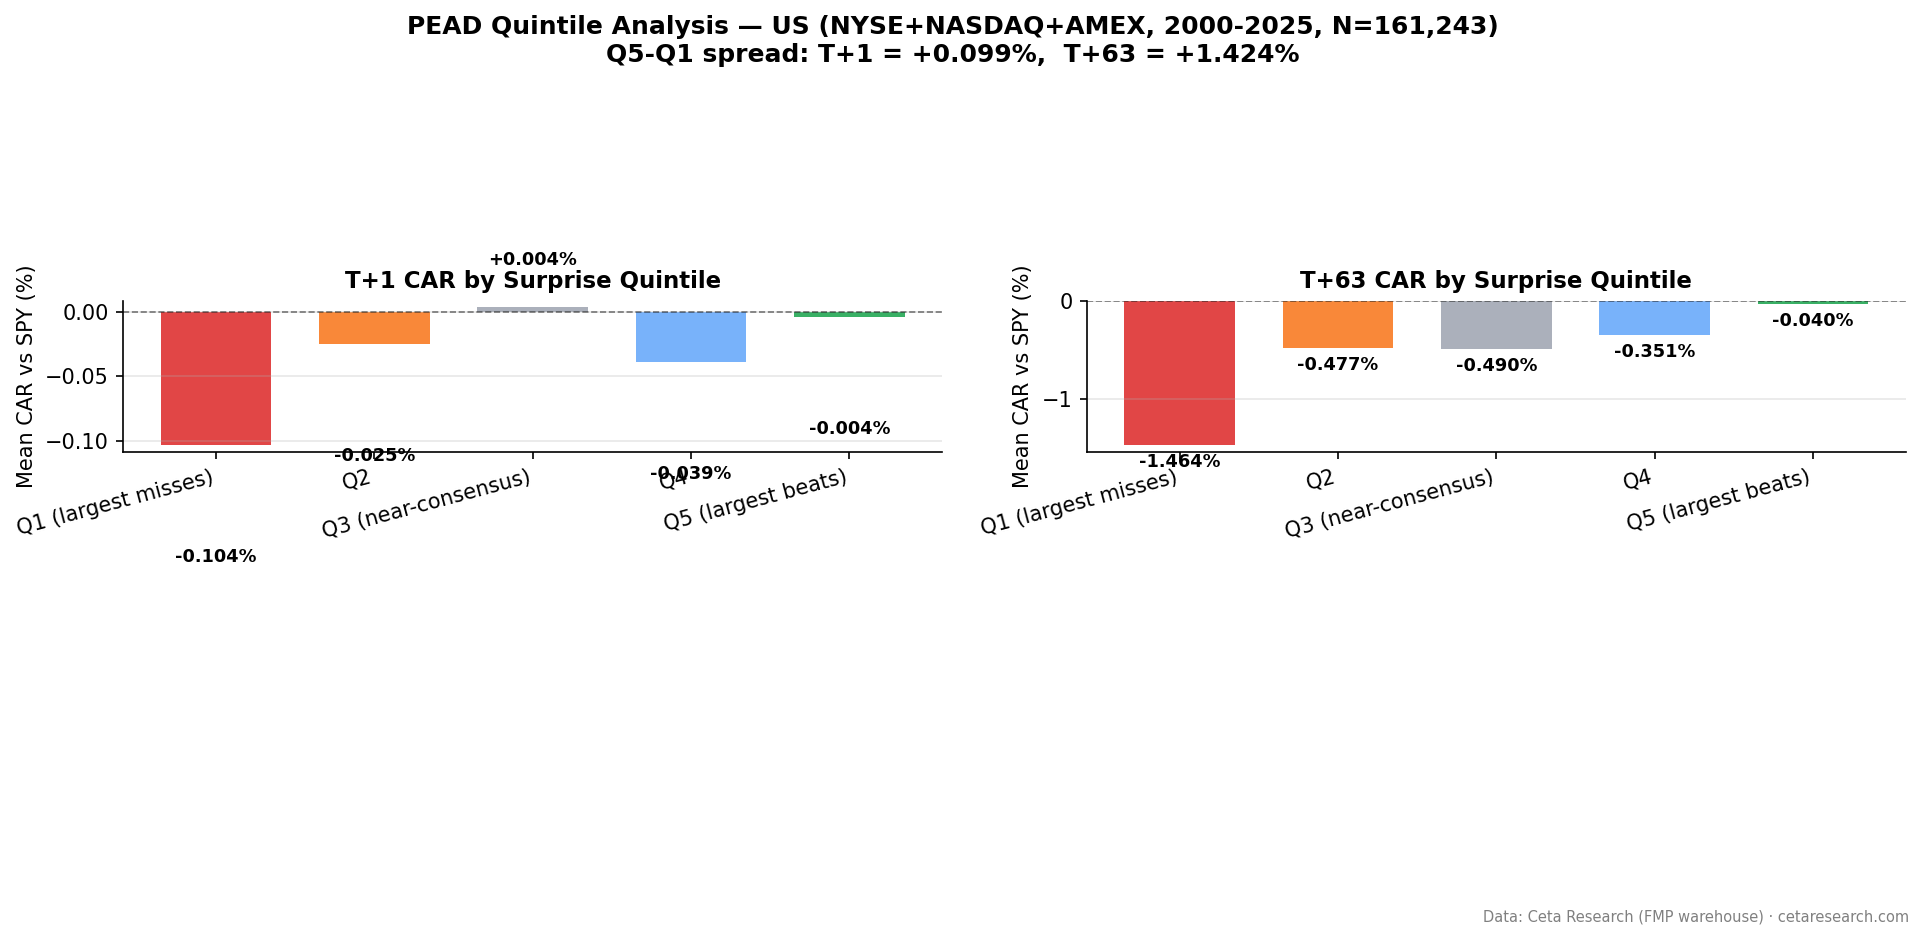
| Quintile | Description | Events | CAR at T+63 | t-stat |
|---|---|---|---|---|
| Q5 | Biggest beats | 32,182 | -0.04% | -0.4 |
| Q4 | Moderate beats | 33,090 | -0.35% | -4.1 |
| Q3 | Near-consensus | 33,486 | -0.49% | -6.9 |
| Q2 | Moderate misses | 32,276 | -0.48% | -5.9 |
| Q1 | Worst misses | 30,209 | -1.46% | -12.5 |
The Q5-Q1 spread is +1.42% at T+63. It's driven almost entirely by the Q1 tail. Q5 through Q2 sit in a narrow band between -0.04% and -0.49%, and only Q1 (worst misses) breaks away to -1.46%.
There's a baseline effect worth being explicit about. The near-consensus quintile Q3 drifts -0.49%, not zero. That's because the event universe is equal-weighted across mid and large caps while the benchmark is the cap-weighted S&P 500, so the average stock in the sample lags the index over any 63-day window. The clean earnings signal is the level relative to Q3: the biggest beats beat near-consensus by +0.45% (Q5 minus Q3), and the worst misses trail it by -0.97% (Q1 minus Q3). Read that way, US PEAD after realistic execution is a modest, mostly miss-side effect. An investor already long the market earns the raw level; the part attributable to the surprise is the distance from Q3.
Beat Rate Trend
The share of positive surprises has grown steadily. Around 2000, roughly 57% of US earnings came in above estimates. Post-2018, beat rates run 65 to 70%. The 2000 to 2025 average is 62.6%.
This reflects guidance conservatism. Companies set expectations low enough to beat reliably. A raw "positive surprise" is less informative today than it was in 2000, which is part of why the beat side carries so little drift. When almost two thirds of companies clear the bar, clearing it tells you little.
When It Works and When It Struggles
The surviving signal is the worst-miss tail. Q1 drift builds the entire way out: -0.10% at T+1, -0.27% at T+5, -0.55% at T+21, and -1.46% at T+63. The market digests bad news slowly, so a short or underweight on the worst misses has time to work and does not depend on same-day execution.
The beat side is not actionable on this universe. The average positive surprise produces nothing at T+63, and even the top quintile lands at -0.04%. If PEAD has a tradeable long side, it is in smaller, thinner-coverage names than the market-cap-filtered universe tested here, or in markets less efficient than the US.
Negative PEAD tends to be stronger during risk-off environments. When volatility is elevated, investors are slower to react to bad news, and the drift gets longer and deeper.
Run It Yourself
Live screen using the Ceta Research data API:
-- Most recent earnings surprises with large positive standardized surprise
WITH deduped AS (
  SELECT
    es.symbol,
    es.date,
    es.epsActual,
    es.epsEstimated,
    (es.epsActual - es.epsEstimated) / NULLIF(ABS(es.epsEstimated), 0) AS std_surprise,
    ROW_NUMBER() OVER (PARTITION BY es.symbol, es.date ORDER BY es.lastUpdated DESC) AS rn
  FROM earnings_surprises es
  JOIN profile p ON es.symbol = p.symbol
  WHERE p.exchange IN ('NYSE', 'NASDAQ', 'AMEX')
    AND p.marketCap >= 500000000
    AND p.isActivelyTrading = true
    AND CAST(es.date AS DATE) >= CURRENT_DATE - INTERVAL '90 days'
    AND ABS(es.epsEstimated) > 0.01
)
SELECT
  symbol,
  date,
  epsActual,
  epsEstimated,
  ROUND(std_surprise * 100, 1) AS surprise_pct
FROM deduped
WHERE rn = 1
  AND std_surprise > 0.10
ORDER BY date DESC, std_surprise DESC
LIMIT 50
Run this query on Ceta Research →
Limitations
Entering at the next day's close is the honest convention for this data, since earnings timing (before open, after close, intraday) is not uniform and the announcement-day move is not reliably tradeable. It is also conservative: if you could enter earlier for a specific name that reported before the open, you would capture more. The numbers here are a floor, not a ceiling.
Raw CAR includes a universe-versus-index baseline. The event universe is equal-weighted while the S&P 500 is cap-weighted, so the near-consensus quintile drifts -0.49% rather than zero. We report the spread and the level-minus-Q3 attribution precisely so this baseline doesn't get mistaken for an earnings signal.
Transaction costs matter. At -0.95% average miss-side drift over 63 days, a short strategy has to clear borrow, commissions, and slippage on a thin edge. Quintile assignments depend on analyst consensus, which is noisier for small caps with sparse coverage.
Part of a Series
- PEAD Across 13 Global Exchanges: The Drift Shrinks Everywhere
- India Earnings Surprise Drift: The Strongest Beat-Side Drift We Found
References
- Ball, R. & Brown, P. (1968). An empirical evaluation of accounting income numbers. Journal of Accounting Research.
- Bernard, V. & Thomas, J. (1989). Post-earnings-announcement drift: Delayed price response or risk premium? Journal of Accounting Research.
- Foster, G., Olsen, C. & Shevlin, T. (1984). Earnings releases, anomalies, and the behavior of security returns. The Accounting Review.
Data: Ceta Research, FMP financial data warehouse. Not investment advice.

