
EV/EBITDA Sector-Relative Value on Hong Kong Stocks: The Excess Is All Cash Timing
We backtested sector-relative EV/EBITDA on 22 years of Hong Kong stocks (HKSE). 3.08% CAGR vs 0.49% Hang Seng, +2.59% excess. Strip out the three cash years that dodged a 46% index fall and the edge drops to +0.09% a year. Sharpe 0.003, max drawdown -57.04%.

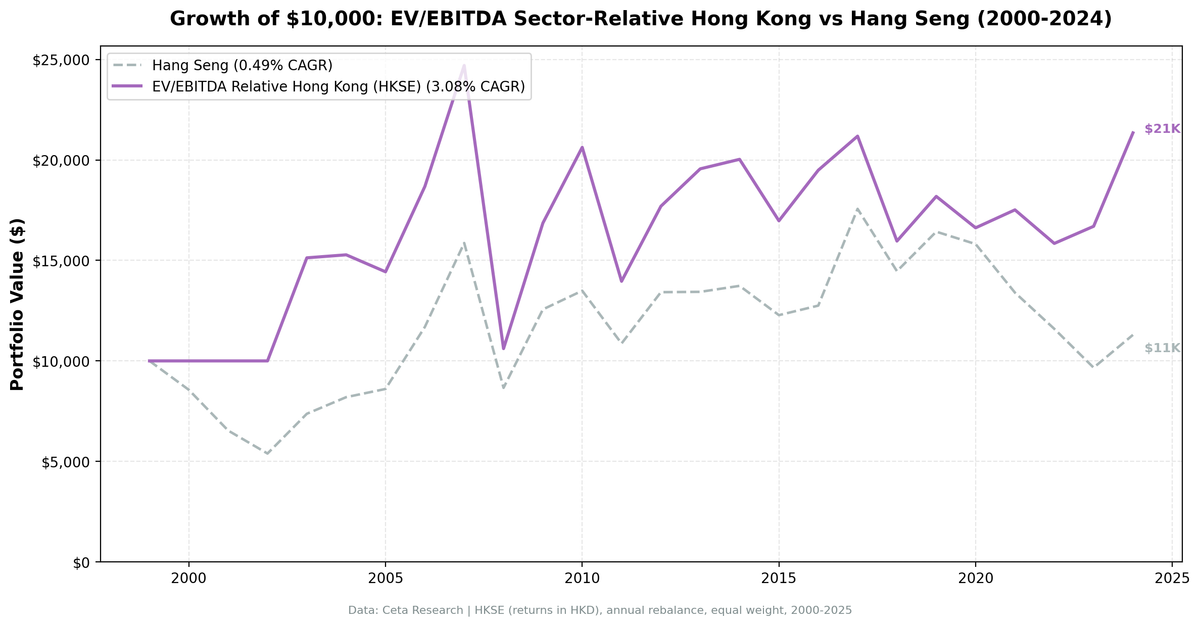
We ran a sector-relative EV/EBITDA screen on 22 years of Hong Kong stock data from HKSE. The result: 3.08% CAGR against 0.49% for the Hang Seng Index, an excess of +2.59% a year. That looks like one of the better results in this study until you ask where it came from. The screen sat in cash from 2000 to 2002 while the Hang Seng fell 46%. Over the 22 years it actually held stocks, it returned 3.51% against the index's 3.42%. Stock selection added 0.09 points a year. The cash rule did the rest.
Contents
- Method
- The Screen
- Sector-Relative EV/EBITDA Screen for HKSE (SQL)
- What We Found
- 22 invested years. +2.59% headline excess, +0.09% once you strip the cash years.
- Year-by-year returns
- 2008: -57.0% catastrophic loss
- The structural discount problem
- 2011: -32.3% from the European crisis
- 2017: the worst relative year
- 2021 and 2023: losing less is not winning
- 2024: +27.9%, the best year since the post-crisis rebound
- Backtest Methodology
- Limitations
- Conclusion
Data: FMP financial data warehouse, 2000–2025. Updated August 2026.
Method
| Parameter | Detail |
|---|---|
| Data source | Ceta Research (FMP financial data warehouse) |
| Universe | HKSE (Hong Kong Stock Exchange), MCap > HKD 2B |
| Signal | Stock EV/EBITDA < 70% of sector median (30%+ discount to peers) |
| EV/EBITDA range | 0.5-25x |
| Quality filters | ROE > 8%, D/E < 2.0 |
| Portfolio | Top 30 by deepest discount, equal weight |
| Rebalancing | Annual (January) |
| Cash rule | Hold cash if fewer than 10 stocks qualify |
| Period | 2000-2025 (25 years, 4 cash periods) |
| Benchmark | Hang Seng Index (HSI) |
Financial data sourced from key_metrics_ttm for EV/EBITDA and market cap, financial_ratios_ttm for debt metrics, profile for sector classification. 45-day lag on all financial statements to prevent look-ahead bias.
The Screen
Sector-Relative EV/EBITDA Screen for HKSE (SQL)
WITH universe AS (
    SELECT k.symbol, p.companyName, p.exchange, p.sector,
           k.evToEBITDATTM AS ev_ebitda, k.returnOnEquityTTM AS roe,
           fr.debtToEquityRatioTTM AS de, p.marketCap
    FROM key_metrics_ttm k
    JOIN financial_ratios_ttm fr ON k.symbol = fr.symbol
    JOIN profile p ON k.symbol = p.symbol
    WHERE k.evToEBITDATTM BETWEEN 0.5 AND 25
      AND k.returnOnEquityTTM > 0.08
      AND (fr.debtToEquityRatioTTM IS NULL OR (fr.debtToEquityRatioTTM >= 0 AND fr.debtToEquityRatioTTM < 2.0))
      AND p.marketCap > 2000000000
      AND p.sector IS NOT NULL
      AND p.exchange IN ('HKSE')
      AND p.isFund = false
      AND p.isEtf = false
      AND p.isActivelyTrading = true
    QUALIFY ROW_NUMBER() OVER (PARTITION BY COALESCE(p.cik, p.companyName)
                               ORDER BY p.averageVolume DESC) = 1
),
sector_medians AS (
    SELECT sector,
           PERCENTILE_CONT(0.5) WITHIN GROUP (ORDER BY ev_ebitda) AS median_ev_ebitda,
           COUNT(*) AS n_sector_stocks
    FROM universe GROUP BY sector HAVING COUNT(*) >= 5
)
SELECT u.symbol, u.companyName, u.exchange, u.sector,
       ROUND(u.ev_ebitda, 2) AS ev_ebitda_ttm,
       ROUND(sm.median_ev_ebitda, 2) AS sector_median_ev_ebitda,
       ROUND(u.ev_ebitda / sm.median_ev_ebitda, 3) AS ev_ratio_to_sector,
       ROUND((1 - u.ev_ebitda / sm.median_ev_ebitda) * 100, 1) AS discount_pct,
       ROUND(u.roe * 100, 1) AS roe_pct,
       ROUND(u.de, 2) AS debt_to_equity,
       ROUND(u.marketCap / 1e9, 2) AS mktcap_b
FROM universe u JOIN sector_medians sm ON u.sector = sm.sector
WHERE u.ev_ebitda / sm.median_ev_ebitda < 0.70
ORDER BY u.ev_ebitda / sm.median_ev_ebitda ASC LIMIT 30
Run this screen on Ceta Research
What We Found
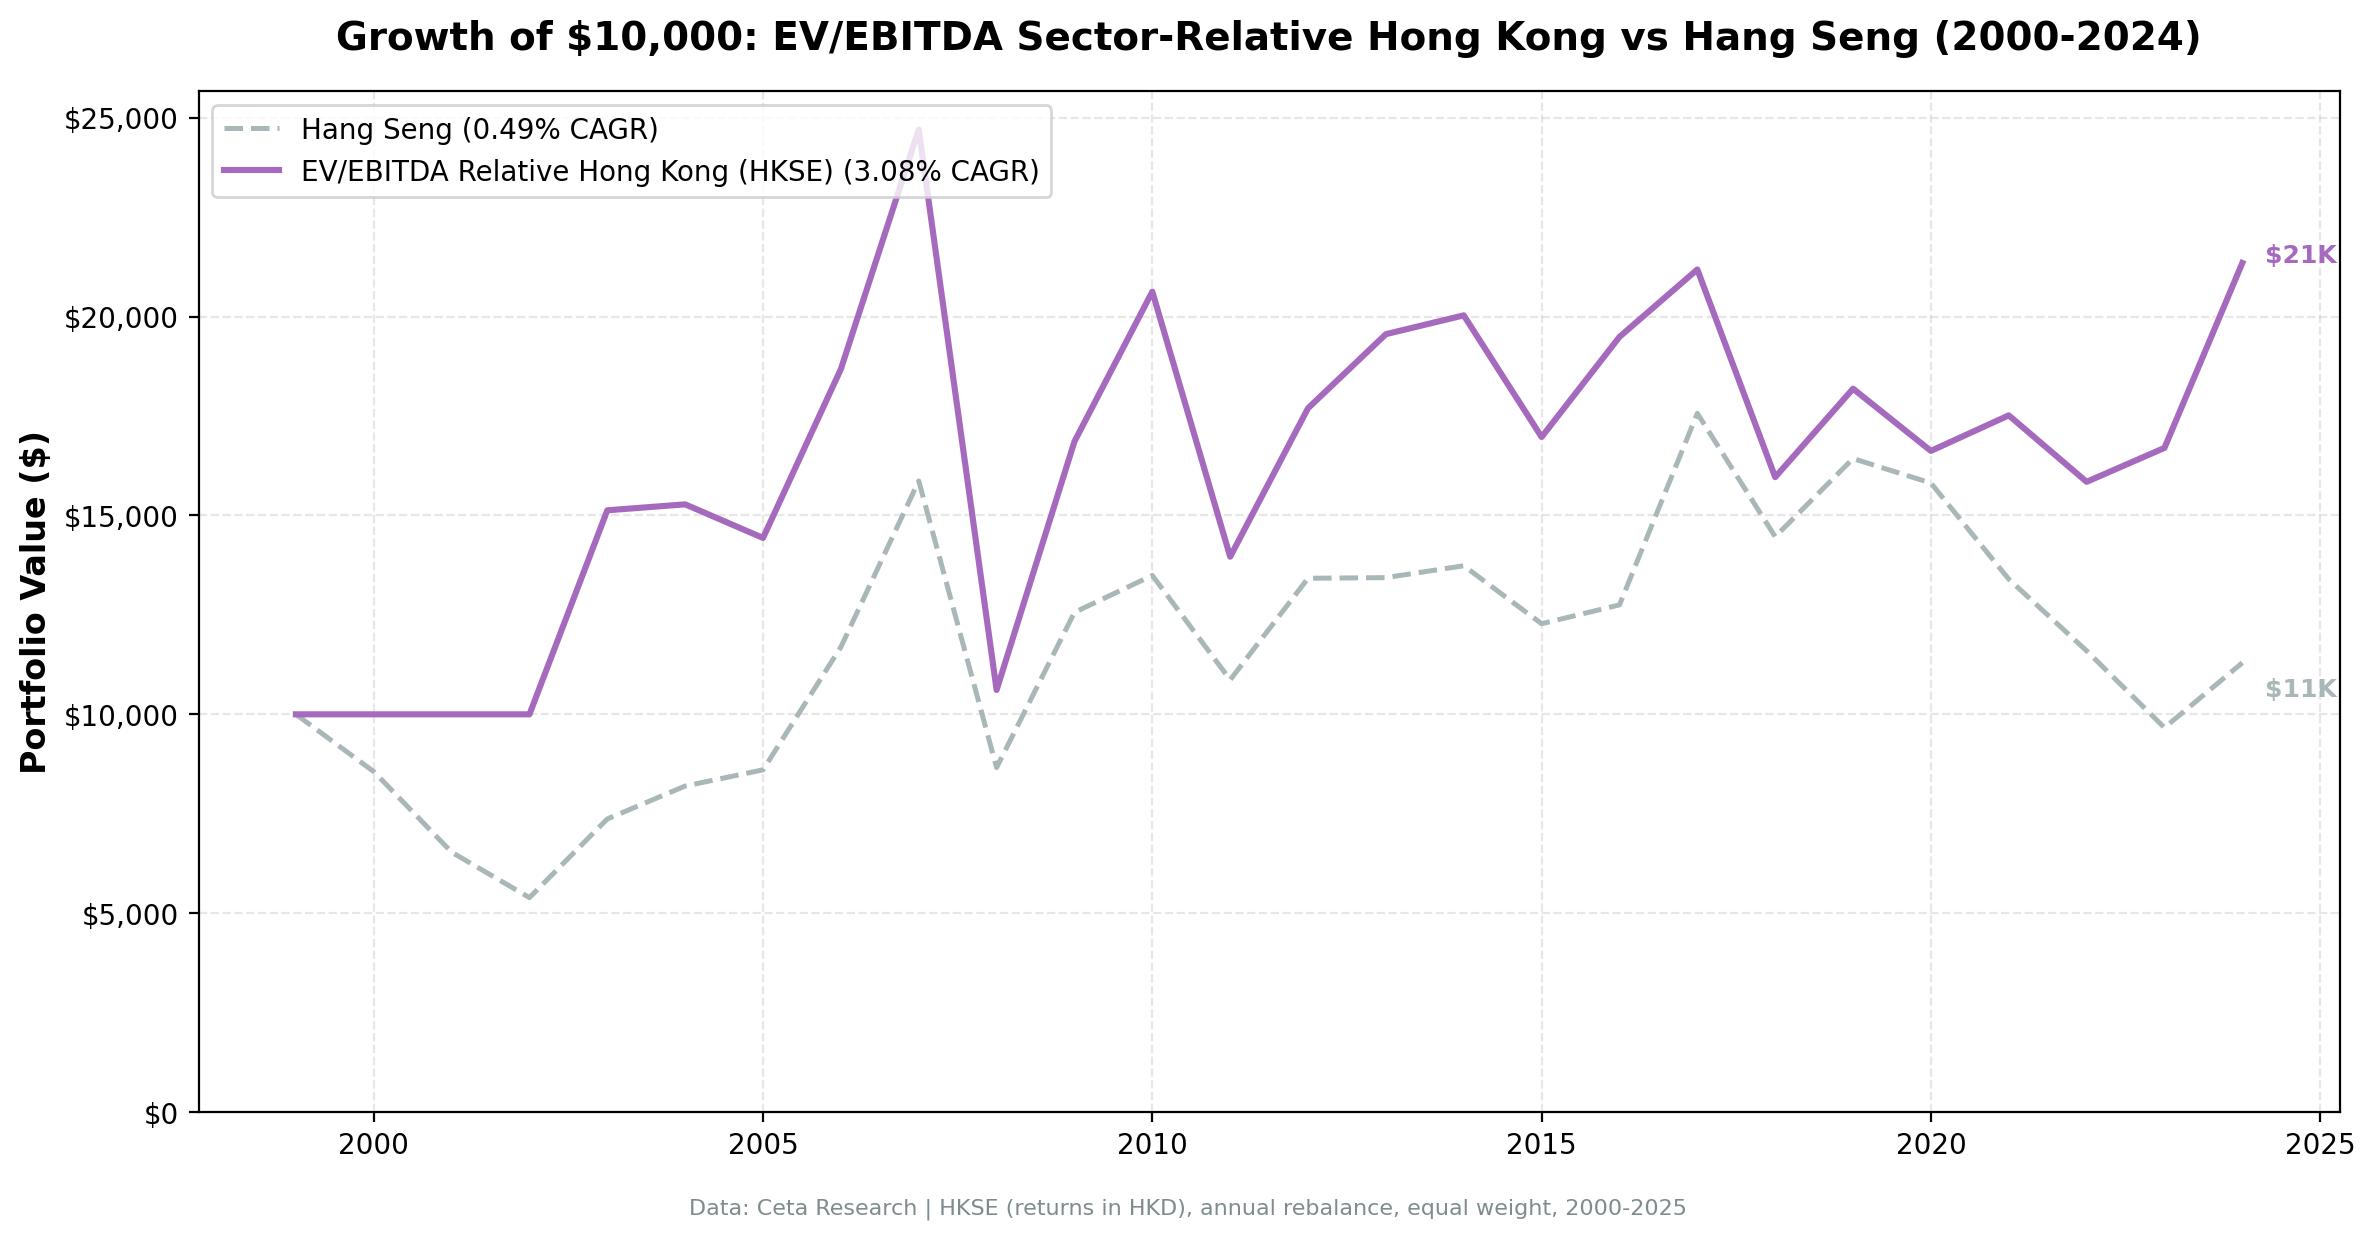
22 invested years. +2.59% headline excess, +0.09% once you strip the cash years.
| Metric | EV/EBITDA Sector-Relative (Hong Kong) | Hang Seng |
|---|---|---|
| CAGR | 3.08% | 0.49% |
| Excess return | +2.59% | — |
| Excess, invested years only | +0.09% | — |
| Total Return | 113.55% | 12.98% |
| Sharpe Ratio | 0.003 | — |
| Max Drawdown | -57.04% | -46.08% |
| Up Capture | 107.19% | 100% |
| Down Capture | 69.07% | 100% |
| Win Rate | 60% | — |
| Avg Stocks per Year | 19.5 | — |
| Cash Periods | 3 of 25 (2000-2002) | — |
The Sharpe ratio of 0.003 is the number to sit with. It says the strategy earned essentially nothing above the risk-free rate for 25 years of carrying Hong Kong equity risk, including a 57% drawdown. A +2.59% excess over an index that returned 0.49% is a comparison between two poor outcomes.
The three cash years (2000-2002) avoided a 46% cumulative fall in the Hang Seng, and that single accident of timing is where the headline excess lives. It's a real result, the cash rule is part of the strategy, but it isn't evidence that the sector-relative signal picks better stocks in Hong Kong. Over the invested years it picked stocks that matched the index to within a tenth of a point a year.
Year-by-year returns
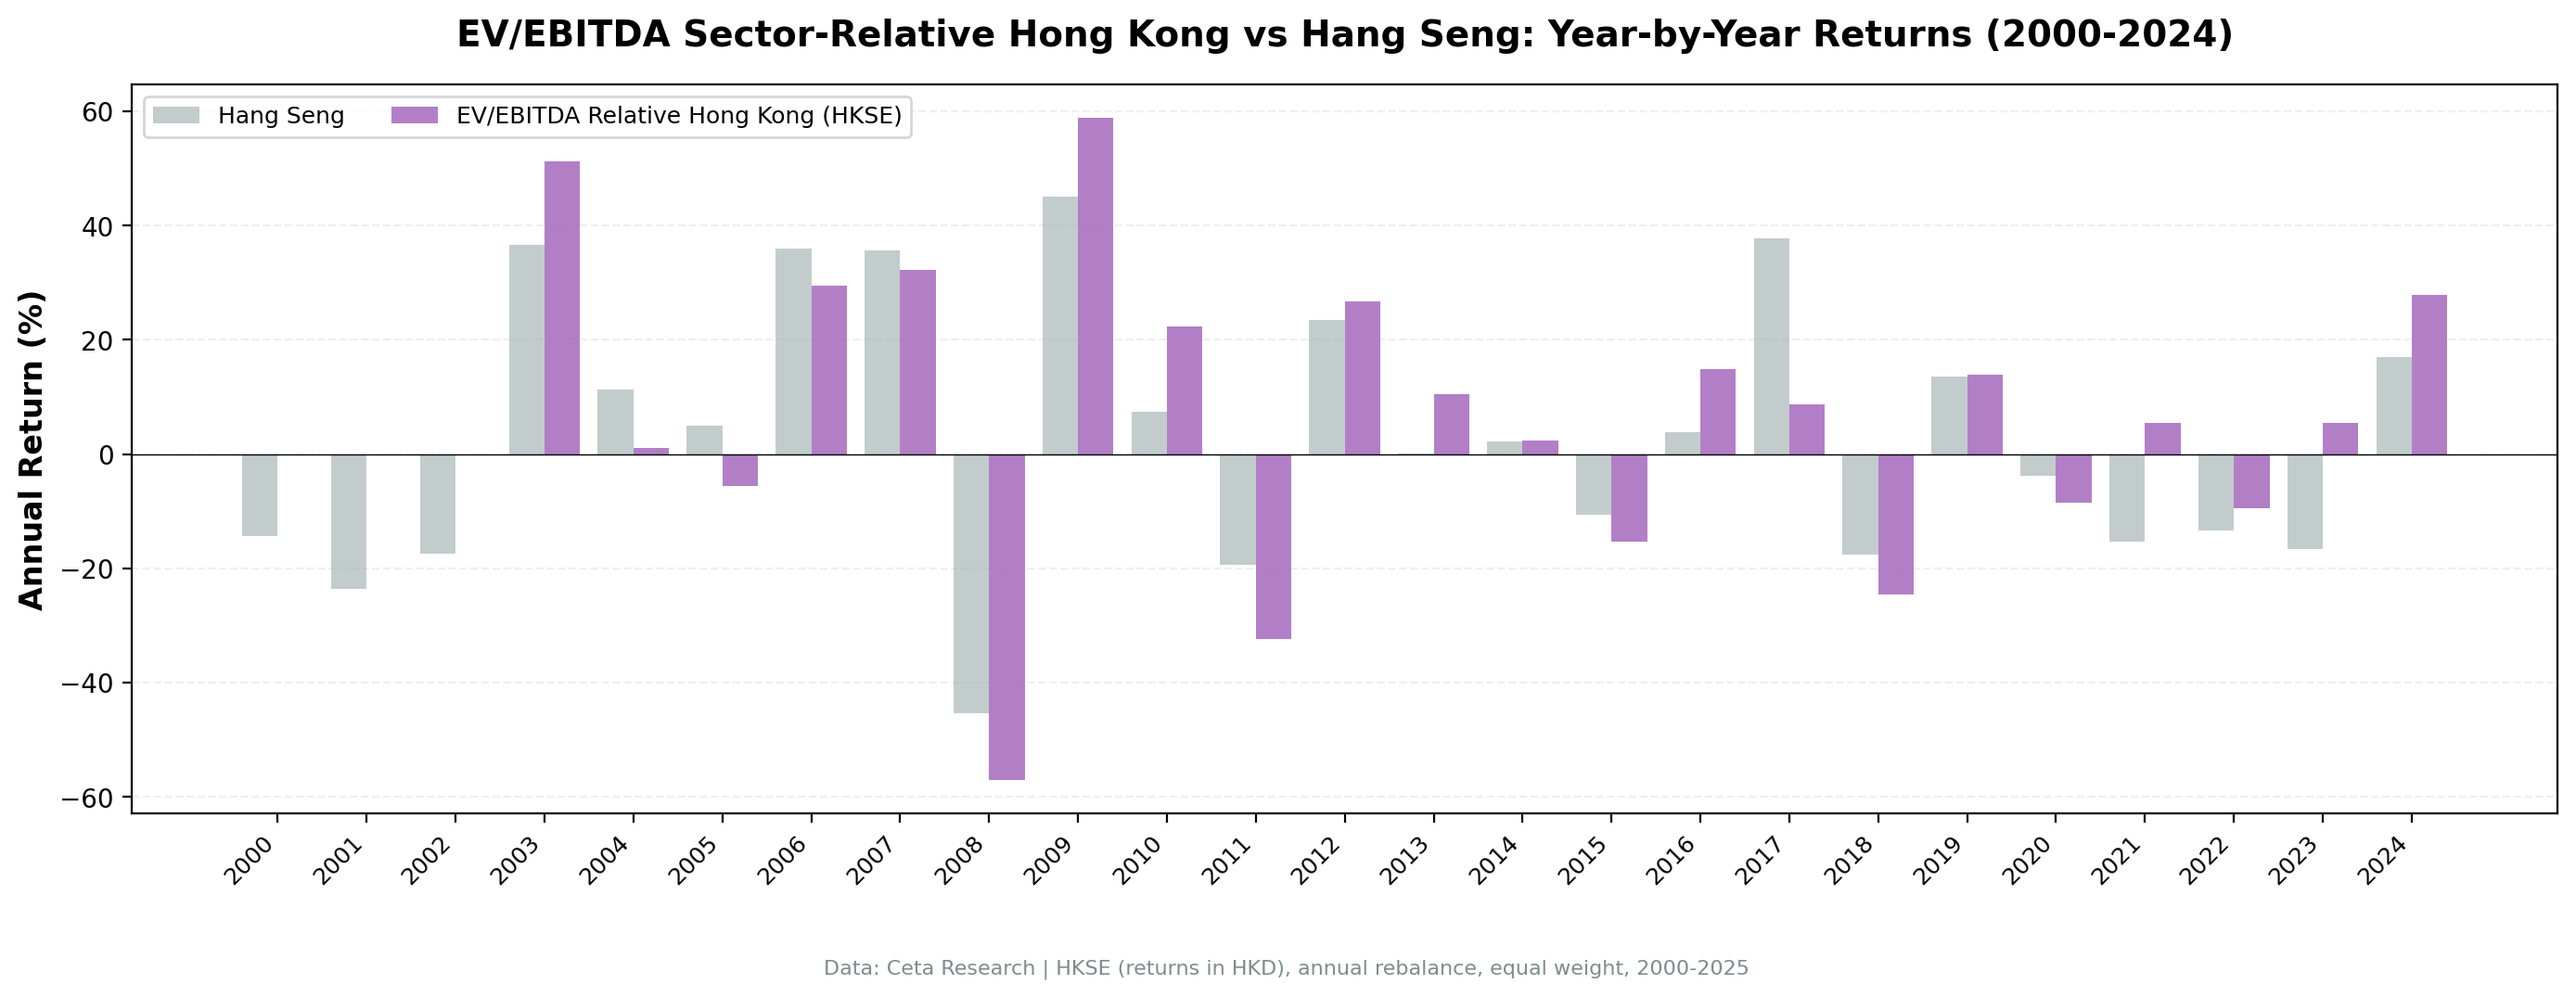
| Year | Strategy | Hang Seng | Excess |
|---|---|---|---|
| 2000 | 0% (cash) | -14.4% | - |
| 2001 | 0% (cash) | -23.7% | - |
| 2002 | 0% (cash) | -17.5% | - |
| 2003 | +51.3% | +36.7% | +14.6% |
| 2004 | +1.0% | +11.2% | -10.2% |
| 2005 | -5.5% | +5.0% | -10.5% |
| 2006 | +29.4% | +35.9% | -6.5% |
| 2007 | +32.2% | +35.7% | -3.5% |
| 2008 | -57.0% | -45.4% | -11.6% |
| 2009 | +58.9% | +45.1% | +13.8% |
| 2010 | +22.4% | +7.4% | +15.0% |
| 2011 | -32.3% | -19.4% | -12.8% |
| 2012 | +26.7% | +23.5% | +3.2% |
| 2013 | +10.5% | +0.1% | +10.4% |
| 2014 | +2.4% | +2.2% | +0.2% |
| 2015 | -15.3% | -10.6% | -4.7% |
| 2016 | +14.8% | +3.9% | +11.0% |
| 2017 | +8.7% | +37.8% | -29.1% |
| 2018 | -24.6% | -17.6% | -7.0% |
| 2019 | +13.9% | +13.6% | +0.3% |
| 2020 | -8.6% | -3.8% | -4.8% |
| 2021 | +5.4% | -15.3% | +20.7% |
| 2022 | -9.5% | -13.4% | +3.9% |
| 2023 | +5.4% | -16.7% | +22.1% |
| 2024 | +27.9% | +16.9% | +11.0% |
2008: -57.0% catastrophic loss
The global financial crisis hit HKSE-listed companies harder than most markets. Many Hong Kong-listed firms had significant mainland China exposure through real estate and banking. When Lehman collapsed and credit markets froze, those exposures became liabilities. The -57.0% single-year loss, against the Hang Seng's -45.4%, is catastrophic and impossible to recover from in any normal compounding timeline.
The structural discount problem
Several factors create persistent HKSE discounts that the signal reads as opportunity but which don't mean-revert:
Mainland Chinese listings. A large proportion of HKSE-listed companies are mainland Chinese businesses (H-shares and Red Chips). These trade at persistent discounts to their A-share or global peers for reasons that are structural: lower governance standards, related-party risk, state ownership constraints, and limited mechanisms for minority shareholder value realization.
Property developer leverage. Companies like Evergrande, Country Garden, and their peers traded at low EV/EBITDA multiples relative to sector medians for years before 2021. The signal would have included them as "cheap vs sector." The cheap multiples reflected genuine default risk, not temporary sentiment pessimism.
Political risk premium. Post-2019, Hong Kong's special administrative status became less certain. The 2019 protest movement, the 2020 National Security Law, and subsequent pressure on the independent financial market created a risk premium that rational investors applied to HKSE listings. That premium compresses multiples but doesn't revert because the underlying risk is real.
2011: -32.3% from the European crisis
The 2011 European debt crisis triggered capital flight from Hong Kong. HKSE-listed companies had significant cross-border exposure to European credit markets. The -32.3% return against the Hang Seng's -19.4%, a 12.8 point shortfall, shows how quickly HK can amplify global risk events and how little the quality filters help when it does.
2017: the worst relative year
2017 was the single largest miss in the record: +8.7% while the Hang Seng returned +37.8%, a 29.1 point shortfall. The index rally was led by mainland tech and financials trading at premium multiples. Everything the screen holds is by construction on the other side of that trade.
2021 and 2023: losing less is not winning
The Hang Seng fell 15.3% in 2021 and 16.7% in 2023. The screen returned +5.4% in both years, so those are the two largest positive excess years among the years it was actually invested, at +20.7% and +22.1%. Only 2001 beats them, and the screen was in cash that year.
Read that carefully before treating it as a success. Both years the strategy was roughly flat in absolute terms while its benchmark collapsed. The excess is genuine and it's why the local-benchmark comparison flatters Hong Kong, but an investor holding this portfolio made close to nothing in either year.
2024: +27.9%, the best year since the post-crisis rebound
Chinese government stimulus announcements drove HKSE sharply higher in 2024. The screen returned +27.9% against the index's +16.9%, an excess of +11.0%. In absolute terms it trails 2009 (+58.9%), 2003 (+51.3%) and 2007 (+32.2%), all of which came before the structural problems below took hold. This is the pattern: occasional large positive years driven by policy announcements, surrounded by long stretches of going nowhere. The signal can't predict when Beijing will announce stimulus.
Backtest Methodology
Full methodology: backtests/METHODOLOGY.md
| Parameter | Choice |
|---|---|
| Universe | HKSE, MCap > HKD 2B |
| Signal | EV/EBITDA < 70% of sector median, range 0.5-25x |
| Quality | ROE > 8%, D/E < 2.0 |
| Portfolio | Top 30 by deepest discount, equal weight |
| Rebalancing | Annual (January) |
| Cash rule | Hold cash if < 10 qualify |
| Benchmark | Hang Seng Index (HSI, HKD) |
| Execution | Next-day close after the January signal (market-on-close) |
| Period | 2000-2025 (25 years, 3 cash) |
| Data | Point-in-time (45-day lag on FY financial statements) |
| Transaction costs | Size-tiered one-way: 0.1% above $10B, 0.3% $2-10B, 0.5% below $2B |
Limitations
A Sharpe ratio of essentially zero. Over 25 years the strategy produced no meaningful return above the risk-free rate per unit of risk. Beating the Hang Seng by 2.59% annually doesn't fix this, because the Hang Seng returned 0.49%.
The excess is cash timing, not selection. Three cash years at the start avoided a 46% fall in the index. Over the 22 invested years the screen beat the Hang Seng by 0.09 points a year. Anyone reading the +2.59% headline as evidence the signal works in Hong Kong is reading it wrong.
Structural discount persistence. The core assumption of sector-relative strategies, that discounts are temporary anomalies that mean-revert, is violated by HKSE's structural pricing dynamics.
MaxDD -57.04%. The second-worst max drawdown in the study. Recovery from -57.0% requires a +133% return to break even.
Data completeness. FMP's HKSE data coverage improves post-2003. The 3 cash years at the start may partly reflect data availability rather than genuine signal failure, which matters here more than in most markets because those three years carry the entire headline excess. The invested track record starts from 2003.
Conclusion
Sector-relative EV/EBITDA on HKSE produced 3.08% CAGR against the Hang Seng Index's 0.49%, an excess of +2.59% a year. On the headline it's one of the stronger local-benchmark results in this study. It shouldn't be read that way. Three years in cash while the index fell 46% account for almost all of it, and over the 22 invested years the screen beat the index by 0.09 points annually.
The problem isn't the signal construction or the quality filters. It's the nature of HKSE discounts. Property developer leverage, mainland listing risk premiums, political uncertainty, and governance concerns create discounts that look like value opportunities but are reflections of structural risk. The signal can't distinguish between "temporarily cheap" and "cheap for a reason that won't change."
A Sharpe ratio of 0.003 and a 57% drawdown are the honest summary. We're publishing the decomposition rather than the headline because reporting the headline alone would be misleading.
Data: Ceta Research (FMP financial data warehouse). Returns in HKD (local currency), benchmarked against the Hang Seng Index in HKD. Past performance does not guarantee future results. See full methodology at github.com/ceta-research/backtests.
Past performance does not guarantee future results. This is educational content, not investment advice.

