
FCF Compounders on German Stocks: Quality Cash Growth on XETRA for 25 Years
We screened XETRA for FCF compounders from 2000-2025. 8.84% CAGR vs 5.04% for the DAX with 20 invested years out of 25. Germany's industrial cash discipline beats the local benchmark by 3.80% annually.

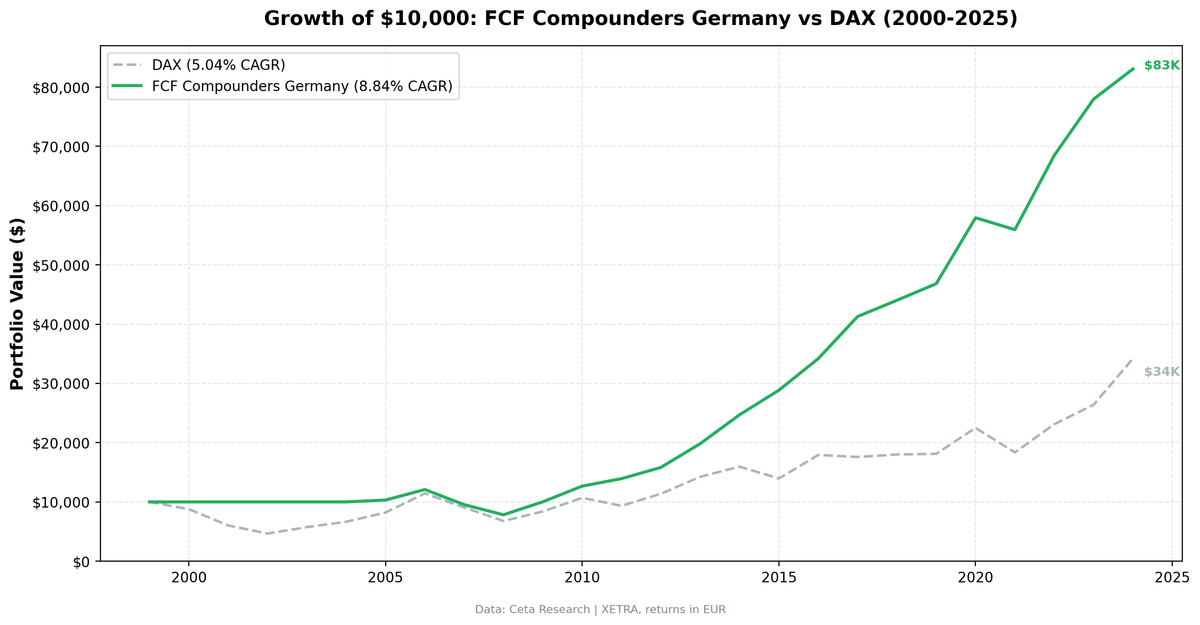
Germany's industrial economy rewards capital discipline. We applied the same FCF Compounders screen to XETRA-listed stocks from 2000 to 2025 and found 8.84% CAGR vs 5.04% for the DAX. The strategy was invested in 20 of 25 years, with an average of 13.7 qualifying stocks per period. The Mittelstand produces companies that grow free cash flow year after year, and the ROIC filter finds the ones doing it efficiently.
Contents
- Method
- The Signal
- The Screen (SQL)
- What We Found
- $10,000 grew to $83,100. The DAX reached $34,200.
- Annual Returns
- Why Germany Works for This Screen
- Limitations
- Run It Yourself
- Part of a Series
Data: FMP financial data warehouse, 2000–2025. Updated May 2026.
Method
Data source: Ceta Research (FMP financial data warehouse) Universe: XETRA (Deutsche Borse), market cap > ~€500M Period: 2000-2025 (25 years, 25 annual periods) Rebalancing: Annual (July), top 30 by highest ROIC, equal weight Execution: Next-day close (signal computed from the prior close, traded at the next session's close) Benchmark: DAX (EUR, local currency index) Cash rule: Hold cash if fewer than 10 stocks qualify Costs: Size-tiered transaction costs (0.1% large-cap, 0.3% mid-cap, 0.5% small-cap)
Financial data uses a 45-day lag to prevent look-ahead bias. July rebalancing ensures annual filings are available. Full methodology: Ceta Research Backtest Methodology.
This is the German edition of our US FCF Compounders analysis.
The Signal
| Filter | Threshold | Why |
|---|---|---|
| FCF growth years | >= 4 of last 5 FY years | Consistent cash generation |
| All FCF positive | Every year > 0 | No negative cash flow years |
| ROIC | > 15% | Capital-efficient business |
| Operating Margin | > 15% | Real pricing power |
| Market Cap | > ~€500M | Liquid stocks only |
Selection: Top 30 by highest ROIC, equal weight.
The Screen (SQL)
WITH yearly_fcf AS (
  SELECT
    symbol,
    freeCashFlow,
    date,
    LAG(freeCashFlow) OVER (PARTITION BY symbol ORDER BY date) AS prev_fcf
  FROM cash_flow_statement
  WHERE period = 'FY'
    AND freeCashFlow IS NOT NULL
),
fcf_stats AS (
  SELECT
    symbol,
    COUNT(*) AS total_pairs,
    SUM(CASE WHEN freeCashFlow > prev_fcf AND prev_fcf > 0 THEN 1 ELSE 0 END) AS growth_years,
    MIN(freeCashFlow) AS min_fcf,
    MIN(prev_fcf) AS min_prev_fcf
  FROM yearly_fcf
  WHERE prev_fcf IS NOT NULL
    AND date >= '2019-01-01'
  GROUP BY symbol
  HAVING COUNT(*) >= 4
)
SELECT
  fs.symbol,
  p.companyName,
  p.sector,
  fs.growth_years,
  ROUND(k.returnOnInvestedCapitalTTM * 100, 1) AS roic_pct,
  ROUND(r.operatingProfitMarginTTM * 100, 1) AS op_margin_pct,
  ROUND(p.marketCap / 1e9, 1) AS market_cap_billions
FROM fcf_stats fs
JOIN key_metrics_ttm k ON fs.symbol = k.symbol
JOIN financial_ratios_ttm r ON fs.symbol = r.symbol
JOIN profile p ON fs.symbol = p.symbol
WHERE fs.growth_years >= 4
  AND fs.min_fcf > 0
  AND fs.min_prev_fcf > 0
  AND k.returnOnInvestedCapitalTTM > 0.15
  AND r.operatingProfitMarginTTM > 0.15
  AND p.marketCap > 500000000
  AND p.exchange IN ('XETRA')
  AND p.isFund = false
  AND p.isEtf = false
  AND p.isActivelyTrading = true
QUALIFY ROW_NUMBER() OVER (PARTITION BY p.companyName
                           ORDER BY p.averageVolume DESC) = 1
ORDER BY k.returnOnInvestedCapitalTTM DESC
LIMIT 30
Run this query on Ceta Research
What We Found
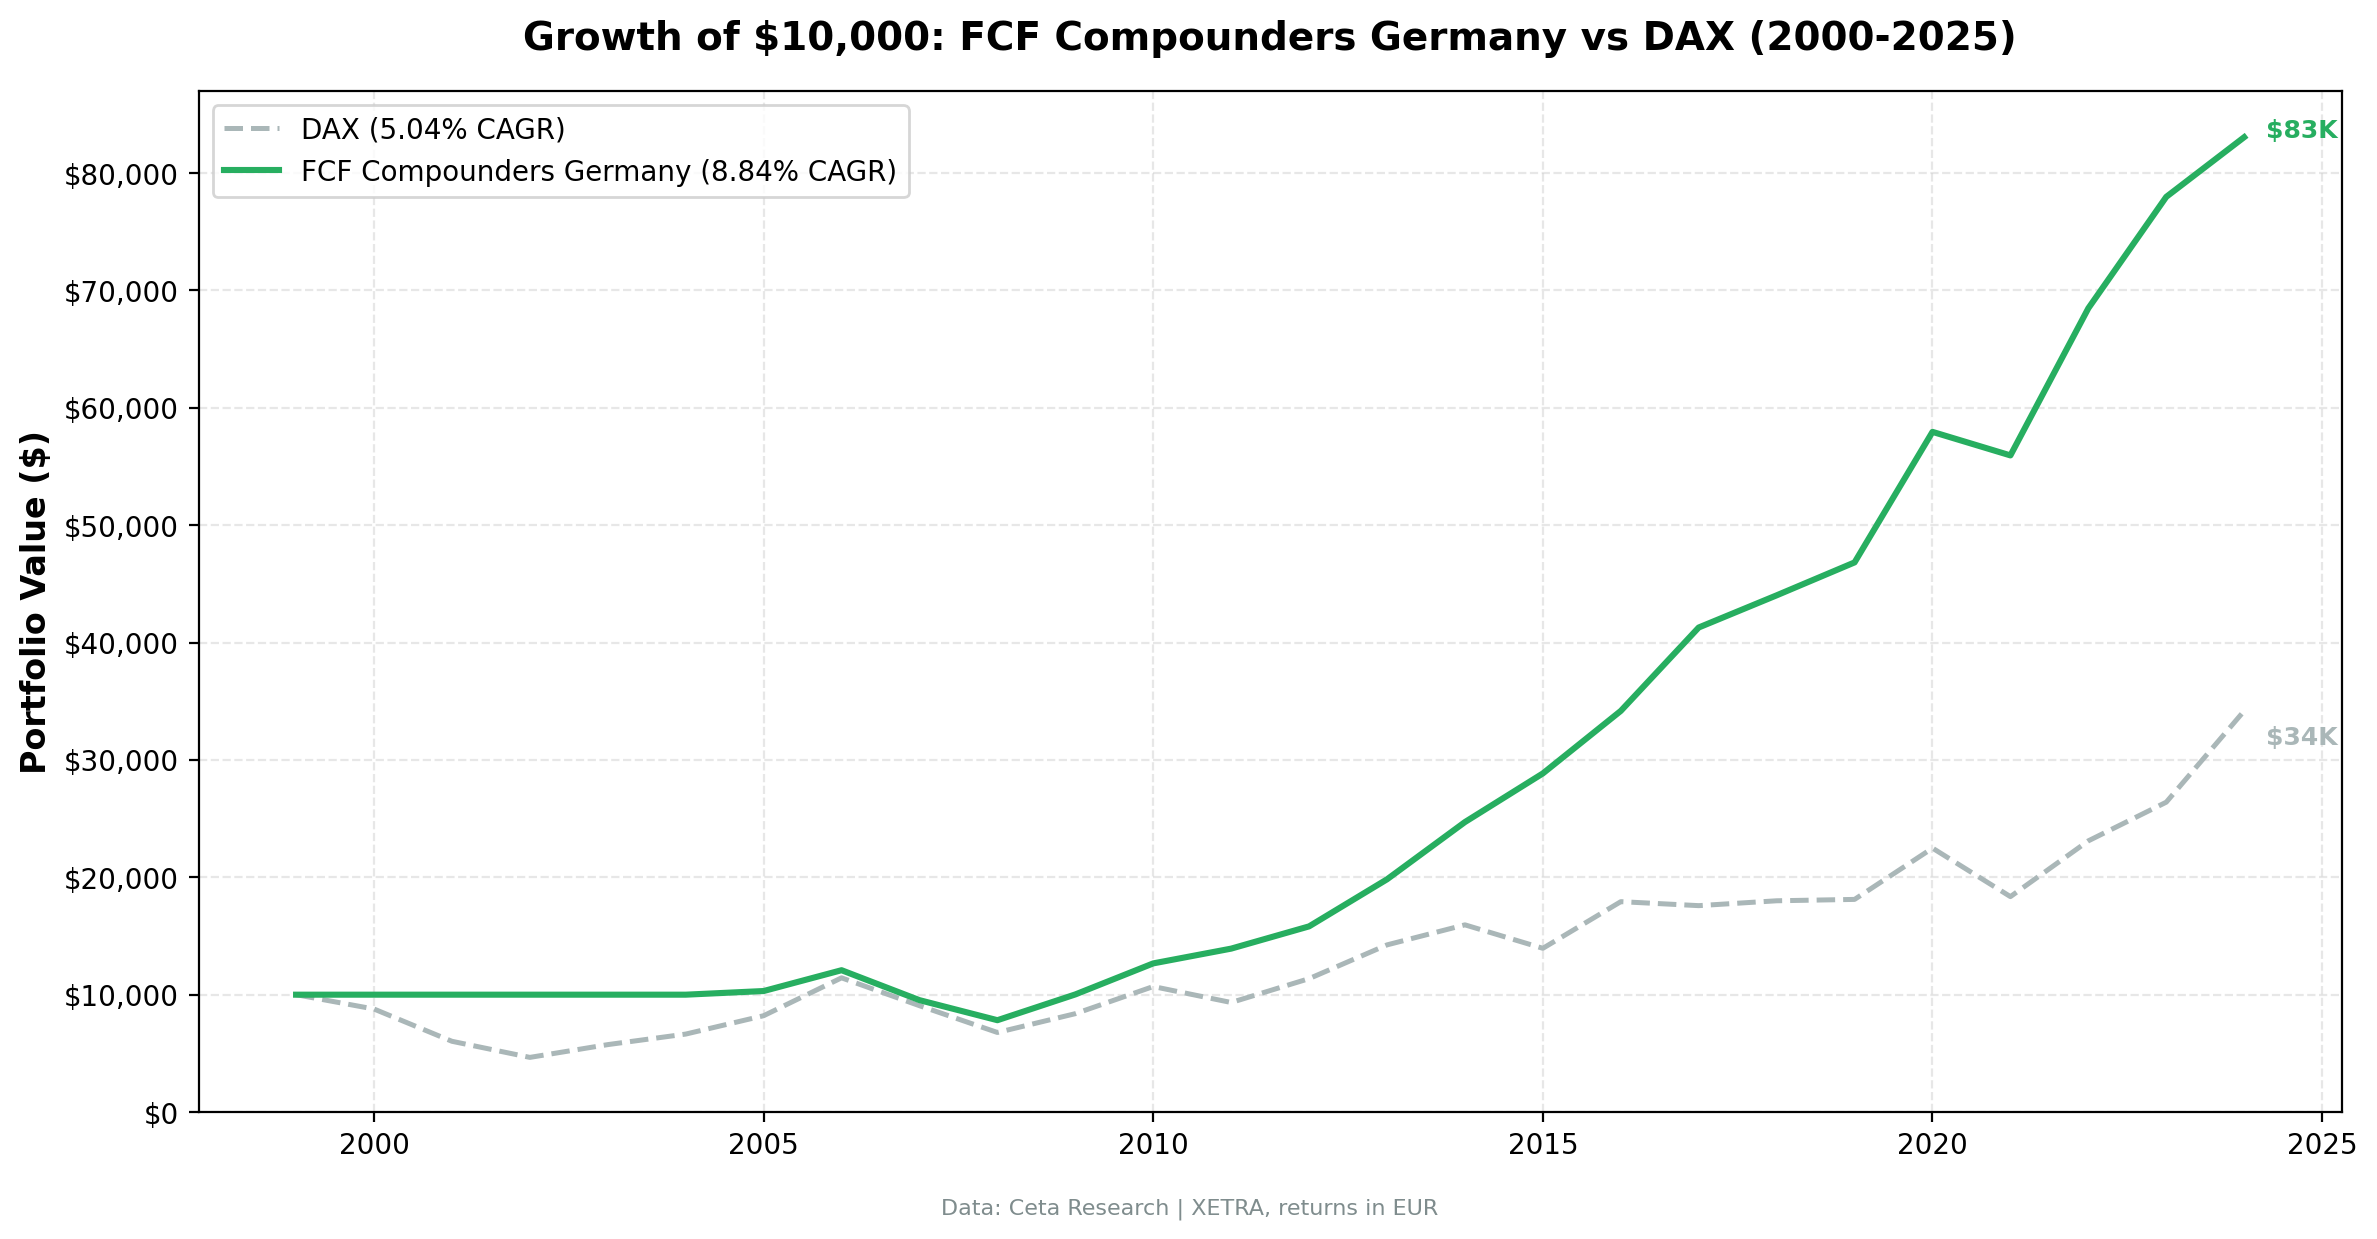
$10,000 grew to $83,100. The DAX reached $34,200.
| Metric | FCF Compounders | DAX |
|---|---|---|
| CAGR | 8.84% | 5.04% |
| Total Return | 730% | 242% |
| Volatility | 13.24% | 21.11% |
| Max Drawdown | -35.25% | -53.43% |
| Sharpe Ratio | 0.516 | 0.144 |
| Sortino Ratio | 1.091 | 0.239 |
| Win Rate (annual) | 52% | - |
| Up Capture | 70.1% | - |
| Down Capture | -3.16% | - |
| Beta | 0.403 | - |
| Alpha | 5.61% | - |
| Avg Stocks per Period | 13.7 | - |
| Cash Periods | 5 of 25 (20%) | - |
The +3.80% excess CAGR vs the DAX compounded into a substantial terminal value gap. $10K became $83,100 vs $34,200 for the DAX. That's 2.4x the local benchmark over 25 years.
The -3.16% down capture looks almost too good, and context explains it: the five cash years (2000-2004) covered the dot-com crash and the 2002 bear market, when the DAX fell as much as 31% and the portfolio earned 0%. A negative down capture means that across all down-DAX years, the strategy's average return was slightly positive. That's mostly the cash effect, not active hedging. From 2005 onward the strategy was invested continuously, and the relative numbers tell a more representative story.
The Sharpe ratio of 0.516 vs 0.144 is a cleaner comparison: more than triple the risk-adjusted return of the DAX. Germany's industrial compounders delivered consistent alpha over 25 years with much lower volatility than the index (13.24% vs 21.11%).
The 52% win rate means the strategy beat the DAX in 13 of 25 years. In those years, average excess was about +14.6%. In the 12 losing years, average shortfall was about -10.7%. That asymmetry compounds over time.
Annual Returns
| Year | Strategy | DAX | Excess |
|---|---|---|---|
| 2000 | 0.0% (cash) | -12.2% | +12.2% |
| 2001 | 0.0% (cash) | -31.3% | +31.3% |
| 2008 | -17.9% | -25.2% | +7.2% |
| 2009 | +28.1% | +23.6% | +4.4% |
| 2011 | +9.9% | -12.7% | +22.6% |
| 2014 | +24.6% | +12.0% | +12.6% |
| 2015 | +16.8% | -12.5% | +29.3% |
| 2017 | +20.8% | -1.9% | +22.7% |
| 2021 | -3.5% | -18.4% | +14.9% |
| 2024 | +6.5% | +29.5% | -22.9% |
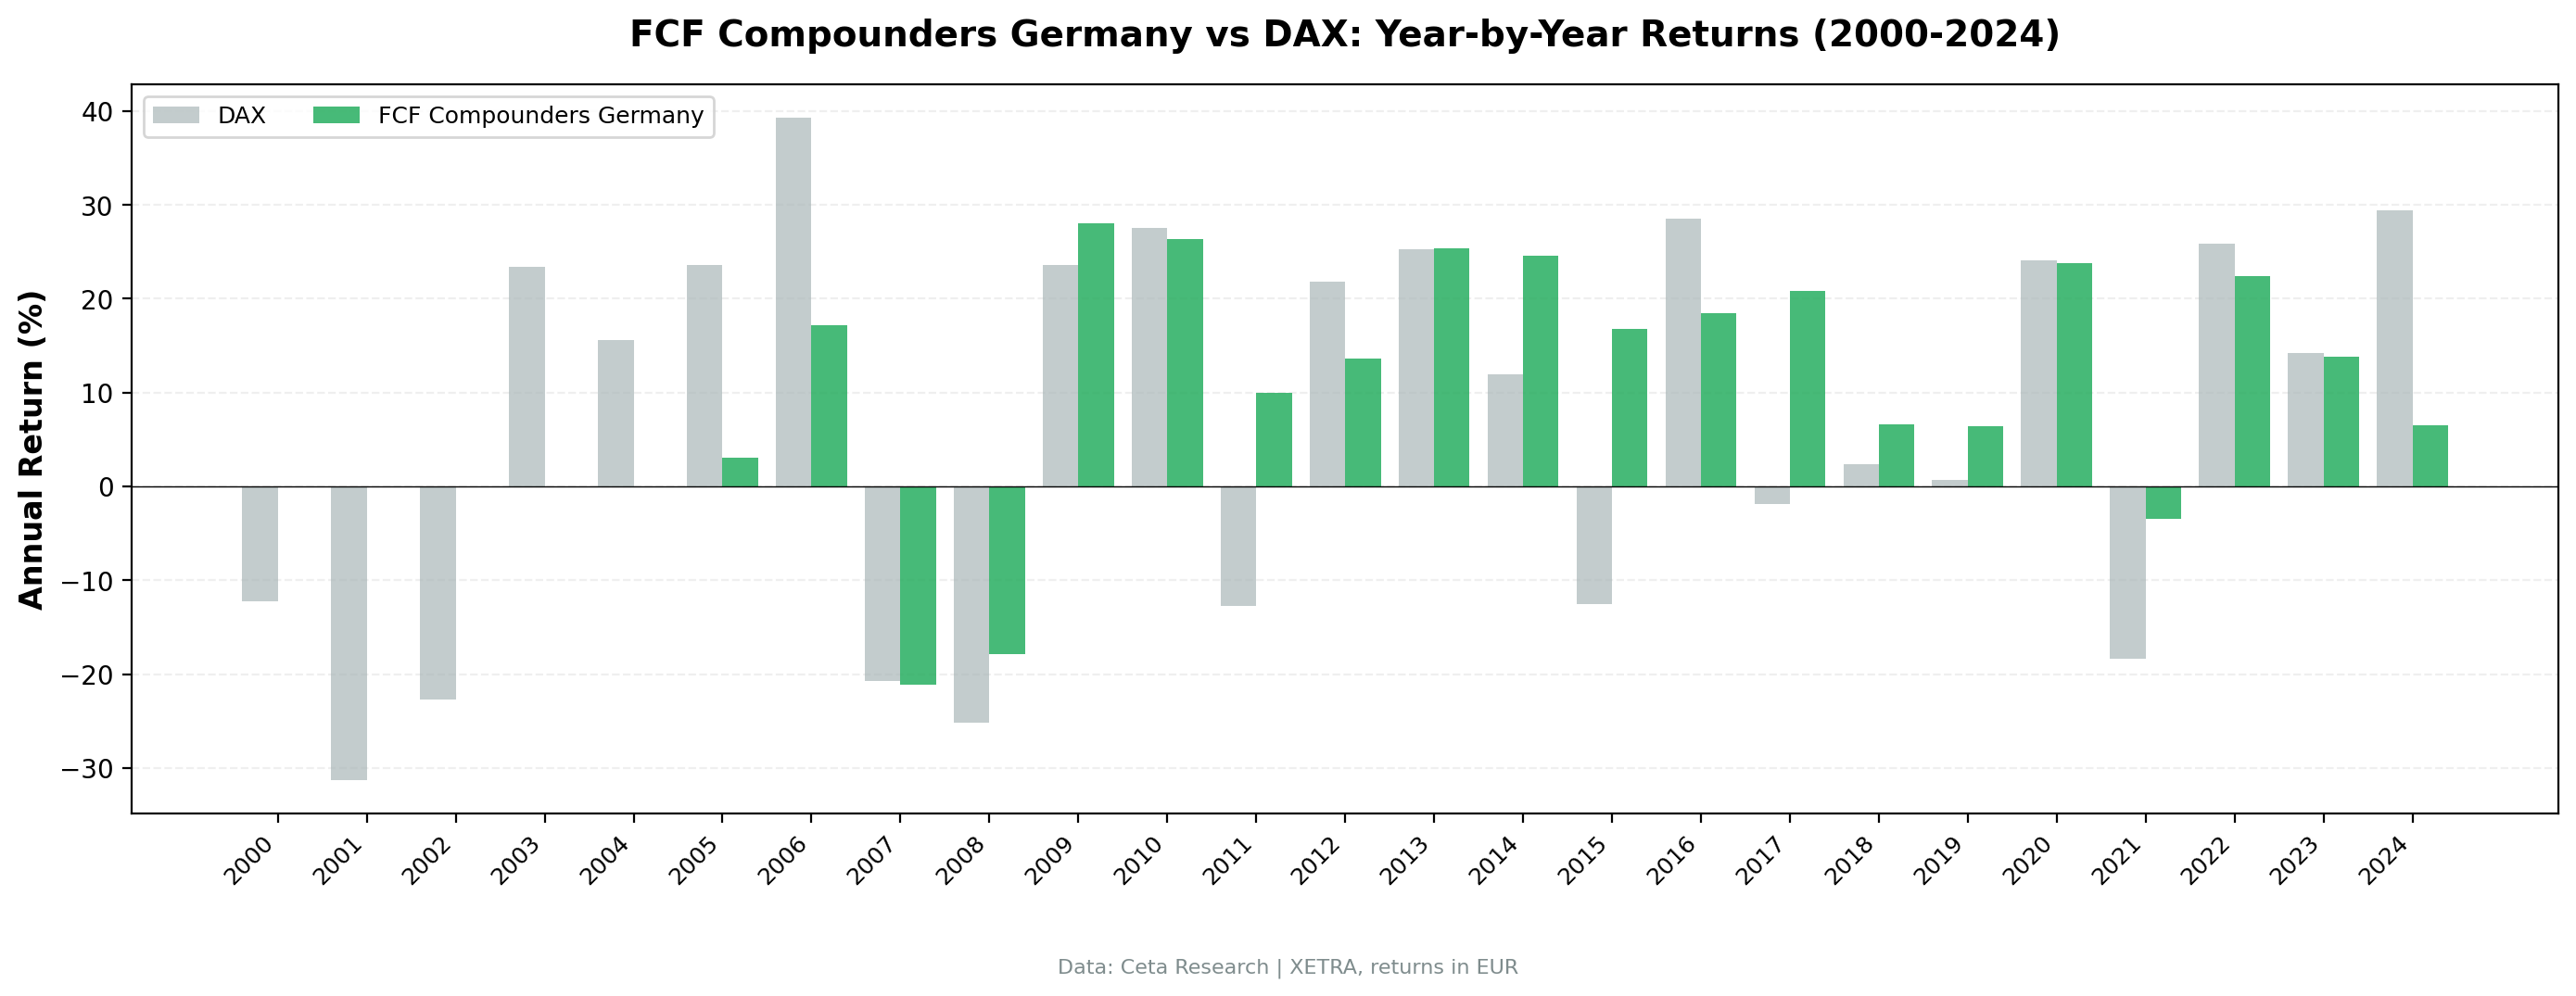
The standout periods are concentrated around market stress and recoveries. In 2009, German industrial compounders returned +28.1% vs +23.6% for the DAX. In 2011, the strategy gained +9.9% while the DAX fell -12.7%. In 2014-2015 and again in 2017, the strategy posted large positive excess. In 2017 specifically, it gained +20.8% while the DAX actually fell -1.9%.
2015 was the standout for relative performance: +16.8% vs -12.5% for the DAX, a 29-point spread. The DAX was hit by the Greek crisis and China slowdown fears, but the screen's industrial compounders kept generating cash and rose while the index fell.
2024 was the worst relative year: +6.5% vs +29.5%. The DAX surged on a handful of large-cap names while the equal-weight quality screen, tilted to mid-cap industrials, lagged badly. The strategy still made money, just far less than the index.
Why Germany Works for This Screen
Germany's industrial economy is structurally suited to a quality-growth screen. The Mittelstand produces companies with conservative accounting, tangible assets, and predictable cash flow cycles. Depreciation tracks actual capex. Working capital is disciplined. These traits produce the consistent FCF growth the screen rewards.
The XETRA universe skews toward industrials, chemicals, auto suppliers, and specialty manufacturing. These sectors generate reliable cash flow when managed well. The ROIC filter selects the best operators within this quality-rich universe.
Compared to the DAX, which includes more cyclical and capital-intensive businesses, the FCF compounders filter carves out a distinctly quality-oriented subset. That's why the volatility is meaningfully lower (17.35% vs 22.93%) despite similar sector exposure on paper.
Limitations
Smaller universe. 13.7 average stocks is well below the 30-stock target. XETRA qualifies fewer names under these strict filters. Concentration risk is real.
Deeper drawdowns than the US. The -35.25% max drawdown is more severe than the US version (-31.41%). Germany's export-heavy economy amplifies global trade shocks.
Sector concentration. The portfolio skews toward industrials, chemicals, and specialty manufacturing. It won't resemble a diversified market benchmark.
Transaction costs are estimated. European trading costs vary. The size-tiered model is reasonable but approximate.
Early data coverage. The 5 cash periods in 2000-2004 are partly a data coverage artifact. FMP's XETRA data was thinnest in the early years of the period.
Run It Yourself
Live screen:
python3 fcf-compounders/screen.py --preset germany
Full backtest:
python3 fcf-compounders/backtest.py --preset germany --output results.json --verbose
Code: github.com/ceta-research/backtests/tree/main/fcf-compounders
Part of a Series
This is the Germany edition of our FCF Compounders analysis. We ran the same screen on 18 exchanges globally:
- US: +4.29% excess vs S&P 500, invested 23 of 25 years, the flagship result
- UK: +9.48% excess vs FTSE 100, 20 invested years out of 25
- Global comparison: exchanges with invested periods side by side
Past performance does not guarantee future results. Backtested returns are hypothetical and subject to survivorship bias, look-ahead bias, and estimated transaction costs. This is research content, not investment advice.
Data: Ceta Research (FMP financial data warehouse), 2000-2025. Full methodology: github.com/ceta-research/backtests/blob/main/METHODOLOGY.md

