
What Happens to Acquirer and Target Stocks After M&A Filings
We ran an event study on 1,821 US M&A filings (2000-2025). After stricter data-quality controls, the short-term acquirer signal vanishes. The slow drift that remains is shared by both sides and concentrated in 2018-2025: universe drift, not a deal effect.

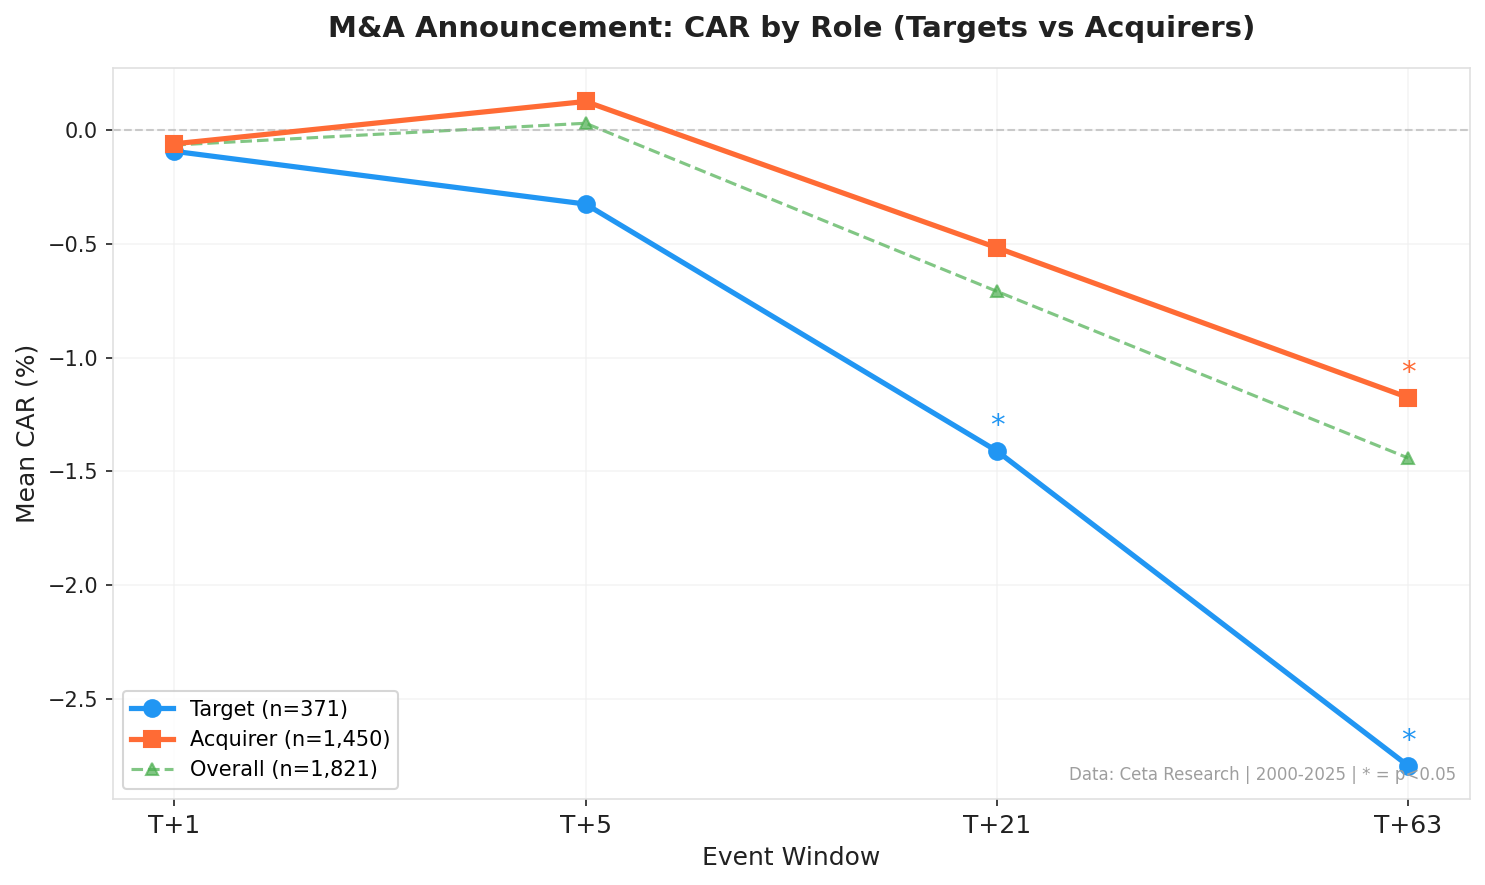
We ran an event study on 1,821 M&A announcements from 2000 to 2025, tracking how target and acquirer stocks move against the S&P 500 after a deal is filed. An earlier version of this study showed a small positive acquirer reaction in the first days. We tightened the data-quality controls, removing phantom price spikes and sub-dollar penny-stock events, and that signal disappeared. What's left is slower and points one way: both targets and acquirers drift below the market over the following one to three months. And that same-direction drift turned out to be the real finding: decomposed, it belongs to the universe M&A stocks live in, not to the deals.
Contents
Data: FMP financial data warehouse, 2000-2025. Updated June 2026.
Method
We used the mergers_acquisitions_latest table, which contains SEC-sourced M&A filing data from FMP. Each row is an acquirer reporting a target company to regulators.
A few things to know about the data before we get to results.
It's SEC filing data, not press announcements. The transactionDate field is when the deal was filed with the SEC, which can be days or weeks after the press release. By the time a filing hits, some of the initial price reaction is already in.
It needs deduplication. The average deal generates 2.9 filings because different share classes of the same acquirer file separately. We collapse to one event per (symbol, transaction date) pair.
Coverage is selective. Not every public M&A deal appears in this dataset. Coverage improved after 2016. About half of target companies have no price data in our warehouse because they're private or foreign. We only include targets with price data in the target pool.
The universe isn't exchange-filtered. An earlier version of this post described the sample as US stocks on NYSE, NASDAQ and AMEX. That was wrong, and we've corrected it. The backtest applies no exchange filter at all. The universe is whatever symbol appears as acquirer or target in the SEC-sourced filing table, has price data in the warehouse, and clears a $1B market cap. It comes out overwhelmingly American because SEC filings are American: 93.1% of the 1,821 events are US-domiciled. The largest single slice of the remaining 6.9% is 2.9% whose domicile doesn't resolve at all, almost all of them targets whose company profiles likely disappeared when the deal closed. The leading identified foreign domiciles are Ireland at 1.0%, the UK at 0.8% and Canada at 0.7%, and the Irish names are mostly tax-inversion domiciles trading on US exchanges. But it isn't a curated US-listed universe. The 1,165 symbols include OTC-quoted names and at least one foreign listing (9984.T, Tokyo). The correction matters for what the benchmark comparison below can mean, not for the numbers, which are unchanged.
No deal price or terms. This is the biggest limitation. We can't compute deal spreads, premium percentages, or deal-type breakdowns. This is a post-announcement return study, not a traditional merger arbitrage analysis.
Data-quality controls. This version adds two filters the earlier run lacked. First, we strip phantom price rows: cases where a stock's adjusted close spikes twofold or more and reverts within a day or two. Those are broken split adjustments and holiday artifacts in the vendor data, not real moves. Second, we drop events where the entry price is below $1 or the first-day stock move exceeds 200%, which flags penny stocks and bad price data rather than genuine deal reactions. Together they trimmed the sample by about 12% versus the earlier run, and they removed the short-term signal that run reported. That tells you the signal was built on noise.
Execution model. We use next-day-close entry: the baseline price is the adjusted close on the first trading day after the filing date. This is the price you'd realistically get if you see a filing at end of day and enter at the next day's close. We checked same-day entry too, and it doesn't change the conclusions.
The final dataset: 371 target events and 1,450 acquirer events, spanning 2000 through 2025. We measure cumulative abnormal returns (CAR) at T+1, T+5, T+21, and T+63 trading days. Abnormal return means the stock's return minus SPY's return over the same window. We winsorize at the 1st/99th percentile to limit the impact of extreme outliers.
What We Found
No short-term signal on either side.
In the first five trading days after a filing, neither targets nor acquirers move significantly against the market.
| Window | Acquirer CAR | t-stat | Target CAR | t-stat |
|---|---|---|---|---|
| T+1 | -0.06% | -0.95 | -0.09% | -0.72 |
| T+5 | +0.13% | 0.93 | -0.32% | -1.77 |
An earlier version of this study reported a positive acquirer reaction of +0.28% at T+1 with same-day entry, statistically significant. That result didn't survive data cleaning. Once we remove penny-stock events and phantom price spikes, the same-day acquirer number falls to +0.02% (t=0.34) and the next-day number to -0.06%. The signal was a handful of low-priced stocks with bad price data, not a market reaction to deals. Execution timing barely matters here: same-day and next-day entry both show no significant first-week move.
The drift shows up over weeks, not days.
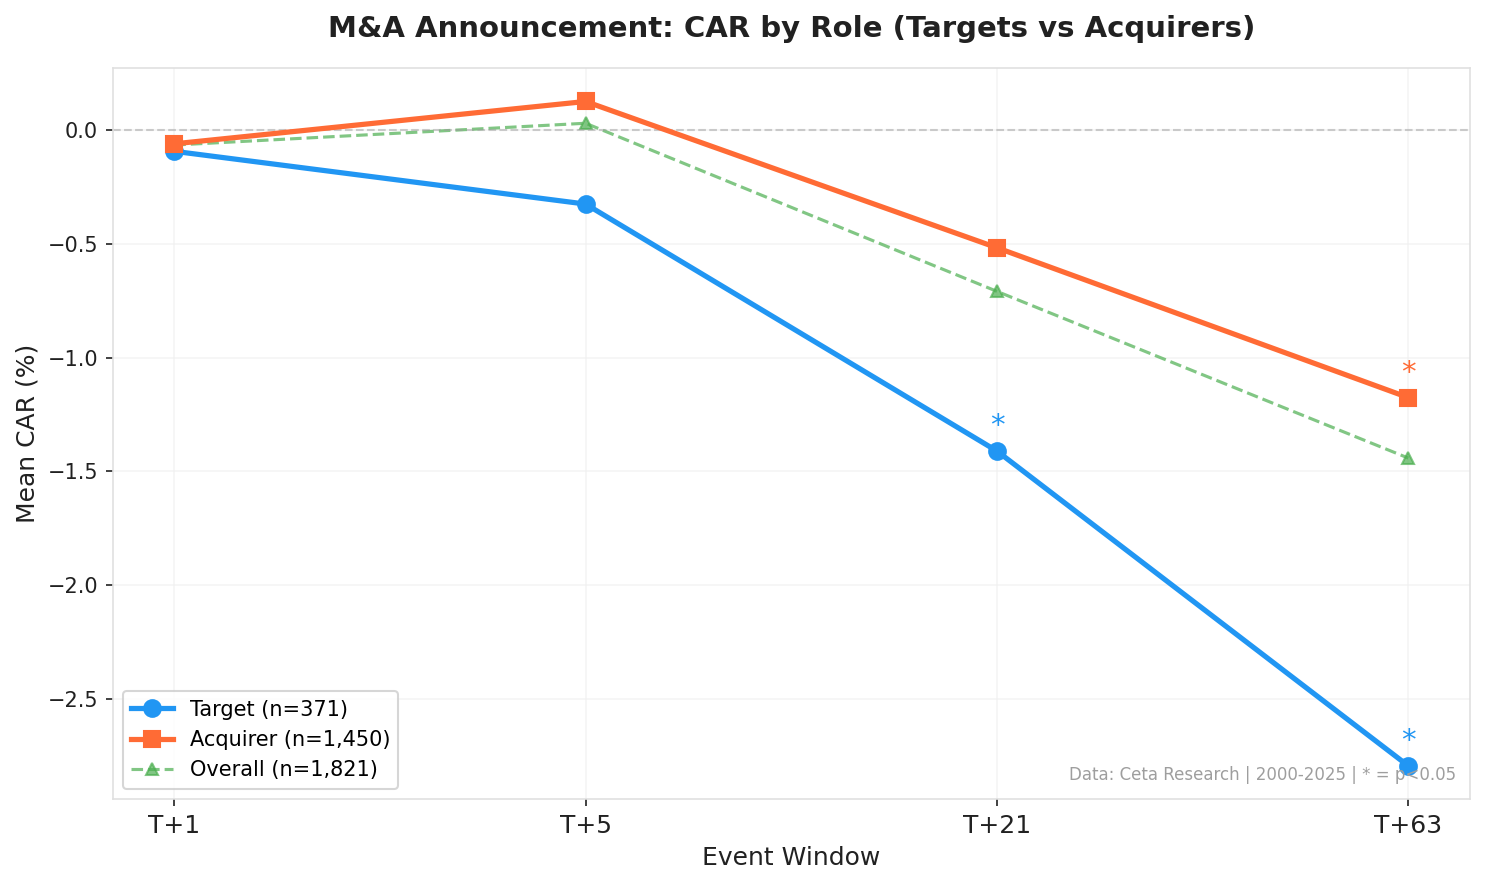
The pattern that survives cleaning is a slow negative drift. Both sides underperform the S&P 500 the longer you hold past the filing.
| Window | Acquirer CAR | t-stat | Target CAR | t-stat |
|---|---|---|---|---|
| T+21 | -0.52% | -1.79 | -1.41%* | -3.37 |
| T+63 | -1.17%* | -2.57 | -2.79%* | -2.97 |
Statistically significant at p<0.05
For targets, the most robust measurement is at 21 trading days: -1.41% (t=-3.37), with 363 of 371 events still trading, so survivorship isn't the cause. For acquirers, the drift reaches significance at 63 days: -1.17% (t=-2.57). But before reading either as a deal effect, apply the direction test: both sides drift the same way, and the target-minus-acquirer gap is not statistically significant in any drift window under the study's winsorized method (t=-1.76 at T+21, t=-1.55 at T+63). A deal-driven story (acquirer curse, deal-limbo discount) should separate the two sides. This one doesn't.
The era split settles it. The 2000-2017 half of the sample (831 events with a full 21-day window) shows no drift at all; the entire effect comes from 2018-2025. M&A-active names skew small and mid cap, and an equal-weighted basket of them trailed the cap-weighted S&P 500 through the mega-cap years. What we measured is that universe gap, not deal economics. If an integration-risk discount exists in here, it's too small to separate from that background.
The target T+63 number needs a survivorship caveat.
Targets show -2.79% at T+63, but the sample drops from 371 events at T+1 to 286 at T+63. That's 85 events, 23% of the sample, that stopped trading. Most are completed deals where the target was delisted after the acquisition closed. The targets still trading at 63 days are disproportionately those where the deal stalled, faced regulatory challenge, or fell apart. The -2.79% is measuring that troubled-deal population, not M&A targets in general. The T+21 result doesn't have this problem: 363 of 371 events are still in the sample there.
Side-by-side
| Window | Acquirer CAR | Target CAR |
|---|---|---|
| T+1 | -0.06% | -0.09% |
| T+5 | +0.13% | -0.32% |
| T+21 | -0.52% | -1.41%* |
| T+63 | -1.17%* | -2.79%* |
Statistically significant at p<0.05
The Data
| Pool | Events | T+1 CAR | t-stat | T+5 CAR | t-stat | T+21 CAR | t-stat | T+63 CAR | t-stat |
|---|---|---|---|---|---|---|---|---|---|
| Overall | 1,821 | -0.06% | -1.16 | +0.03% | 0.28 | -0.71%* | -2.92 | -1.44%* | -3.51 |
| Acquirers | 1,450 | -0.06% | -0.95 | +0.13% | 0.93 | -0.52% | -1.79 | -1.17%* | -2.57 |
| Targets | 371 | -0.09% | -0.72 | -0.32% | -1.77 | -1.41%* | -3.37 | -2.79%* | -2.97 |
* = significant at p<0.05
Note: Target T+63 n=286 (85 events delisted, mostly completed deals). Acquirer n=1,431 at T+63. Overall n=1,717 at T+63.
The aggregate picture is consistent: no measurable reaction in the first week, then significant underperformance against SPY at 21 and 63 days. That drift is the only robust measurement in this dataset, and per the era split it belongs to the universe and the benchmark rather than to the deals.
Annual event counts
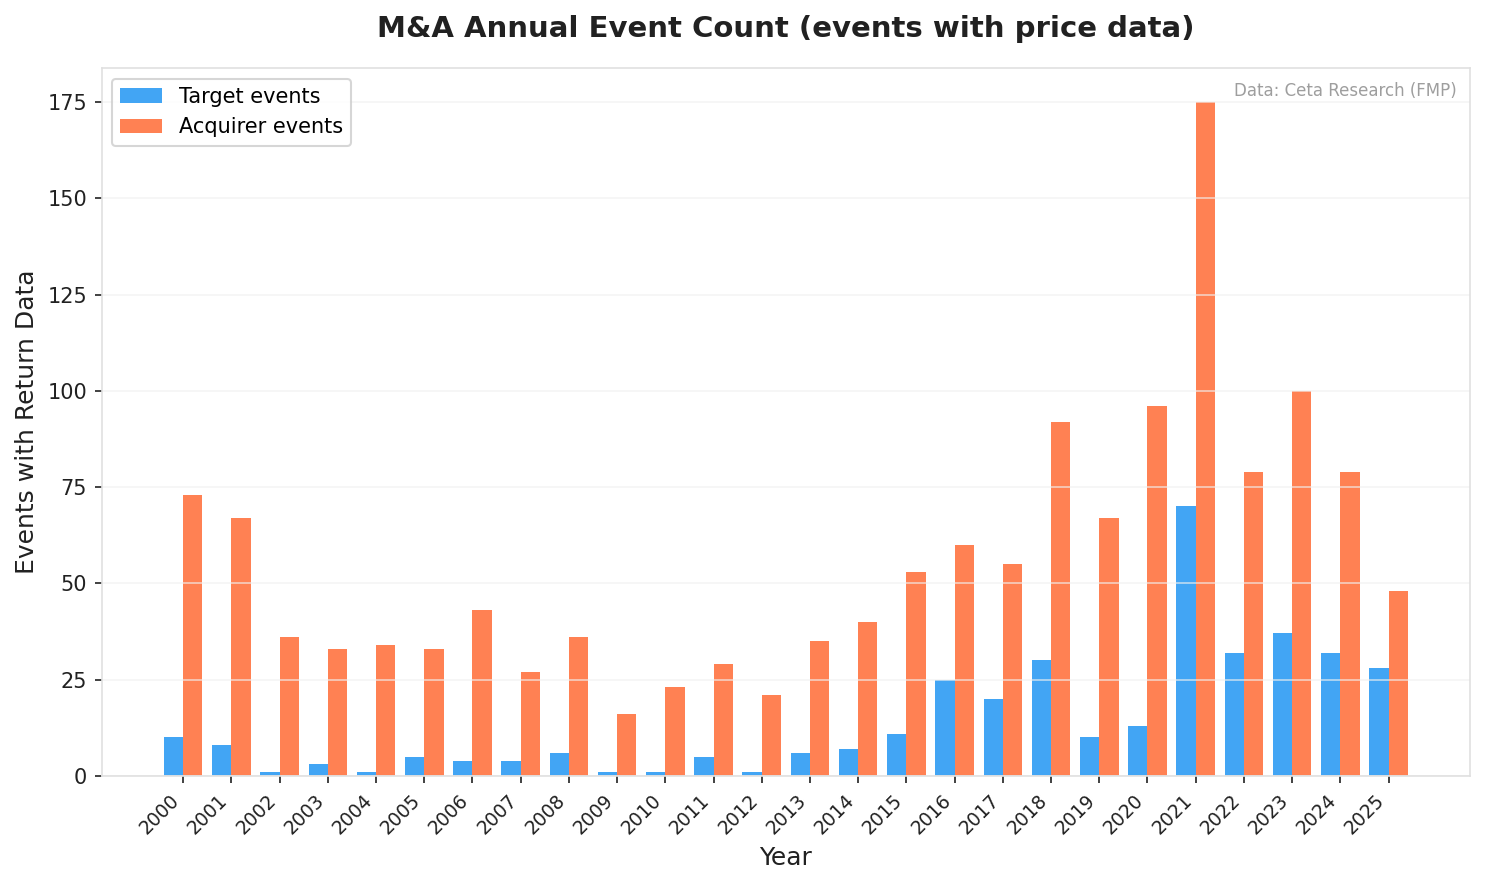
M&A activity follows the credit cycle. The 2009 financial crisis nearly stopped deals (17 total events). Activity rebuilt through the 2010s and peaked in 2021 at 245 events, driven partly by the SPAC surge. It's run at 110-140 events per year since.
Limitations
The filing-vs-announcement gap. The most important limitation. transactionDate is systematically days or weeks after the press announcement. The short-window results measure post-filing drift, not the announcement reaction. Whatever happened on press day is already in the price before we start measuring.
No deal terms. We can't split by cash vs stock deals, premium size, deal size relative to acquirer, or hostile vs friendly. All of these affect how markets react. We're averaging across a heterogeneous population.
No deal outcome tracking. Failed deals get pooled with completed deals in the shorter windows, and they drive the T+63 target survivorship problem. For targets, failed deals produce extreme negative returns.
Coverage selectivity. Not every M&A deal is in this dataset. Coverage expanded sharply after 2016 (2021 has far more events than 2010). We don't know what systematic differences exist between covered and uncovered deals.
SPY as benchmark. SPY captures broad market movement but doesn't control for sector or size. An acquirer in a strong sector will look better against SPY than a sector-matched benchmark would show. Weighting is the bigger problem, and it's what produced the drift we report. We average events equally while SPY weights by market cap, so any stretch where mega caps outrun the rest of the market registers as negative abnormal return for an equal-weighted basket. That's the most likely mechanism behind the 2018-2025 concentration. Confirming it would take a rerun against an equal-weighted or size-matched benchmark, which we haven't done.
What This Tells You
The headline is a negative one, and that's the honest read. There's no tradeable short-term edge here. The acquirer pop that earlier research, and our own earlier run, pointed to doesn't survive once you clean the price data. If you're holding an acquirer or a target when a deal is filed, the first week is a coin flip against the market.
What's consistent is the slow drift, and its honest attribution. Over one to three months, both sides tend to underperform the S&P 500: targets by about -1.4% at 21 days, acquirers by about -1.2% at 63 days. Because the two sides never separate and the whole effect lives in 2018-2025, we read this as M&A-active small and mid caps trailing a cap-weighted index in the mega-cap era, not as deal-limbo pressure or an acquirer curse. Either way the practical conclusion holds: nothing here is large enough to trade after costs, and the target's longer-horizon number is contaminated by delistings.
The broader lesson is about method. A short-term signal that vanishes when you remove sub-dollar stocks and broken price rows was never a signal. Data quality isn't a footnote in event studies. It's often the whole result.
Screen for Current M&A Activity
To see deals filed in the last 90 days, run this query on Ceta Research:
WITH recent AS (
    SELECT
        symbol AS acquirer,
        targetedSymbol AS target,
        companyName AS acquirer_name,
        targetedCompanyName AS target_name,
        CAST(transactionDate AS DATE) AS deal_date,
        ROW_NUMBER() OVER (
            PARTITION BY targetedSymbol, CAST(transactionDate AS DATE)
            ORDER BY acceptedDate DESC
        ) AS rn
    FROM mergers_acquisitions_latest
    WHERE CAST(transactionDate AS DATE) >= CURRENT_DATE - INTERVAL '90' DAY
      AND targetedSymbol IS NOT NULL AND TRIM(targetedSymbol) != ''
      AND NOT (symbol LIKE '%-WT' OR symbol LIKE '%-WS'
               OR (symbol LIKE '%W' AND LENGTH(symbol) > 5))
)
SELECT acquirer, target, acquirer_name, target_name, deal_date
FROM recent
WHERE rn = 1
ORDER BY deal_date DESC
LIMIT 30
References
- Mitchell, M. & Pulvino, T. (2001). "Characteristics of Risk and Return in Risk Arbitrage." Journal of Finance, 56(6), 2135-2175.
- Baker, M. & Savasoglu, S. (2002). "Limited Arbitrage in Mergers and Acquisitions." Journal of Financial Economics, 64(1), 91-115.
- Roll, R. (1986). "The Hubris Hypothesis of Corporate Takeovers." Journal of Business, 59(2), 197-216.
Data: Ceta Research data warehouse (FMP/SEC-sourced M&A filing data). 1,821 events, 2000-2025. Universe: symbols named as acquirer or target in SEC-sourced M&A filings, with warehouse price data and market cap above $1B. No exchange filter is applied; 93.1% of events are US-domiciled and the 1,165 symbols include OTC-quoted names and at least one foreign listing (9984.T, Tokyo). CAR = cumulative abnormal return vs SPY, an equal-weighted event average against a cap-weighted index. Winsorized at 1st/99th percentile, with sub-$1 entry prices and phantom price spikes removed. transactionDate = SEC filing date, not necessarily press announcement date. Entry: next-day close after filing (MOC execution). This is educational content, not investment advice.

