
Switzerland: +5.7% Alpha Over the SMI, 68% Win Rate
OCF momentum returned 7.4% annually on Swiss stocks vs the SMI's 1.7%, a +5.7% alpha, the strongest of all markets. Sharpe 0.41, a 68% win rate (the highest tested), -44.2% drawdown.

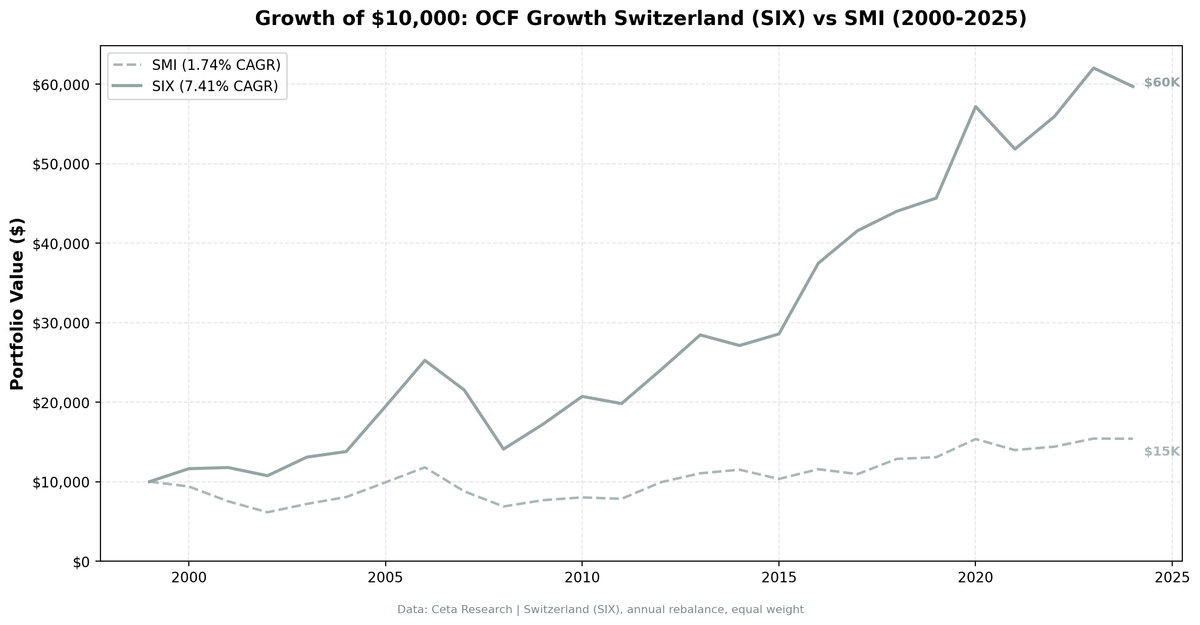
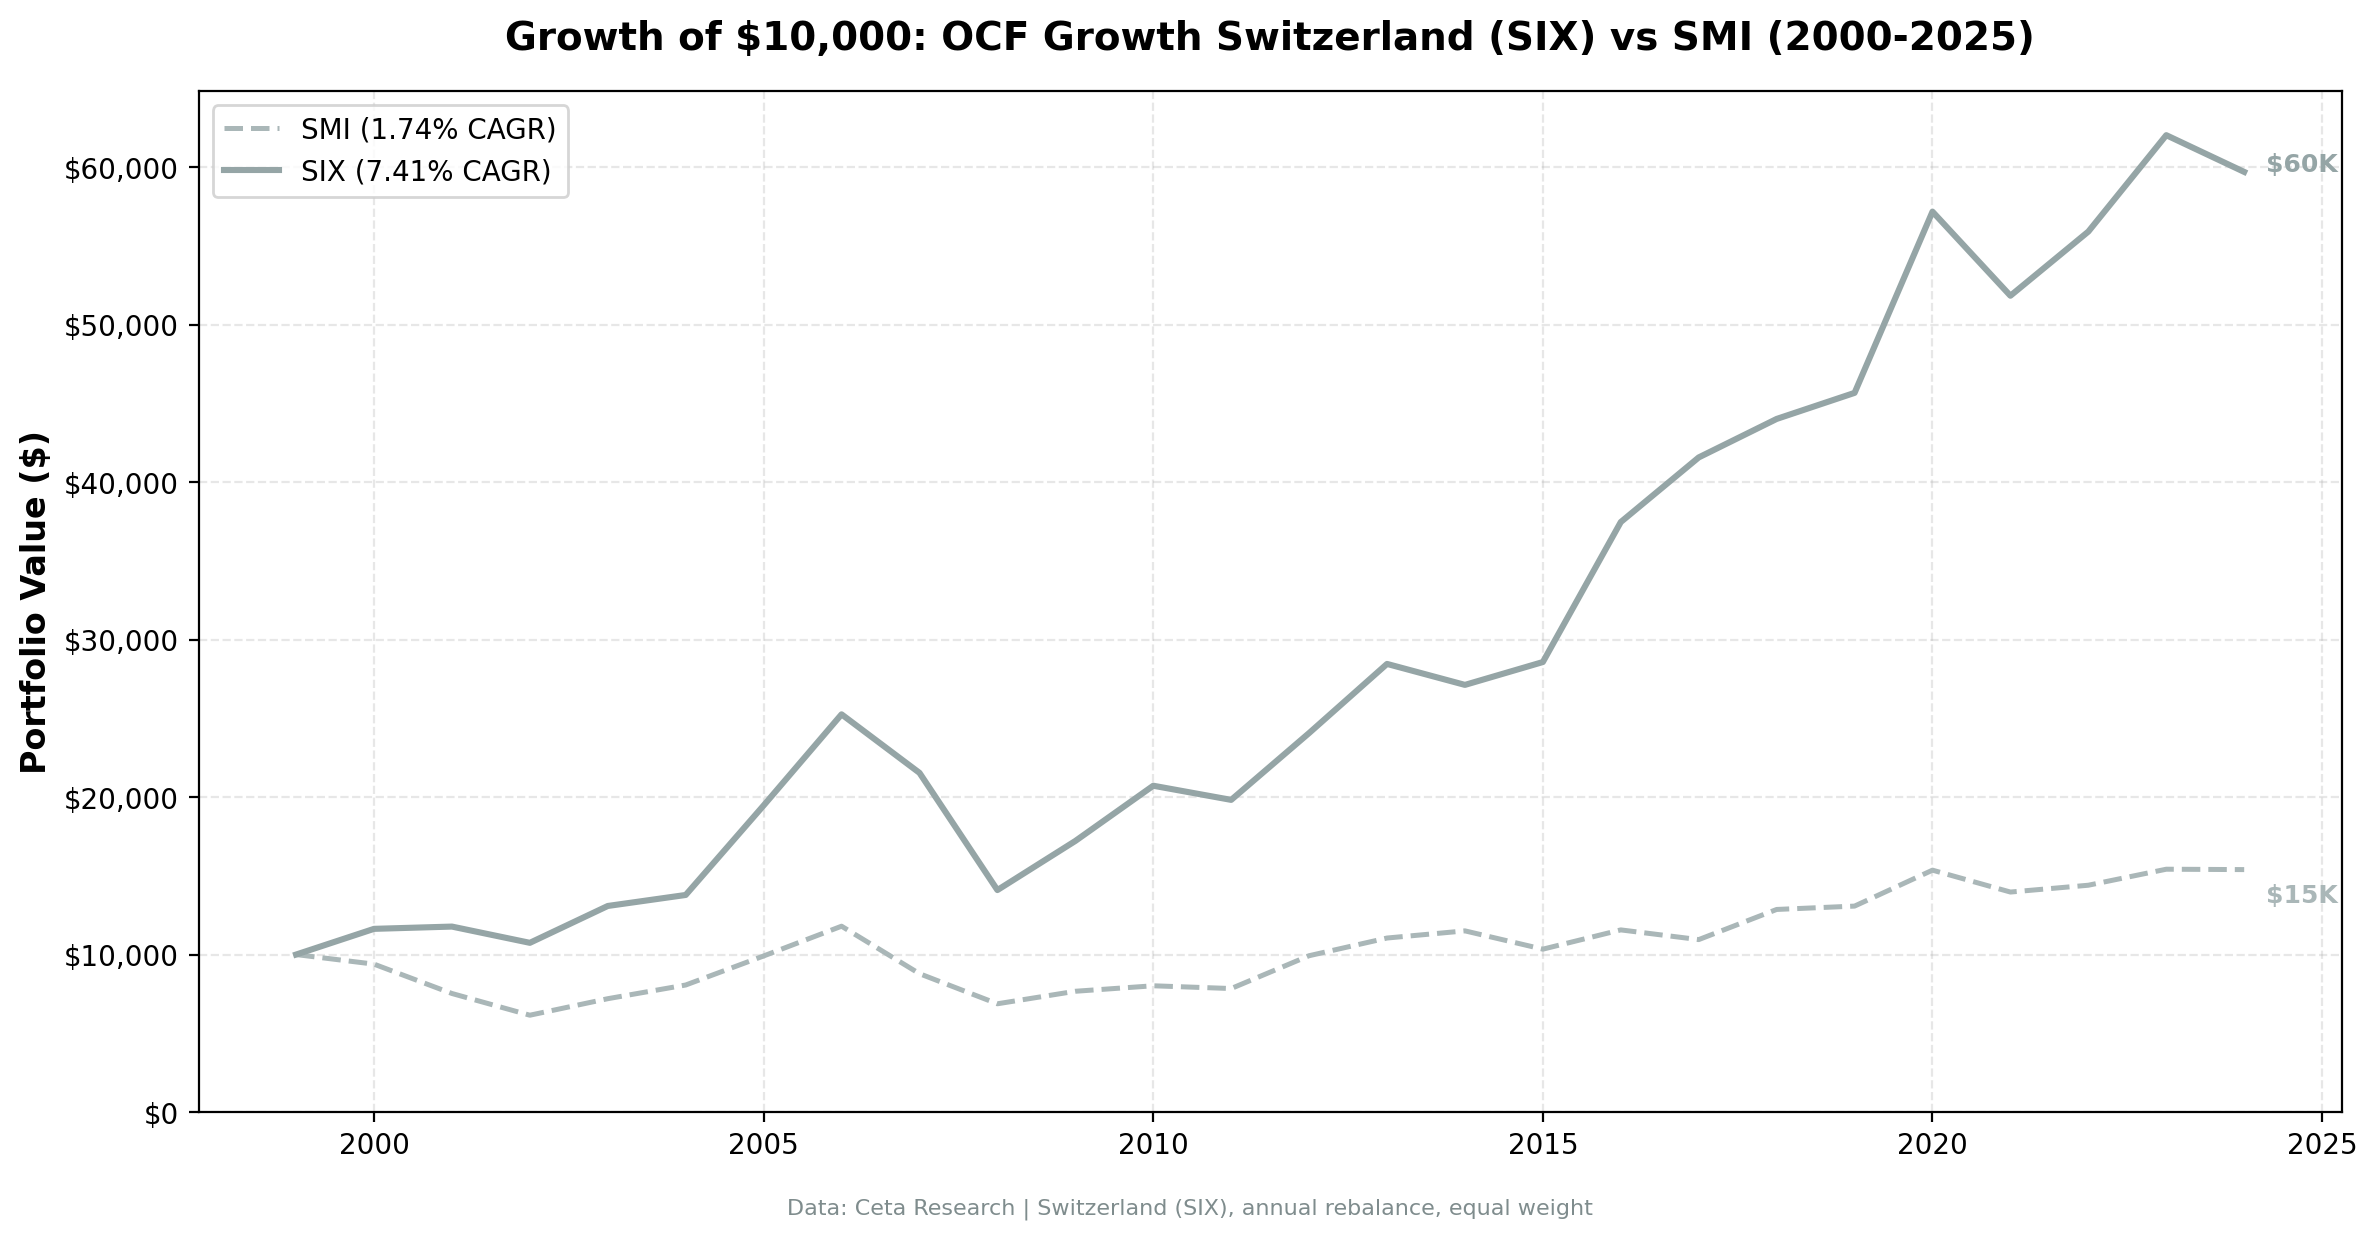
OCF momentum returned 7.4% annually on Swiss stocks, 2000-2025, beating the SMI by 5.7% per year with a Sharpe ratio of 0.41. The SMI returned just 1.7% annually. $10,000 grew to $59,686 vs SMI's $15,395, a total return of 497%. Max drawdown: -44.2% vs SMI's -41.7%. The strategy held 13 stocks on average, fully invested all 25 years, and beat the SMI in 68% of years, the highest win rate of any market we tested. Switzerland is one of the strategy's best markets: the quality screen found the actual Swiss compounders while the SMI went nowhere.
Contents
Data: FMP financial data warehouse, 2000–2025. Updated June 2026.
What We Found
| Metric | Switzerland (SIX) | SMI |
|---|---|---|
| CAGR | 7.4% | 1.7% |
| Volatility | 16.8% | - |
| Max Drawdown | -44.2% | -41.7% |
| Sharpe | 0.41 | - |
| Sortino | 0.835 | - |
| Win Rate (vs SMI) | 68% | - |
Switzerland delivered the strategy's strongest alpha: +5.7% annually over a quarter century, with the highest win rate of any market (68%) and a solid Sharpe (0.41). It came with real risk, a -44.2% drawdown, but the screen still compounded to $59,686 while the SMI barely moved. Low volatility (16.8%) reflects the sector mix (pharma, consumer staples, financials) of stable, high-quality cash flows.
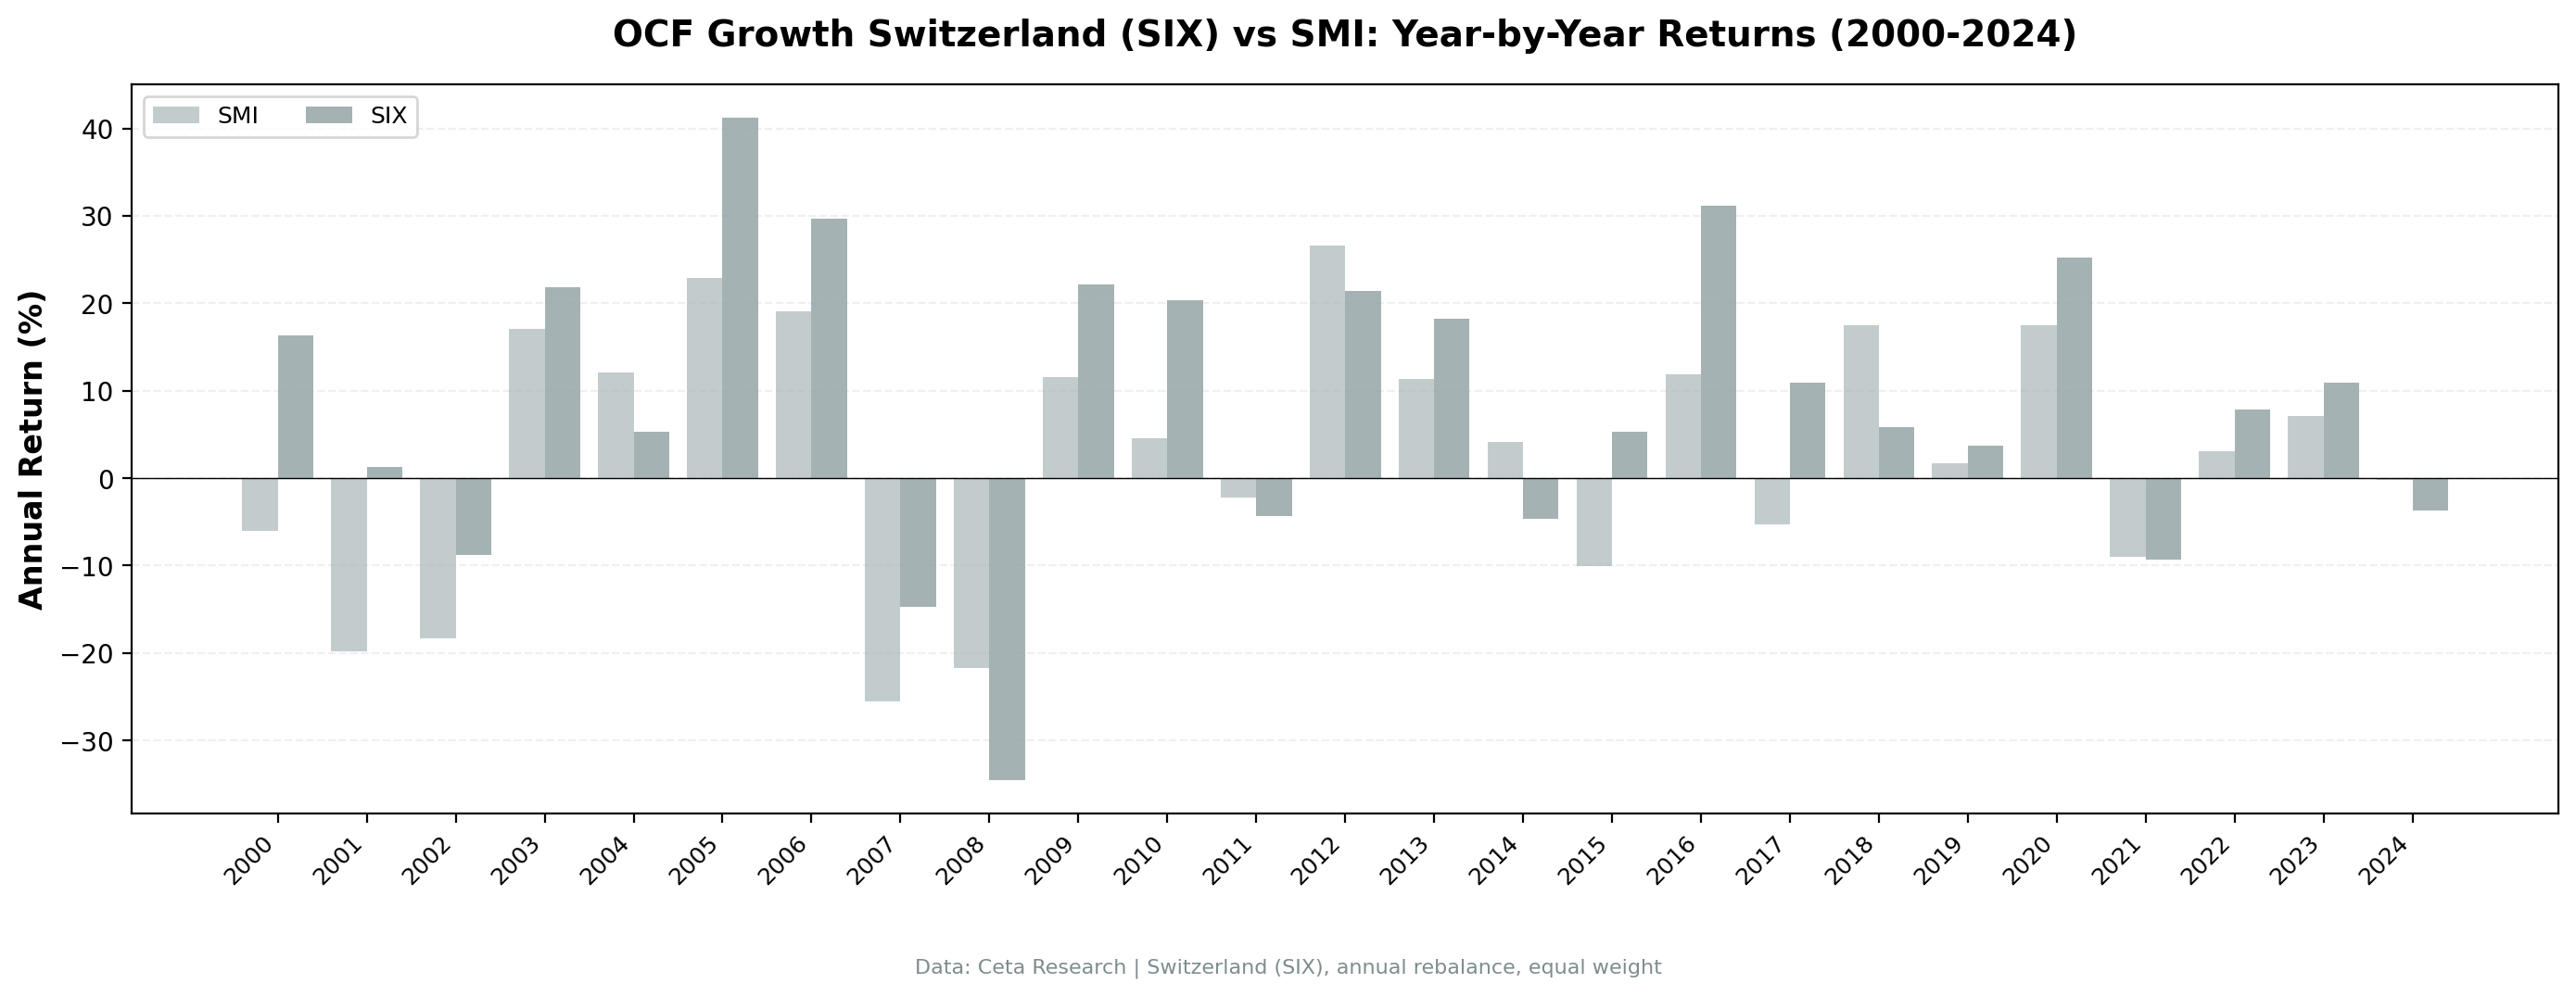
Why it worked: the SMI itself was very weak, just 1.7% CAGR over 25 years. A quality screen built on operating cash flow cut through that and found the actual Swiss compounders. The defensive, low-vol companies it selected held up in crashes and still captured the upside, so the OCF signal added real alpha rather than just preserving capital.
Part of a Series: US Results | India Results | Canada Results | Global Comparison
Run It Yourself
Screen Swiss stocks with OCF momentum on Ceta Research
Market cap threshold: CHF 500M (~$568M USD), ROE > 10%, operating margin > 5%, OCF growth > NI growth.
Takeaway: Switzerland is one of the strategy's best markets. Cash flow divergence beat the SMI by +5.7% a year (7.4% vs 1.7%) with the highest win rate we measured (68%) and a strong Sharpe (0.41). You take a -44% drawdown to get it, but you get defensive, low-vol exposure and real alpha at the same time.
Data: Ceta Research, SIX 2000-2025. Full methodology: backtests/METHODOLOGY.md
Past performance does not guarantee future results. This is educational content, not investment advice.

