Trading Studio
  • Platform
  • Blog
  • Data
Sign in Subscribe

Latest

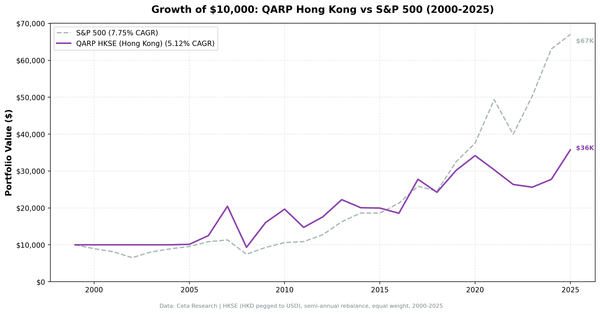
Growth of $10,000 invested in QARP Hong Kong (HKSE) vs Hang Seng from 2000 to 2025.

value investing

QARP on Hong Kong Stocks: +2.7% Alpha in a Tough Market

QARP returned 4.02% annually on Hong Kong stocks, beating the Hang Seng's 1.31% by +2.71% per year. The absolute returns are modest, but the quality screen adds real alpha over the local market.
By Swas 01 Jan 2026
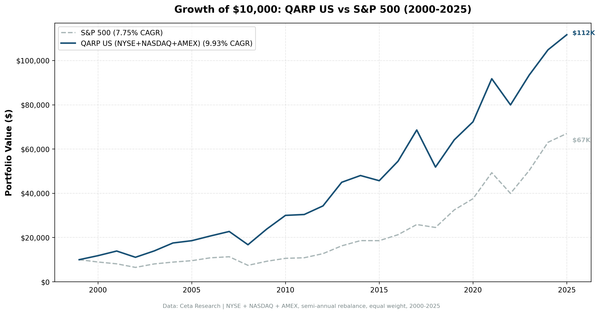
Growth of $10,000 invested in QARP US vs S&P 500 from 2000 to 2025. QARP grew to $125K, S&P 500 to $67K.

value investing

Quality at Reasonable Price: A Seven-Factor Screen Tested on 25 Years of US Stock Data

We built a systematic quality-value screen using seven quantitative criteria and backtested it across all US exchanges from 2000 to 2025. QARP returned 10.42% annually vs 7.77% for the S&P 500.

By Swas 01 Jan 2026
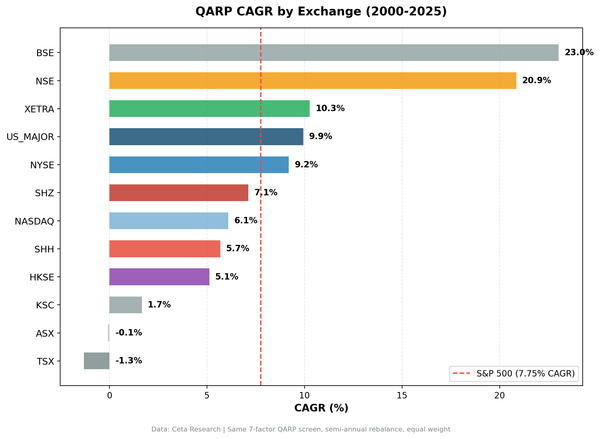
QARP CAGR by exchange from 2000 to 2025. US_MAJOR leads at 10.42%, BSE at 9.21%, XETRA at 8.75%. 12 exchanges compared to local benchmark indices.

value investing

One Stock Screen, 12 Exchanges: Where QARP Adds Alpha vs Local Benchmarks

We ran one quality-value screen across 12 exchanges and compared each to its local benchmark. Germany had the highest alpha (+3.69% vs DAX), the UK came second (+3.06% vs FTSE). India trailed the Sensex.

By Swas 01 Jan 2026
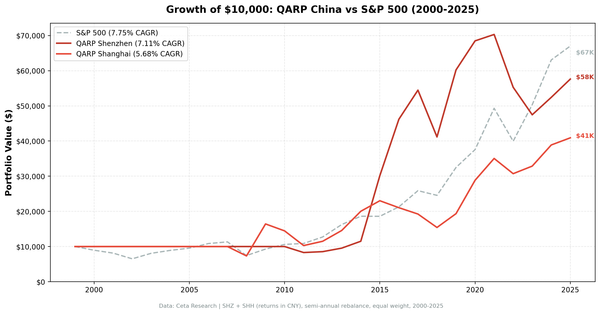
Growth of $10,000 invested in QARP China (SHZ and SHH) from 2000 to 2025.

value investing

QARP on Chinese Stocks: Quality Screening in the World's Second-Largest Market

Shanghai QARP returned 6.09% annually, beating the SSE Composite by +2.38%. Shenzhen returned ~4.86% but lacks a local benchmark comparison. Volatile, streaky, and structurally different from Western markets.

By Swas 01 Jan 2026
See all
Trading Studio
Powered by Ghost

Trading Studio

Quantitative market research & data analysis