
Switzerland P/E Compression: The Edge Belongs to Foreign Listings
P/E compression on Swiss-listed stocks returns 2.46% vs 1.90% for the SMI. That +0.56% is smaller than the index dividend yield, rests on 12 investable years of 25, and flips to -1.62% on a Swiss-domiciled universe.

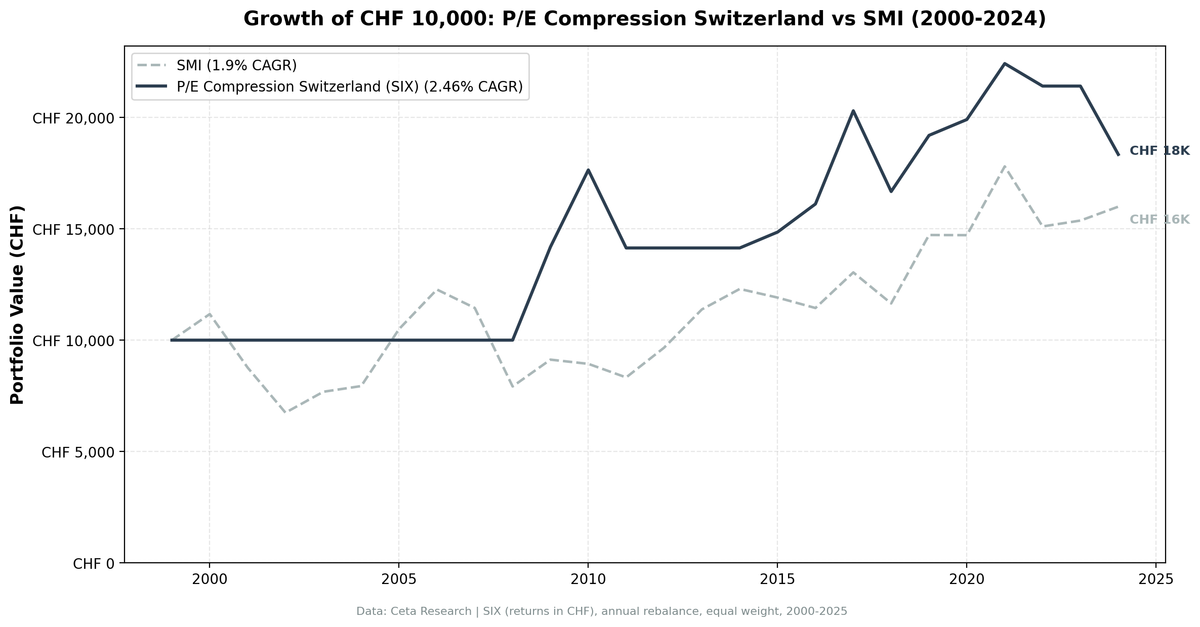
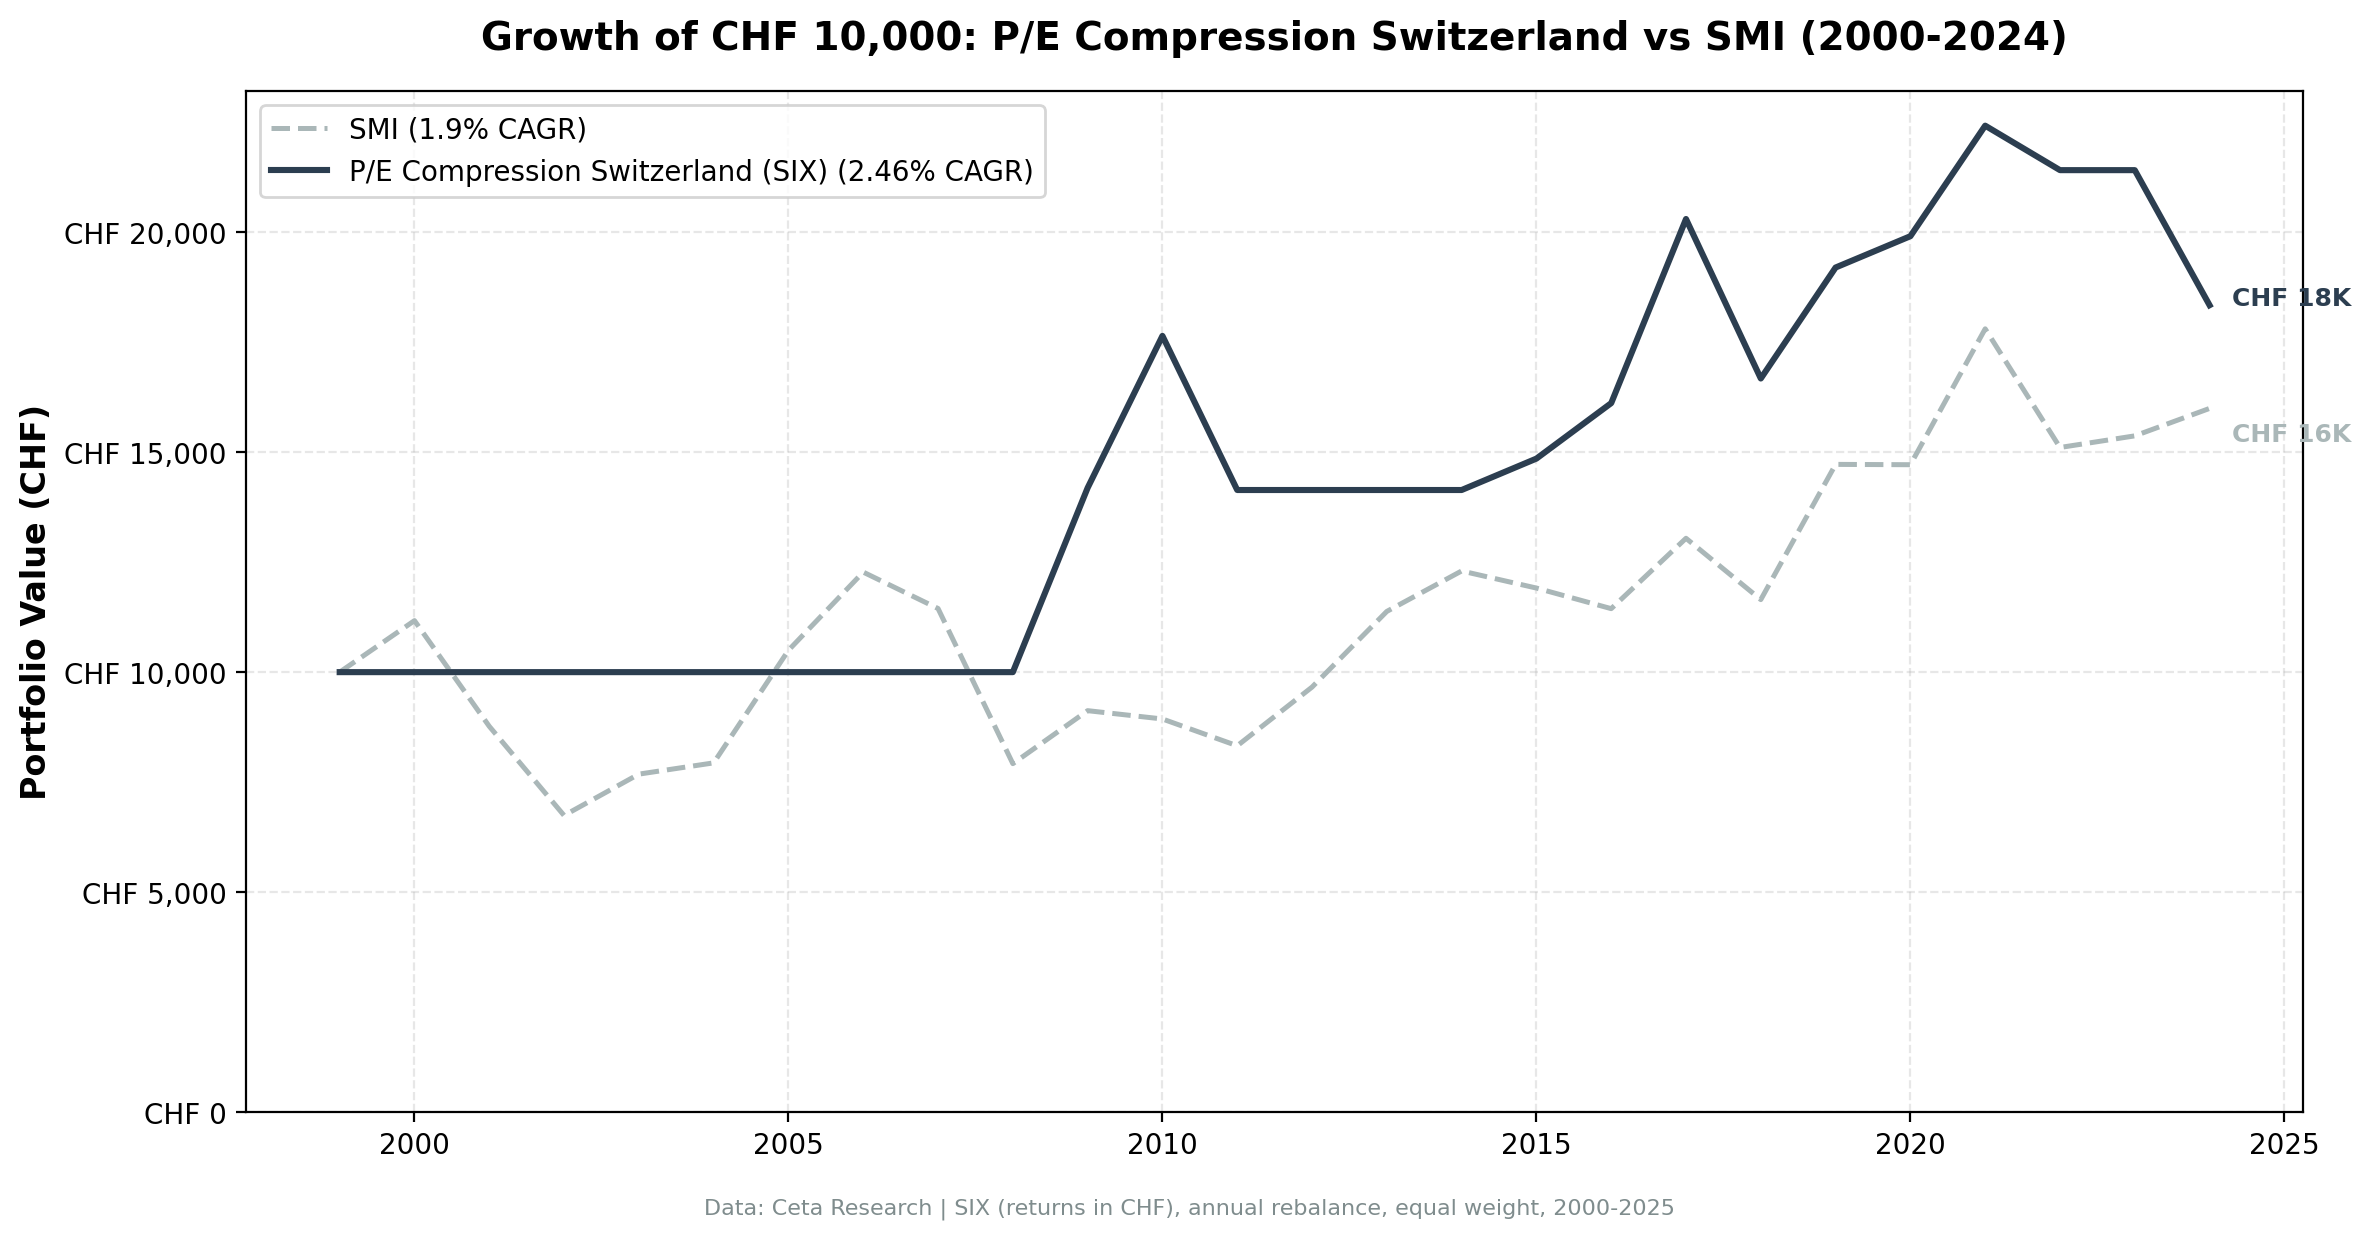
P/E compression on Swiss-listed stocks returns 2.46% annually vs 1.90% for the SMI. That's +0.56% excess, small enough to be noise. Two checks remove it entirely: the SMI is a price index yielding roughly 2.5% to 3%, and restricting the universe to Swiss-domiciled companies turns the excess into -1.62%. The remaining edge came from foreign companies with a secondary Zurich listing.
Contents
- What Changed From Our Earlier Version
- Method
- What We Found
- Year-by-year returns
- Why the Swiss Result Doesn't Hold Up
- Backtest Methodology
- Limitations
- Conclusion
Data: FMP financial data warehouse, 2000-2025. Updated August 2026.
What Changed From Our Earlier Version
An earlier version of this post reported 5.36% CAGR, +3.47% excess return and a 23.86% down-capture, and called Switzerland the clearest positive case in the series. That was wrong.
The backtest held cash when fewer than 10 stocks passed the screen, but never re-checked how many of those had a usable price at the rebalance date. FMP's Swiss price coverage is thin early: 97 of 659 SIX symbols had any end-of-day data in 2000, against 497 in 2021. So the screen found 30 names, a few could be priced, and the average of those few was reported as a portfolio. Once the 10-name minimum is enforced after pricing, Switzerland has no investable period at all before 2009.
The old 23.86% down-capture was the same artifact. The strategy wasn't absorbing less of the SMI's losses. It was in cash for every SMI drawdown before 2009, which is not downside protection, just absence.
Method
Universe: SIX, market cap > CHF 500M Period: 2000-2025 (25 years, 25 annual periods, 12 invested) Benchmark: SMI (^SSMI, CHF, price index) Execution: Next-day close (mark-on-close) Cash rule: Hold cash if fewer than 10 stocks qualify and can be priced
Returns in CHF. Benchmark in CHF.
What We Found
| Metric | Switzerland | SMI |
|---|---|---|
| CAGR | 2.46% | 1.90% |
| Total Return | 83% | 60% |
| Excess | +0.56% | - |
| Sharpe | 0.148 | - |
| Sortino | 0.309 | - |
| MaxDD | -19.86% | - |
| Avg Stocks | 18.1 | - |
| Cash | 13 of 25 (52%) | - |
| Years beating the SMI | 11 of 25 | - |
The strategy has no result for more than half the study. Thirteen years in cash, and the entire 2000-2008 stretch is one of them. What's left is 12 investable years, 2009 onward with three gaps, and across those the strategy clears the SMI by 0.56% a year.
That margin doesn't survive either of the two checks below.
The benchmark excludes dividends. Portfolio returns use dividend-adjusted prices, but ^SSMI is the SMI price index and does not reinvest dividends. The SMI has yielded roughly 2.5% to 3% a year over this period. A like-for-like total-return comparison turns +0.56% into a deficit of around 2%.
The universe isn't Swiss. Screens select every company listed on an exchange, and outside the US most of those listings are foreign companies' secondary lines. Re-running with the universe restricted to Swiss-domiciled companies gives 0.27% CAGR and -1.62% excess, with the same 12 investable periods. The invested-period count is unchanged, so this isn't a coverage effect. The names carrying the result simply aren't Swiss businesses.
Year-by-year returns
| Year | Portfolio | SMI | Excess |
|---|---|---|---|
| 2000 | cash | +11.7% | -11.7% |
| 2001 | cash | -21.5% | +21.5% |
| 2002 | cash | -23.1% | +23.1% |
| 2003 | cash | +13.9% | -13.9% |
| 2004 | cash | +3.3% | -3.3% |
| 2005 | cash | +32.2% | -32.2% |
| 2006 | cash | +16.9% | -16.9% |
| 2007 | cash | -6.7% | +6.7% |
| 2008 | cash | -30.8% | +30.8% |
| 2009 | +41.9% | +15.2% | +26.7% |
| 2010 | +24.4% | -2.1% | +26.4% |
| 2011 | -19.9% | -6.8% | -13.0% |
| 2012 | cash | +16.0% | -16.0% |
| 2013 | cash | +17.8% | -17.8% |
| 2014 | cash | +8.1% | -8.1% |
| 2015 | +5.0% | -3.2% | +8.2% |
| 2016 | +8.5% | -3.9% | +12.4% |
| 2017 | +26.0% | +14.0% | +12.0% |
| 2018 | -17.9% | -10.7% | -7.2% |
| 2019 | +15.1% | +26.4% | -11.3% |
| 2020 | +3.7% | -0.1% | +3.8% |
| 2021 | +12.6% | +21.0% | -8.4% |
| 2022 | -4.5% | -15.2% | +10.6% |
| 2023 | cash | +1.8% | -1.8% |
| 2024 | -14.3% | +4.1% | -18.4% |
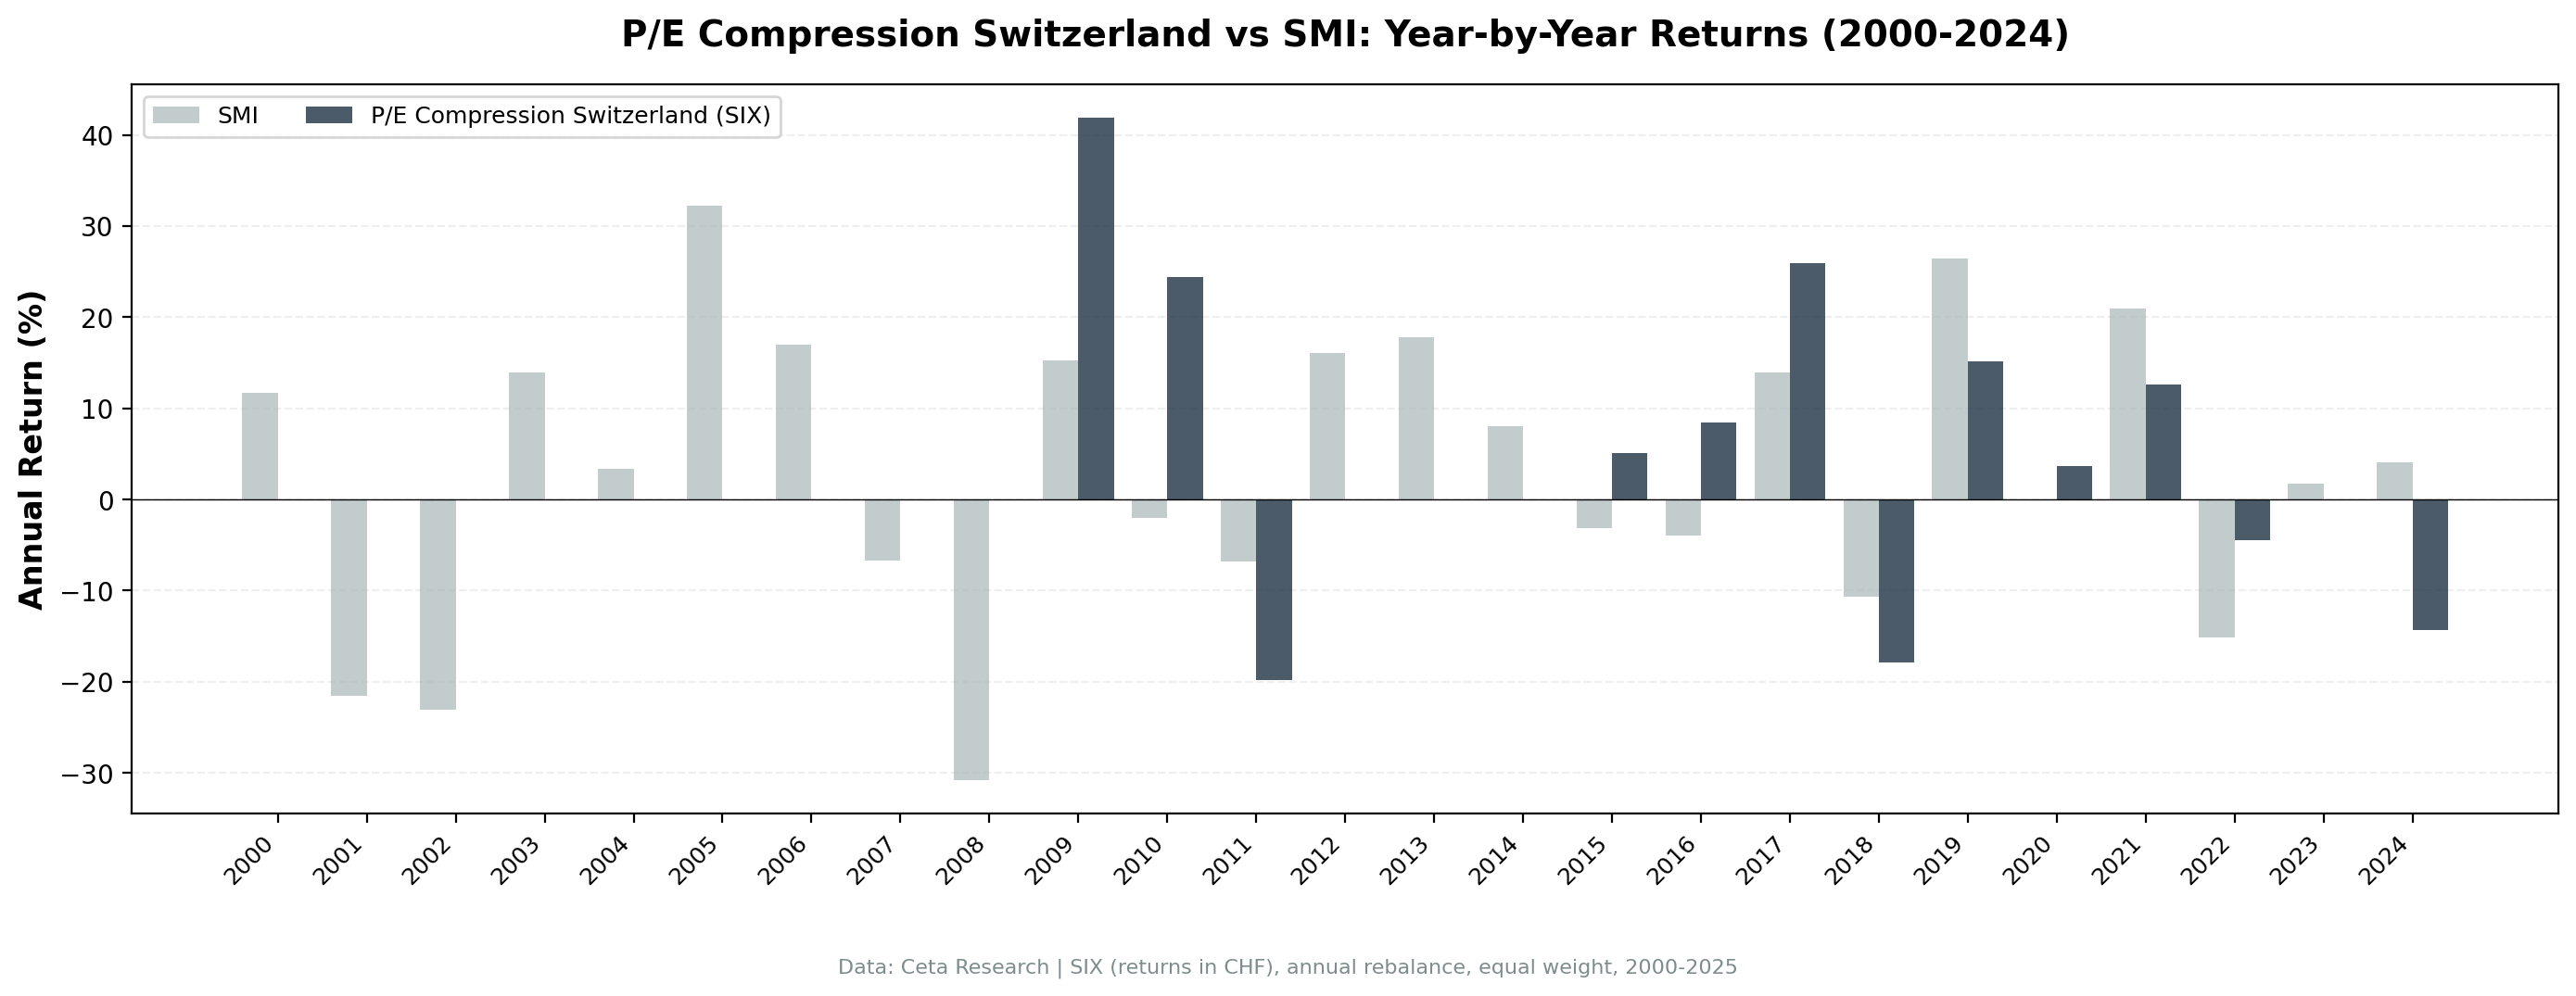
The +30.8% in 2008 and +23.1% in 2002 aren't strategy wins. They're cash years during SMI crashes. A backtest that can only be run in half the periods will show large positive excess in every bad benchmark year it happens to sit out, and large negative excess in every good one. Both 2005 (-32.2%) and 2008 (+30.8%) come from the same absence.
The invested years are more informative. 2009 and 2010 were genuinely strong (+26.7% and +26.4% excess), 2016 and 2017 were solid, and 2024 was the worst year in the record at -18.4%.
Why the Swiss Result Doesn't Hold Up
The SMI is concentrated, and that cuts both ways. The index is dominated by Nestlé, Novartis and Roche. A diversified portfolio of 18 mid-cap names will diverge from that concentration in either direction, and over 12 periods there aren't enough observations to tell skill from divergence.
Coverage decides the early record. No investable period before 2009 means the strategy never faced the dot-com bust or the financial crisis in Swiss equities. Whatever the screen would have done in those years is unknown, not favourable.
Domicile carries the remainder. The -1.62% Swiss-domiciled result is the clearest signal here. If the excess disappears when you require the company to actually be Swiss, then what was being measured was a set of foreign businesses that happen to list in Zurich, and those are available on their home exchanges too.
Backtest Methodology
| Parameter | Choice |
|---|---|
| Universe | SIX, Market Cap > CHF 500M |
| Signal | Current P/E < 85% of 5-year avg, P/E 5-40, ROE > 10%, D/E < 2.0 |
| Portfolio | Top 30 by lowest compression ratio, equal weight |
| Rebalancing | Annual (January) |
| Execution | Next-day close (mark-on-close) |
| Cash rule | Hold cash if fewer than 10 qualify and can be priced |
| Benchmark | SMI (^SSMI, CHF, price index) |
| Period | 2000-2025 (25 years, 12 invested) |
| Returns | CHF-denominated (portfolio and benchmark) |
| Transaction costs | 0.1% one-way (large cap tier) |
Limitations
Half the study has no result. 13 of 25 years in cash, including every year from 2000 to 2008. Excess return figures computed across a series with that many zero-exposure years describe the cash rule as much as the signal.
The benchmark excludes dividends. At a roughly 2.5% to 3% SMI yield, the dividend gap is several times the +0.56% headline excess.
Exchange-listed is not Swiss. The published number uses every company listed on SIX. On a Swiss-domiciled universe the excess is -1.62%.
Small sample when invested. 12 annual observations is too few to separate a real edge from noise, whatever the point estimate says.
Survivorship bias. Exchange membership uses current SIX profiles. Delistings aren't fully tracked.
Conclusion
Switzerland doesn't work. The +0.56% headline excess is smaller than the SMI's dividend yield, it rests on 12 investable years out of 25, and it inverts to -1.62% once the universe is restricted to Swiss-domiciled companies.
The earlier version of this analysis called Switzerland the clearest positive case in the series. It was the clearest example of a data-coverage artifact instead. The useful takeaway is the diagnostic rather than the market: when a backtest reports strong downside protection and also spends most of its history in cash, the two facts are usually the same fact.
Data: Ceta Research (FMP financial data warehouse). Returns in CHF. Benchmark: SMI price index, which does not reinvest dividends. Past performance does not guarantee future results. Not investment advice. See full methodology at github.com/ceta-research/backtests.

