
P/E Compression: 10.92% CAGR Over 25 Years of US Stock Data
We tested a P/E compression mean reversion screen on 25 years of US stock data. Buy when current P/E drops 15% below its 5-year average with quality filters. The strategy returned 10.92% annually vs 7.64% for SPY, with 3.27% excess return and 49% down-capture.

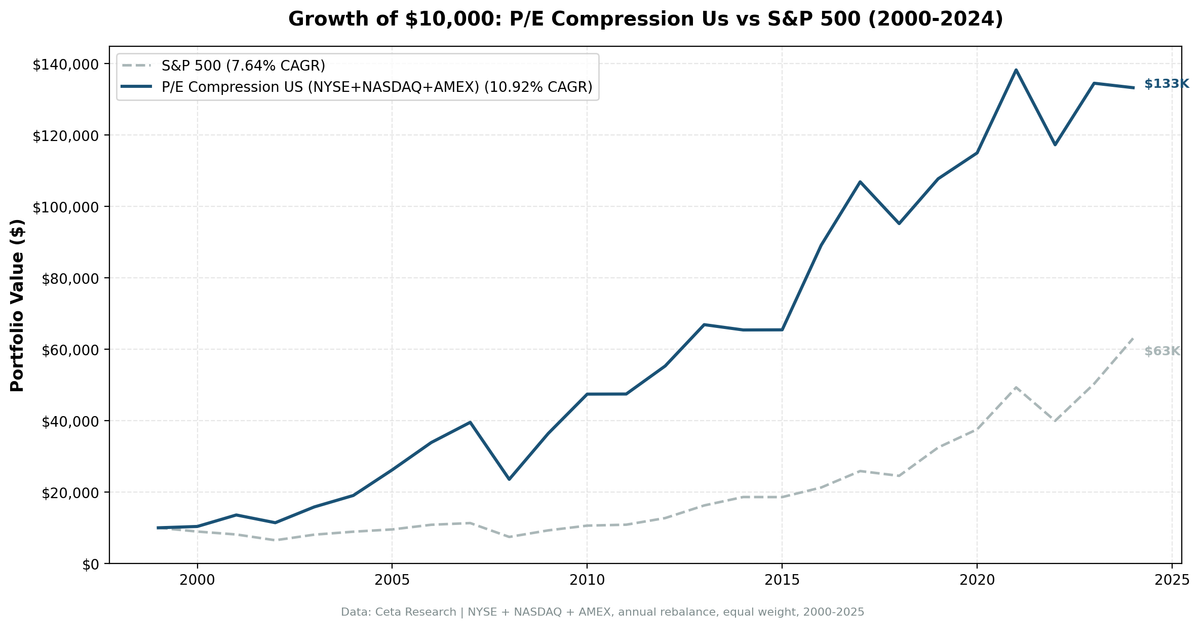
We tested a P/E compression mean reversion screen on 25 years of US stock data from NYSE, NASDAQ, and AMEX. The signal triggers when a stock's current P/E ratio drops 15% below its 5-year historical average, filtered for quality. The strategy returned 10.92% annually vs 7.64% for the S&P 500, with 3.27% excess return, 49% down-capture, and favorable asymmetric returns (114% up-capture).
Contents
- Method
- What Is P/E Compression?
- The Screen
- P/E Compression Screen (SQL)
- What We Found
- 25 years. 3.27% annual alpha. Strong downside protection.
- Year-by-year returns
- 2000-2007: compression worked perfectly
- Crisis comparison
- 2019, 2021, 2024: when growth dominates
- 2003-2007 and 2009-2010: value recoveries
- Backtest Methodology
- Limitations
- Conclusion
Data: FMP financial data warehouse, 2000-2025. Updated August 2026.
Method
Data source: Ceta Research (FMP financial data warehouse) Universe: NYSE + NASDAQ + AMEX, market cap > $1B USD Period: 2000-2025 (25 years, 25 annual periods) Rebalancing: Annual (January), equal weight, top 30 by compression ratio Benchmark: S&P 500 Total Return (SPY) Execution: Next-day close (mark-on-close) Cash rule: Hold cash if fewer than 10 stocks qualify and can be priced
Financial data sourced from financial_ratios (FY) for P/E ratios and debt-to-equity, key_metrics (FY) for ROE and market cap. 45-day lag on all financial statements to prevent look-ahead bias.
What Is P/E Compression?
P/E compression happens when a stock's current price-to-earnings ratio falls well below its own historical average. If a company historically trades at 20x earnings but currently trades at 15x, the P/E has compressed 25%. The bet is mean reversion: if fundamentals haven't deteriorated, the multiple should recover.
The key word is own historical average. We're not comparing P/E to the market or to sector peers. We're comparing each stock to itself over the prior 5 years. A stock that normally trades at 30x earnings dropping to 25x is compressed (17% drop). A stock that normally trades at 12x dropping to 11x is not (only 8% drop).
Signal: - Current P/E < 85% of 5-year average P/E (15%+ compression) - P/E range: 5-40 (exclude extreme valuations) - Minimum 3 years of P/E history required
Quality filters:
| Criterion | Metric | Threshold |
|---|---|---|
| Profitable | Return on Equity | > 10% |
| Manageable debt | Debt-to-Equity | < 2.0 |
Size:
| Criterion | Metric | Threshold |
|---|---|---|
| Institutional grade | Market Cap | > $1B USD |
Stocks must pass all filters. The top 30 by lowest compression ratio (current P/E / 5-year avg P/E) are selected each year, equal weighted.
The Screen
P/E Compression Screen (SQL)
WITH km AS (
  SELECT k.symbol, k.returnOnEquityTTM
  FROM key_metrics_ttm k
  QUALIFY ROW_NUMBER() OVER (PARTITION BY k.symbol ORDER BY k.fetchedAtEpoch DESC) = 1
),
pe_history AS (
  SELECT
    symbol,
    date,
    priceToEarningsRatio AS pe,
    debtToEquityRatio,
    AVG(priceToEarningsRatio) OVER (
      PARTITION BY symbol ORDER BY date
      ROWS BETWEEN 5 PRECEDING AND 1 PRECEDING
    ) AS pe_5yr_avg,
    COUNT(priceToEarningsRatio) OVER (
      PARTITION BY symbol ORDER BY date
      ROWS BETWEEN 5 PRECEDING AND 1 PRECEDING
    ) AS years_of_history
  FROM financial_ratios
  WHERE period = 'FY'
    AND priceToEarningsRatio IS NOT NULL
    AND priceToEarningsRatio > 0
    AND priceToEarningsRatio < 200
  QUALIFY ROW_NUMBER() OVER (PARTITION BY symbol ORDER BY date DESC) = 1
)
SELECT
    ph.symbol,
    p.companyName,
    p.sector,
    ROUND(ph.pe, 2) AS current_pe,
    ROUND(ph.pe_5yr_avg, 2) AS avg_pe_5yr,
    ROUND((ph.pe / ph.pe_5yr_avg) * 100, 1) AS pct_of_5yr_avg,
    ROUND(k.returnOnEquityTTM * 100, 1) AS roe_pct,
    ROUND(ph.debtToEquityRatio, 2) AS debt_to_equity,
    ROUND(p.marketCap / 1e9, 2) AS mktcap_bn
FROM pe_history ph
JOIN profile p ON ph.symbol = p.symbol
JOIN km k ON ph.symbol = k.symbol
WHERE ph.years_of_history >= 3
  AND ph.pe < (ph.pe_5yr_avg * 0.85)
  AND ph.pe > 5
  AND ph.pe < 40
  AND k.returnOnEquityTTM > 0.10
  AND ph.debtToEquityRatio >= 0
  AND ph.debtToEquityRatio < 2.0
  AND p.marketCap > 1000000000
  AND p.exchange IN ('NYSE', 'NASDAQ', 'AMEX')
  AND NOT p.isFund
  AND NOT p.isEtf
  AND p.isActivelyTrading
QUALIFY ROW_NUMBER() OVER (PARTITION BY COALESCE(p.cik, p.symbol)
                           ORDER BY p.averageVolume DESC) = 1
ORDER BY (ph.pe / ph.pe_5yr_avg) ASC
LIMIT 30
The priceToEarningsRatio < 200 cap on the history rows matters more than it looks. A single year where a company earned close to zero produces a four-figure P/E, which drags the 5-year average up and makes the current multiple look 99% compressed. Without the cap the top of the screen fills with that artifact instead of real mean reversion candidates.
Run this query on Ceta Research
What We Found
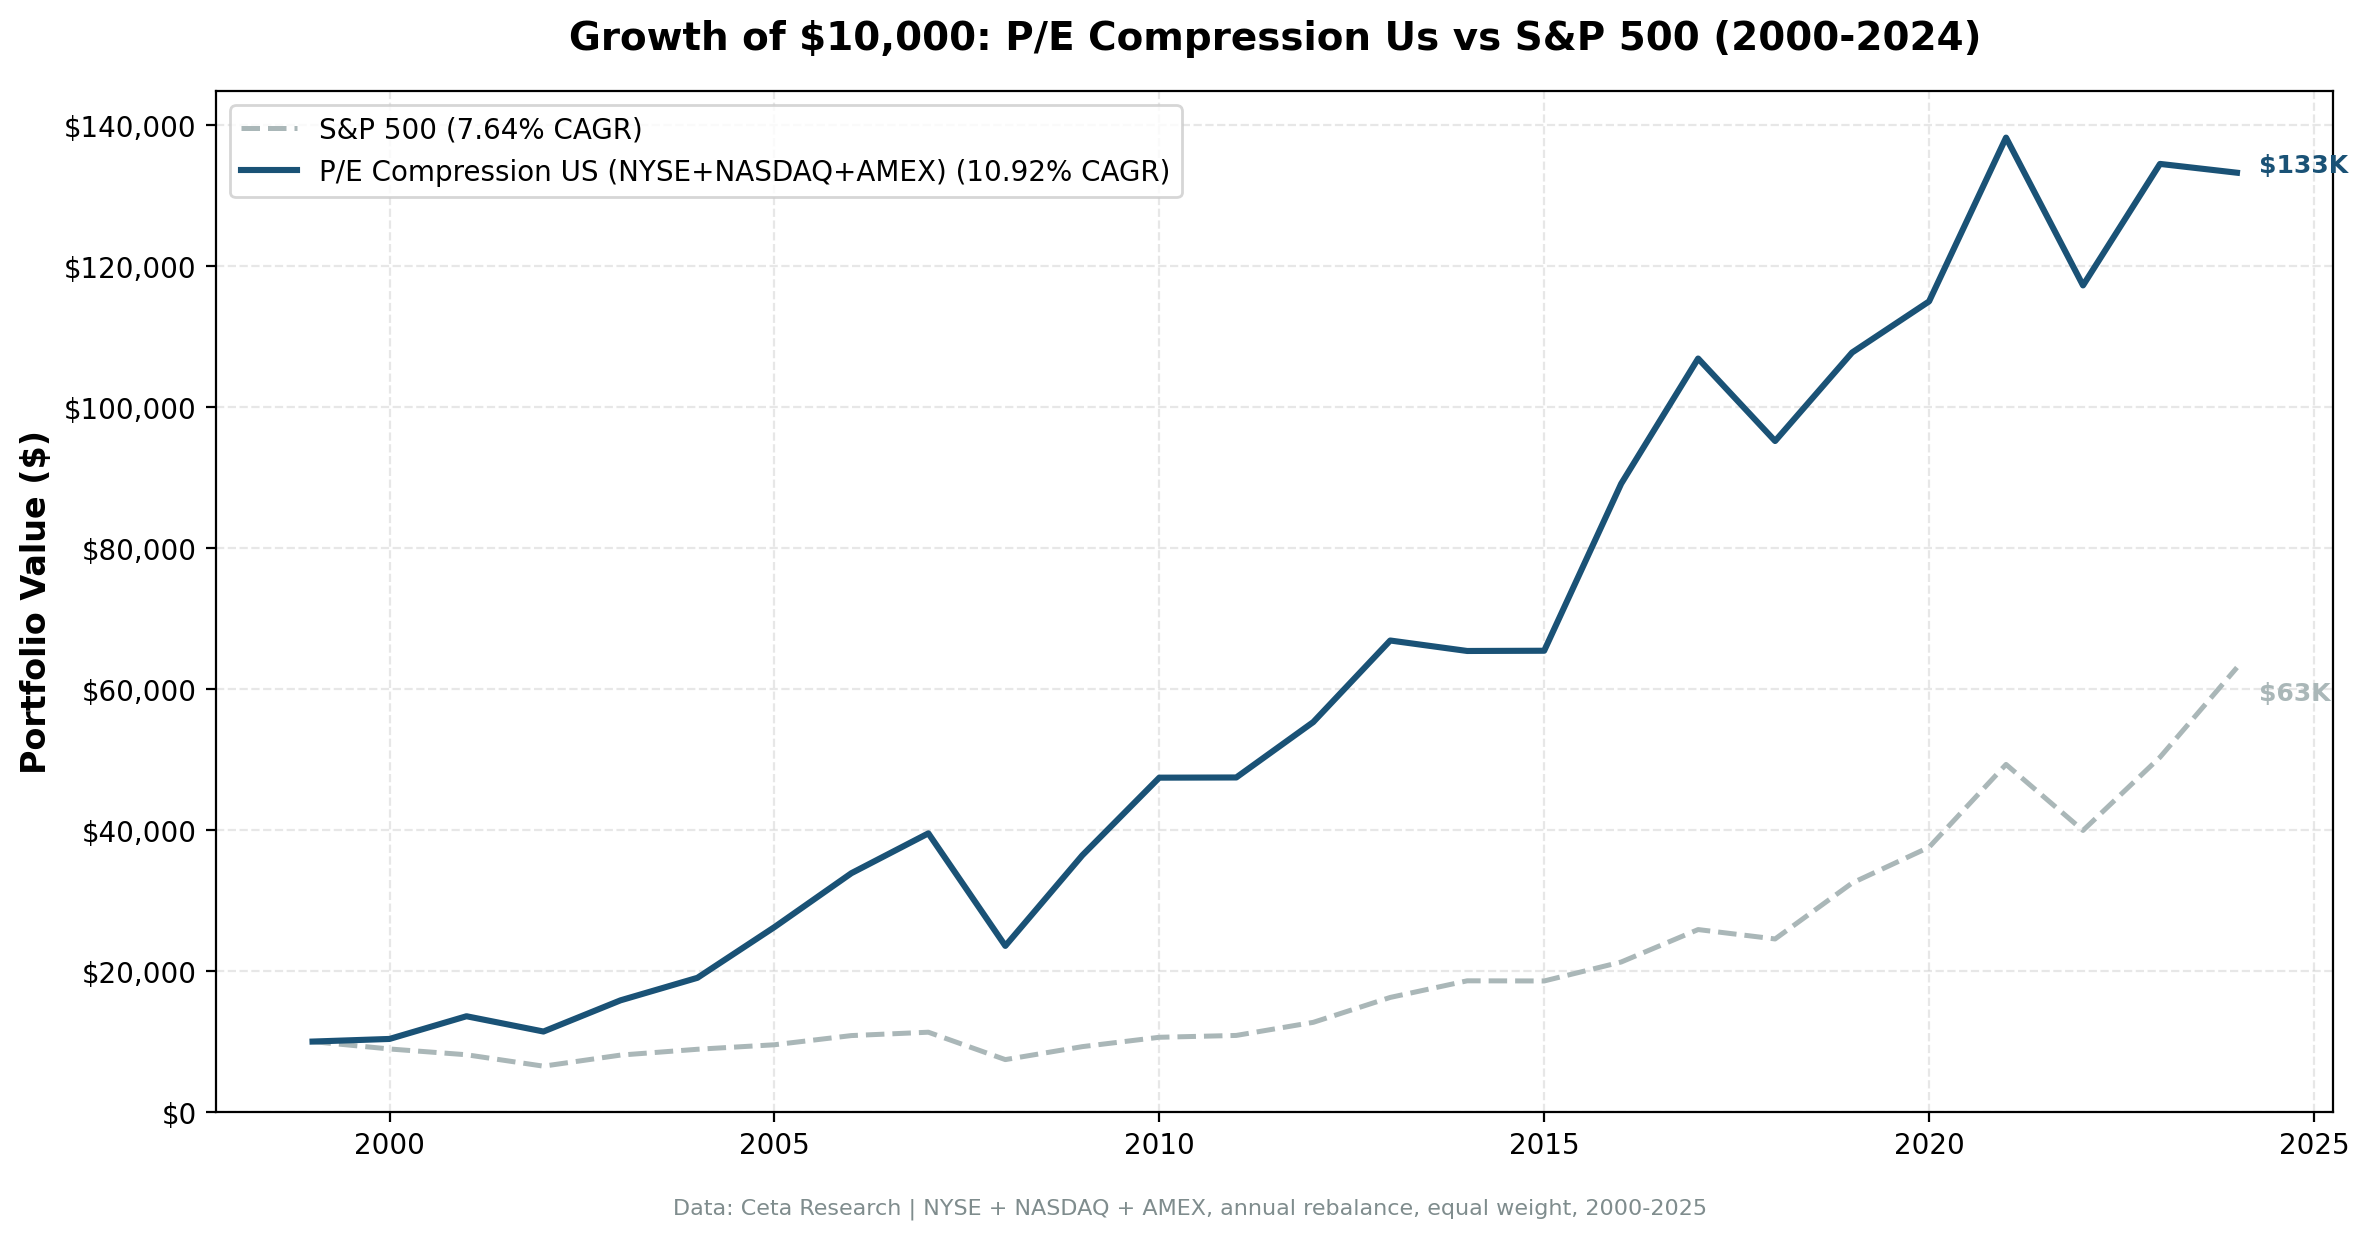
25 years. 3.27% annual alpha. Strong downside protection.
| Metric | P/E Compression (US) | S&P 500 |
|---|---|---|
| CAGR | 10.92% | 7.64% |
| Total Return | 1,233% | 531% |
| Sharpe Ratio | 0.424 | 0.322 |
| Sortino Ratio | 0.872 | 0.556 |
| Max Drawdown | -40.38% | -34.90% |
| Up Capture | 113.94% | 100% |
| Down Capture | 48.53% | 100% |
| Win Rate | 52% | - |
| Avg Stocks per Year | 24.3 | - |
| Cash Periods | 0 of 25 | - |
The raw return is strong: $10,000 grew to $133,300 vs $63,100 for the S&P 500. The Sharpe ratio improved from 0.322 to 0.424, and the Sortino ratio (which only penalizes downside volatility) jumped from 0.556 to 0.872. The max drawdown is worse at -40.38% vs -34.90%, but the 49% down-capture ratio shows the strategy captured less than half of SPY's losses on average.
The asymmetry is the story here: 114% up-capture means when SPY gains 10%, this portfolio gains 11.4%. But when SPY loses 10%, this portfolio only loses 4.9%. That's textbook mean reversion behavior.
Zero cash periods means the screen always found at least 10 qualifying stocks it could actually price. Even in elevated markets, some combination of sectors experiences temporary P/E compression. The US is the only large market in this study where that holds. Everywhere else, thin early price coverage forces the strategy into cash for years at a time.
Year-by-year returns
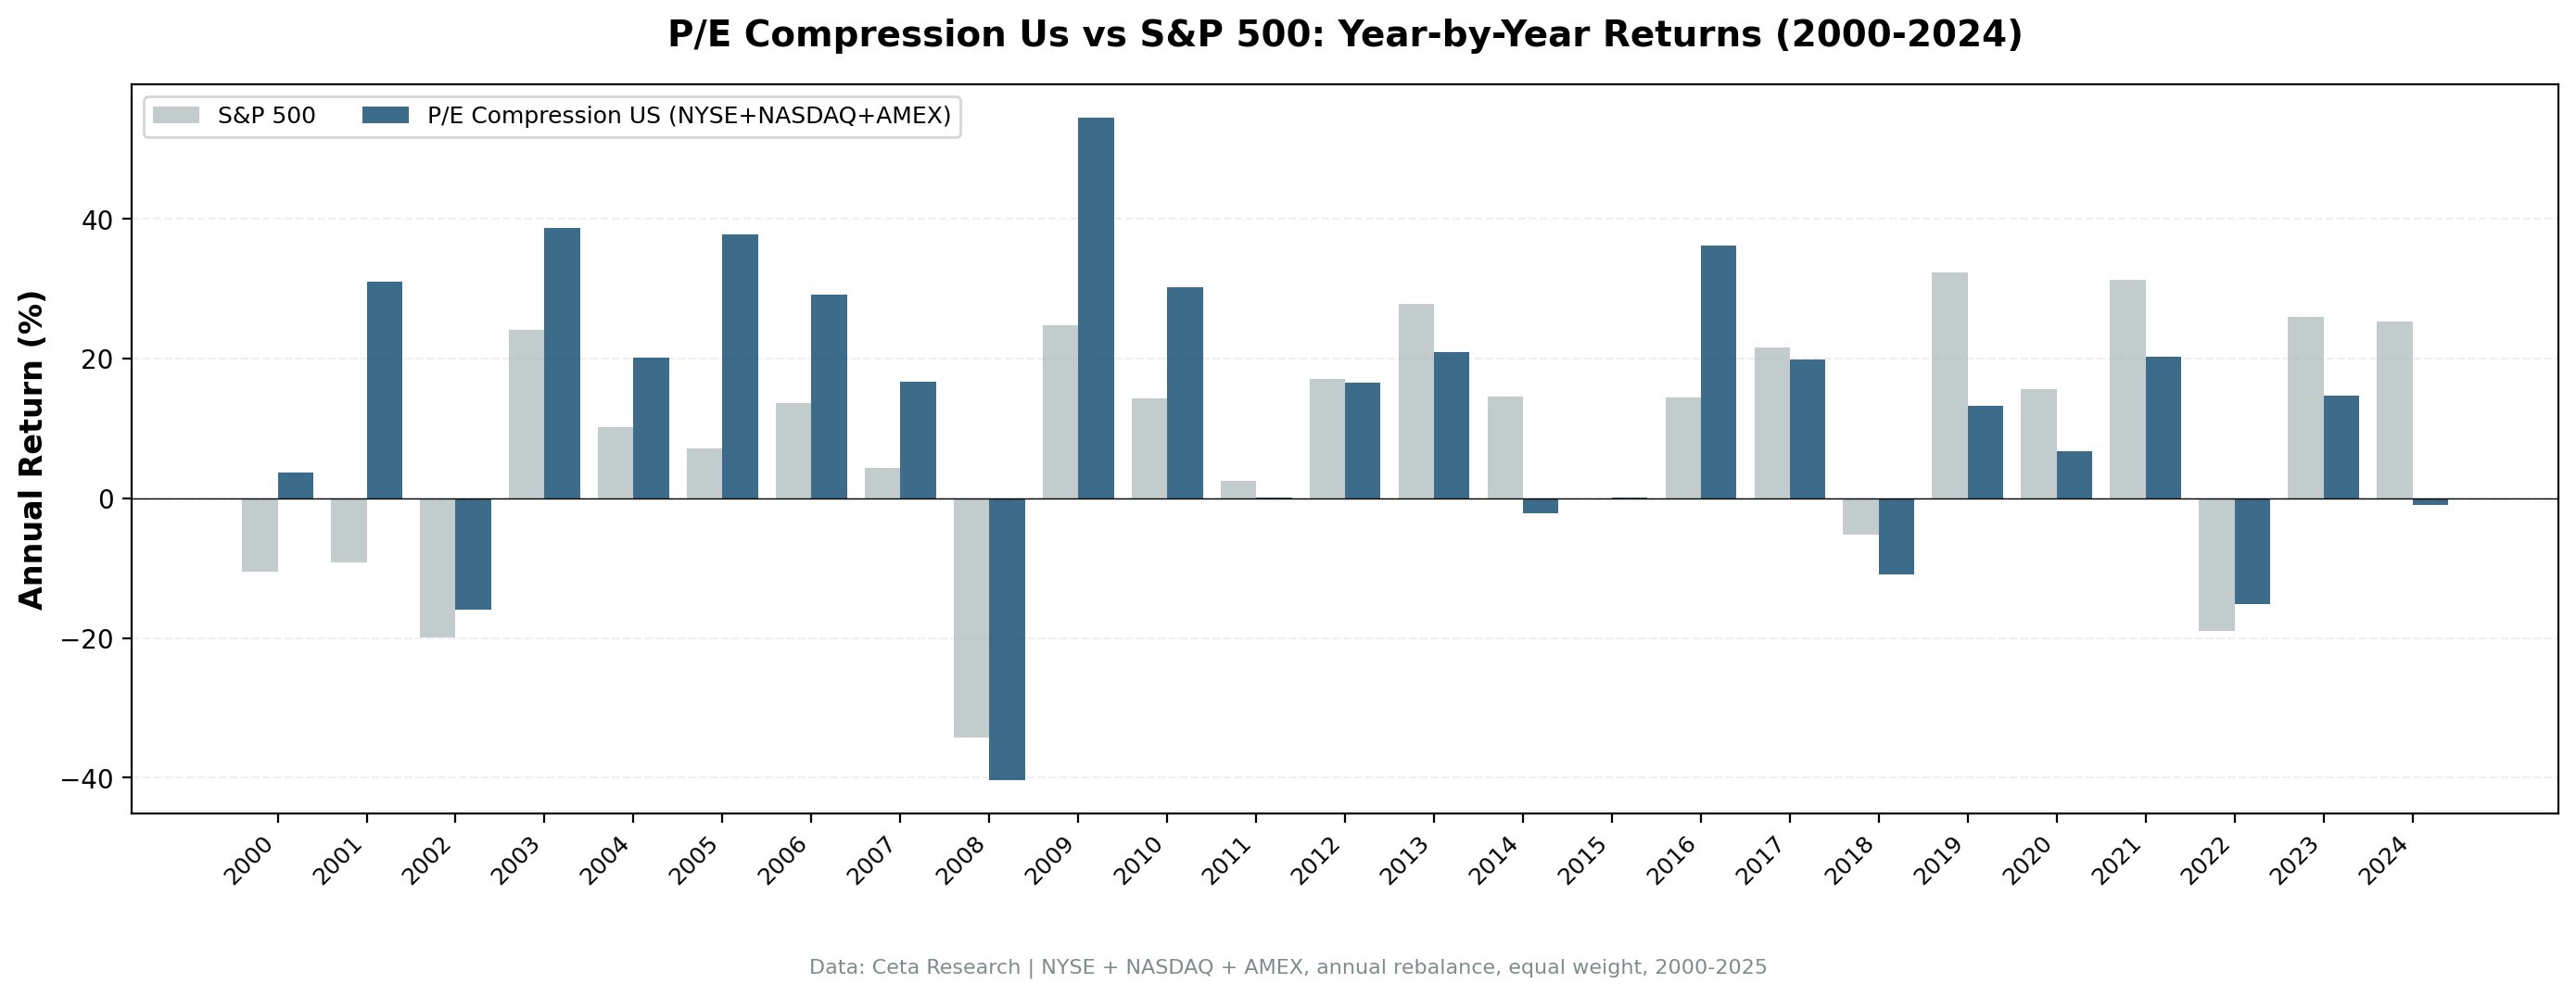
| Year | P/E Compression | S&P 500 | Excess |
|---|---|---|---|
| 2000 | +3.72% | -10.50% | +14.23% |
| 2001 | +31.05% | -9.17% | +40.22% |
| 2002 | -15.95% | -19.92% | +3.97% |
| 2003 | +38.70% | +24.12% | +14.58% |
| 2004 | +20.19% | +10.24% | +9.96% |
| 2005 | +37.75% | +7.17% | +30.58% |
| 2006 | +29.16% | +13.65% | +15.52% |
| 2007 | +16.69% | +4.40% | +12.28% |
| 2008 | -40.38% | -34.31% | -6.07% |
| 2009 | +54.50% | +24.73% | +29.77% |
| 2010 | +30.25% | +14.31% | +15.95% |
| 2011 | +0.06% | +2.46% | -2.40% |
| 2012 | +16.55% | +17.09% | -0.54% |
| 2013 | +20.92% | +27.77% | -6.85% |
| 2014 | -2.22% | +14.50% | -16.71% |
| 2015 | +0.05% | -0.12% | +0.17% |
| 2016 | +36.20% | +14.45% | +21.74% |
| 2017 | +19.93% | +21.64% | -1.71% |
| 2018 | -10.95% | -5.15% | -5.80% |
| 2019 | +13.19% | +32.31% | -19.12% |
| 2020 | +6.73% | +15.64% | -8.90% |
| 2021 | +20.21% | +31.26% | -11.05% |
| 2022 | -15.17% | -18.99% | +3.82% |
| 2023 | +14.70% | +26.00% | -11.30% |
| 2024 | -0.93% | +25.28% | -26.21% |
2000-2007: compression worked perfectly
The strategy's strongest performance came during the value-dominated years from 2000 to 2007. During the dot-com bust (2000-2002), P/E compression stocks held up better because they were already trading at depressed multiples. They didn't have far to fall. Then during the recovery (2003-2007), they captured the full upside as earnings growth drove P/E expansion back to historical norms.
The cumulative outperformance from 2000 to 2007 was large. These eight years alone generated most of the strategy's long-term alpha.
Crisis comparison
| Event | P/E Compression | S&P 500 | Gap |
|---|---|---|---|
| Dot-com bust (2000-2002) | +14.2% | -34.9% | +49.1% |
| Financial crisis (2008) | -40.38% | -34.31% | -6.07% |
| COVID (2020) | +6.73% | +15.64% | -8.90% |
| 2022 bear market | -15.17% | -18.99% | +3.82% |
2008 was the strategy's worst year at -40.38%. P/E compression didn't protect against systemic deleveraging. When everything sells off regardless of valuation, compressed multiples don't matter.
But even in 2008, the down-capture story plays out over the full 25 years: the strategy captured 49% of SPY's downside on average, not in every single year. 2022 is the counter-example that shows it working, with the portfolio down 15.2% against the index's 19.0%.
2019, 2021, 2024: when growth dominates
Three years stand out for severe underperformance: 2019 (-19.12% excess), 2021 (-11.05% excess), and 2024 (-26.21% excess). These were years when the market strongly favored high-multiple growth stocks and momentum.
P/E compression strategies are structurally short growth and long value. In years when software, cloud, and platform companies with 30x-50x P/E ratios drive the market, this screen misses the action entirely. Those stocks don't compress because they never had mid-range multiples to begin with.
The quality filters help limit damage (ROE > 10%, D/E < 2), but they don't prevent underperformance in growth-driven regimes. That's the trade-off.
2003-2007 and 2009-2010: value recoveries
| Period | P/E Compression | S&P 500 | Excess |
|---|---|---|---|
| 2003-2007 (5 years) | +246% | +74% | +172% |
| 2009-2010 (2 years) | +101% | +43% | +58% |
These two recovery periods generated most of the strategy's long-term outperformance. After valuation resets (2000-2002 dot-com bust, 2008 financial crisis), compressed P/E stocks bounced back hard as earnings stabilized and multiples mean-reverted.
The pattern is consistent: P/E compression works best in the recovery phase after a value-destroying event, not during the event itself.
Backtest Methodology
Full methodology documentation: backtests/METHODOLOGY.md
| Parameter | Choice |
|---|---|
| Universe | NYSE + NASDAQ + AMEX, Market Cap > $1B USD |
| Signal | Current P/E < 85% of 5-year avg, P/E 5-40, ROE > 10%, D/E < 2.0 |
| Portfolio | Top 30 by lowest compression ratio, equal weight |
| Rebalancing | Annual (January) |
| Execution | Next-day close (mark-on-close) |
| Cash rule | Hold cash if fewer than 10 qualify and can be priced |
| Benchmark | S&P 500 Total Return (SPY) |
| Period | 2000-2025 (25 years) |
| Data | Point-in-time (45-day lag on FY financial statements) |
| Transaction costs | 0.1% one-way (size-tiered by market cap) |
Limitations
Worse max drawdown. The -40.38% max drawdown exceeds SPY's -34.90%. Despite the favorable down-capture ratio over 25 years, single-year losses can be severe. The 2008 financial crisis hit this portfolio harder than the index.
Underperforms in growth markets. Any year dominated by high-multiple growth stocks will see significant underperformance. 2019, 2021, and 2024 are examples. This strategy is structurally positioned for value regimes.
5-year lookback is arbitrary. The choice of 5 years for historical P/E average is a parameter. Shorter windows (3 years) make the screen more sensitive to recent volatility. Longer windows (7-10 years) smooth the average but may miss regime changes. We didn't optimize this.
Sector concentration risk. Without a sector cap, the screen can cluster in one industry. Some years skew heavily toward financials or healthcare. Single-sector risk is real but not quantified here.
The US result doesn't generalize. This same screen was run on 21 exchanges. The US is one of only seven markets with positive excess return against a local benchmark, and one of only four invested in at least 22 of the 25 periods. Outside the US, FMP's price history is much thinner than its fundamentals history, which forces the strategy into cash for years at a time. See the global comparison for the full picture.
Survivorship bias. Exchange membership uses current profiles, not historical. IPOs, delistings, and bankruptcies aren't fully tracked over time, which is a standard limitation of this backtest approach.
Conclusion
P/E compression as a mean reversion signal worked well over 25 years of US data, delivering 3.27% annual alpha with favorable asymmetry (114% up-capture, 49% down-capture). The strategy thrived during value recoveries (2003-2007, 2009-2010) and struggled during growth-dominated years (2019, 2021, 2024).
The key insight: P/E compression works when fundamentals are stable but sentiment has soured. It doesn't work when compression is justified by deteriorating earnings or during broad deleveraging events like 2008.
For investors willing to accept occasional severe underperformance in growth regimes, the long-term risk-adjusted returns (Sortino 0.872 vs 0.556) make a case for P/E compression as a complementary strategy alongside market exposure.
Data: Ceta Research (FMP financial data warehouse). Benchmark: S&P 500 total return (SPY), which reinvests dividends, so this comparison is like-for-like. Past performance does not guarantee future results. Not investment advice. See full methodology at github.com/ceta-research/backtests.

