
Post-Earnings Drift Across 14 Markets: A Global Event Study
PEAD event study on 14 exchanges, 2000-2025, with MOC entry and local benchmarks. Taiwan leads on quintile spread at +4.55pp, India at +4.28pp. US beats don't drift post-entry. Updated 2026-08-29: UK and Germany rows withdrawn on domicile grounds.

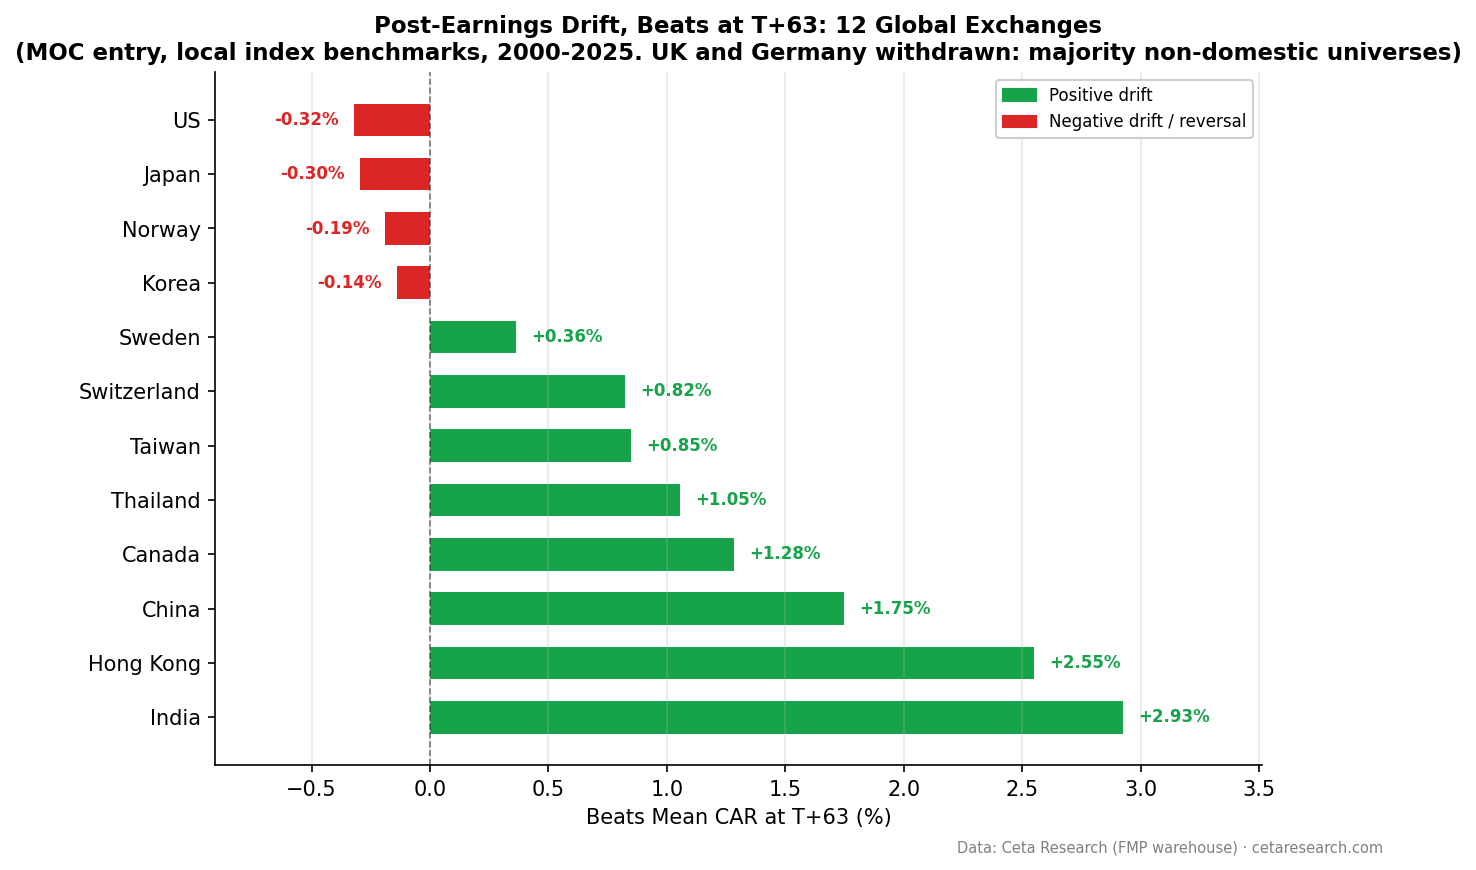
Post-Earnings Announcement Drift is a global phenomenon. We ran the same event study on 14 exchanges from 2000 to 2025 with next-day close entry (MOC execution) and local currency benchmarks. Every market we report except Norway shows a positive Q5-Q1 quintile spread. The effect is nearly universal.
Contents
- Method
- Global Results
- What the Data Shows
- What the Direction Test Changes
- The Asia-Pacific vs Major Developed Split
- Taiwan: Widest Quintile Spread, Miss-Dominated Signal
- How We Handled Exchange Selection
- Screen for Global Earnings Surprises
- Limitations
- Takeaway
- References
The story splits roughly along market depth lines. India, Canada, Thailand and Taiwan show meaningful post-entry beat drift. Major developed markets (US, Japan, Korea) show negligible or negative beat drift after entry. Hong Kong and China print the biggest beat numbers in the study, but misses drift up in those markets too, so the quintile spread is the only part of them we read as an earnings effect. The announcement-day reaction, which you can't trade on, accounts for most of the "drift" in traditional PEAD studies.
Data: FMP financial data warehouse, 2000–2025. Backtest run 2026-05-05. Corrected 2026-08-29.
Correction, 2026-08-29. Two rows are withdrawn from this comparison and several claims are reframed. A domicile count on the earnings-covered universes found that the UK (LSE) and Germany (XETRA) rows measured majority foreign-domiciled companies against the FTSE 100 and the DAX, so those two rows are pulled. A direction test found four markets where beats and misses drifted the same way at T+63 with both legs statistically significant, which means the per-leg level there is measuring the universe against its index rather than the earnings surprise. No backtest number has been changed. What changed is which numbers we claim as an earnings effect. Details in "What the Direction Test Changes" and "How We Handled Exchange Selection" below.
Method
Same event study design applied to each exchange independently:
- Signal:
(epsActual - epsEstimated) / |epsEstimated| - Universe: Exchange-specific market cap filters (historical FY key_metrics)
- Period: Exchange-dependent start date, all through 2025
- Execution: Next-day close (MOC). Entry at the close of the first trading day after the announcement.
- Benchmark: Local index per exchange (Sensex for India, Nikkei for Japan, TAIEX for Taiwan, SPY for US, etc.)
- Windows: T+1, T+5, T+21, T+63 trading days from entry
- Surprise cap: |surprise| <= 200%
- Single-period return cap: |return| <= 200% (filters price data artifacts)
- Min entry price: $1 (skips penny stock adjClose errors)
- Price data cleanup: Removes oscillation artifacts (phantom holiday rows, broken split adjustments) before any price lookups.
- Winsorization: 1st/99th percentile
- Excluded: ASX, SAO, SGX excluded for known fatal adjClose data quality issues.
Global Results
The 12 exchanges we still report, with next-day close entry and local currency benchmarks. Sorted by beats CAR at T+63. UK (LSE) and Germany (XETRA) ran in the same study and appeared here until 2026-08-29; both rows are now withdrawn on domicile grounds, explained under "How We Handled Exchange Selection".
| Exchange | Events | Benchmark | Beats T+63 | Misses T+63 | Q5-Q1 |
|---|---|---|---|---|---|
| India (NSE) | 7,791 | Sensex | +2.93% | -0.05% | +4.28% |
| Hong Kong (HKSE) † | 4,421 | Hang Seng | +2.55% | +0.93% | +2.73% |
| China (SHZ+SHH) † | 20,059 | SSE Composite | +1.75% | +0.70% | +2.14% |
| Canada (TSX+TSXV) | 18,363 | TSX Composite | +1.28% | -0.08% | +2.06% |
| Thailand (SET) | 3,919 | SET Index | +1.05% | -0.87% | +2.09% |
| Taiwan (TAI+TWO) | 16,406 | TAIEX | +0.85% | -1.68% | +4.55% |
| Switzerland (SIX) § | 1,766 | SMI | +0.82% | -0.24% | +1.99% |
| Sweden (STO) | 4,885 | OMXS30 | +0.36% | -0.27% | +0.78% |
| Korea (KSC) ‡ | 6,347 | KOSPI | -0.14% | -0.91% | +1.33% |
| Norway (OSL) | 1,613 | OSEAX | -0.19% | -0.41% | -1.36% |
| Japan (JPX) † | 16,273 | Nikkei 225 | -0.30% | -0.83% | +1.07% |
| US (NYSE+NASDAQ+AMEX) † | 157,269 | SPY | -0.32% | -0.91% | +1.34% |
† Beats and misses drifted the same way at T+63 and both legs are statistically significant. For these four markets, read the Q5-Q1 column and not the per-leg level. See "What the Direction Test Changes".
‡ Korea: both legs are negative, but only the miss leg is significant (beats t=-0.44). The same caution applies.
§ Switzerland: 49.0% of the earnings-covered non-fund symbols listed on SIX are Swiss-domiciled and 15.8% are US-domiciled (counted 2026-08-29). This row describes a listing venue, not a Swiss-market effect.
What the Data Shows
Five findings stand out.
1. Every market we report except Norway has a positive Q5-Q1 spread. Norway (OSL, 1,613 events) has too thin a dataset for reliable conclusions. The relative signal (sorting by surprise magnitude and taking the extremes) works almost everywhere, even in markets where beats don't drift positively in absolute terms. The quintile spread is also the number that survives the direction test, because it compares two groups inside the same market and the benchmark cancels out of the comparison.
2. Post-entry beat drift is attributable to the surprise in India, Canada, Thailand and Taiwan. India (+2.93%), Canada (+1.28%), Thailand (+1.05%), Taiwan (+0.85%). In each of these the miss leg moves the other way, which is what a real earnings signal looks like. Switzerland (+0.82%) points the same way but carries the domicile caveat above. Hong Kong (+2.55%) and China (+1.75%) print larger beat numbers, and those levels are not attributable to the surprise: misses drift up in both markets too, so the beat number is tracking the whole earnings-covered universe against the index. Major developed markets (US -0.32%, Japan -0.30%, Korea -0.14%) show no positive beat drift post-entry.
3. Taiwan has the widest quintile spread. Q5-Q1 = +4.55pp vs TAIEX, edging out India (+4.28pp). The pattern in Taiwan is dominated by miss-side underperformance (Q1 = -3.13% at T+63) more than beat-side outperformance. Semiconductor concentration likely amplifies the disappointment reaction.
4. Miss-side underperformance carries the developed markets, but read it as a ranking. Taiwan is the clean case: misses run -1.68% vs the TAIEX while beats run +0.85%, so the two legs separate and each number means something on its own. In the US, Japan and Korea both legs are negative, so the miss level there can't be separated from whatever the earnings-covered universe did against its index. What holds in those markets is that misses trail beats and the Q5-Q1 spread stays positive. China and Hong Kong are the mirror image: both legs drift up (+0.70% and +0.93% at T+63) and the spread still holds.
5. The UK and Germany rows are withdrawn. A count of earnings-covered non-fund symbols run on 2026-08-29 found 31.7% of LSE names are UK-domiciled against 36.8% US-domiciled, and 39.3% of XETRA names are German-domiciled against 36.4% US-domiciled. Both universes are majority foreign and were measured against the FTSE 100 and the DAX, so neither row describes the market its label named. We are not restating those numbers here.
What the Direction Test Changes
An earnings signal has a direction. If beating estimates pushes a stock up relative to its market, missing estimates should push it down. So we re-tested every market by asking a single question: does the miss leg move opposite to the beat leg?
In four markets it doesn't, and both legs are significant:
| Market | Beats T+63 | Misses T+63 | Both legs |
|---|---|---|---|
| Hong Kong (HKSE) | +2.55% (t=6.00) | +0.93% (t=2.50) | up |
| China (SHZ+SHH) | +1.75% (t=8.04) | +0.70% (t=4.42) | up |
| Japan (JPX) | -0.30% (t=-2.16) | -0.83% (t=-5.21) | down |
| US (NYSE+NASDAQ+AMEX) | -0.32% (t=-6.43) | -0.91% (t=-12.53) | down |
When both legs move the same way and both are significant, the level is common to the whole earnings-covered universe. It is measuring that universe against the index, not measuring the surprise. Two mechanisms produce this. Analyst coverage is a selection filter, so the covered subset can outrun a broad index whatever it reported (the China post works through this at length). And every non-US benchmark in the table above is a price index while the stock legs are dividend-adjusted, which biases both legs upward.
What survives is the difference between the legs, because the common component cancels. In the US that gap is +0.59pp at T+63. In every one of the four markets the Q5-Q1 quintile spread stays positive, and that spread is the same idea measured across the full surprise distribution instead of two buckets. Korea sits at the edge of this group: both legs are negative but the beat leg isn't significant (t=-0.44), so its -0.14% carries no interpretation either.
We have no significance test on the beat-minus-miss difference itself. That would take a rerun, so treat the gaps as descriptive.
The Asia-Pacific vs Major Developed Split
The pattern is clearer when you group by market depth and analyst coverage and read the quintile spread rather than the per-leg level:
Asia-Pacific and emerging (India, Hong Kong, China, Taiwan, Thailand): Q5-Q1 runs from +2.09pp (Thailand) to +4.55pp (Taiwan)
Smaller developed (Canada, Switzerland, Sweden): Q5-Q1 +2.06pp, +1.99pp, +0.78pp
Major developed (US, Japan, Korea): Q5-Q1 +1.34pp, +1.07pp, +1.33pp
The contrast between Asia-Pacific and the most analyst-saturated developed markets is the cleanest split. Major developed market beats are flat or negative post-entry, while India, Canada, Thailand and Taiwan show positive beat drift with the miss leg moving the other way. This fits what the academic literature predicts. Bernard and Thomas (1989, 1990) documented that PEAD is stronger for low-coverage stocks. Markets with less analyst coverage per listed company show larger drift because the announcement-day reaction doesn't fully capture the information.
Taiwan: Widest Quintile Spread, Miss-Dominated Signal
Taiwan (TAI+TWO) is the standout. The Q5-Q1 spread is +4.55%, the widest in the global study, ahead of India's +4.28%. Beats at T+63 are +0.85% vs TAIEX and misses are -1.68%. The drift pattern is dominated by the miss side. Q1 at T+63 shows -3.13%, the largest miss-quintile penalty in the global study.
This makes PEAD in Taiwan primarily a "miss avoidance" signal rather than a "beat chasing" signal. Taiwan's semiconductor and electronics concentration likely amplifies the earnings disappointment reaction, as supply chain signals are tracked closely by institutional investors and bad numbers cascade through the sector.
How We Handled Exchange Selection
Three exchanges were excluded for known fatal data quality issues: - Australia (ASX): adjClose oscillation errors affecting hundreds of stocks - Brazil (SAO): same root cause as ASX - Singapore (SGX): empty profile table in the FMP warehouse
The remaining 14 exchanges ran cleanly through the same methodology with new data quality guards (oscillation cleanup, $1 min entry price, 200% single-period return cap). Two exchanges are borderline on data volume (Norway: 1,613 events; Switzerland: 1,766). Both showed interpretable patterns and are included with the caveat that confidence intervals are wider. Norway's Q5-Q1 spread of -1.36pp is the one outlier from the otherwise universal positive-spread finding, but given the thin sample, it's not a reliable signal.
Withdrawn 2026-08-29: UK (LSE) and Germany (XETRA). The universe for each exchange is selected on the listing venue recorded in the profile table, with no filter on where the company is domiciled. For most exchanges that distinction doesn't matter. For the two large European venues it does. A count of earnings-covered non-fund symbols run on 2026-08-29 returned 1,796 LSE symbols of which 31.7% are UK-domiciled and 36.8% US-domiciled, and 649 XETRA symbols of which 39.3% are German-domiciled and 36.4% US-domiciled. Most of the LSE block is cross-listed international order book lines, many of them quoted in USD, benchmarked against a GBP index. Both rows measure a majority-foreign set of companies against a national index, so we have pulled them rather than caveat them. Correcting this needs a rerun with a domicile or trading-currency filter, which we have not run.
The same count returned 304 SIX symbols, 49.0% Swiss-domiciled and 15.8% US-domiciled. Switzerland stays in the table with the marker above because it sits on the right side of both numbers that pulled Germany: 15.8% US-domiciled against XETRA's 36.4%, and 49.0% home-domiciled against XETRA's 39.3%. The row should still be read as a listing-venue result.
Screen for Global Earnings Surprises
SELECT e.symbol,
    p.exchange,
    p.country,
    CAST(e.date AS DATE) AS event_date,
    e.epsActual AS actual_eps,
    e.epsEstimated AS est_eps,
    ROUND((e.epsActual - e.epsEstimated)
        / ABS(NULLIF(e.epsEstimated, 0)) * 100, 1) AS surprise_pct
FROM earnings_surprises e
JOIN profile p ON e.symbol = p.symbol
WHERE CAST(e.date AS DATE) >= CURRENT_DATE - INTERVAL '30' DAY
  AND e.epsEstimated IS NOT NULL
  AND ABS(e.epsEstimated) > 0.01
  AND e.epsActual > e.epsEstimated
  AND p.exchange IN ('NSE', 'HKSE', 'SHZ', 'SHH', 'TSX', 'TSXV', 'TAI', 'TWO')
ORDER BY surprise_pct DESC
LIMIT 50
Limitations
MOC execution. Entering at next-day close removes the announcement-day reaction. This is realistic (you can't trade before seeing the announcement) but produces smaller numbers than traditional event studies that include the initial price jump.
Different start dates. India and Canada data starts from 2000. China data has thinner coverage before 2014. Shorter history for some exchanges means the results are less stable across market cycles.
Local index benchmarks. Sensex for India, Nikkei for Japan, OMXS30 for Sweden, SMI for Switzerland, SET for Thailand, OSEAX for Norway, KOSPI for Korea, TAIEX for Taiwan, SSE Composite for China, Hang Seng for Hong Kong, TSX Composite for Canada, SPY for the US. These indices capture local market movement better than the US-listed ETFs the earlier version of this study used.
Price indices vs dividend-adjusted stocks. Every non-US benchmark here is a price index, while the stock returns use dividend-adjusted closes. That mismatch adds a positive bias to both the beat leg and the miss leg in those markets, and it is one reason both legs can end up positive. The Q5-Q1 spread is unaffected, because the bias is common to all quintiles.
Direction test. Hong Kong, China, Japan and the US fail it at T+63, and Korea is marginal. Their per-leg levels are not attributable to the earnings surprise. See the section above.
Domicile. Exchange membership is taken from the listing venue with no domicile or trading-currency filter. That is what forced the UK and Germany withdrawals. The other exchanges in the table were not re-counted event by event under the current filters, so the same effect at smaller scale can't be ruled out anywhere.
Event study vs portfolio backtest. These aren't portfolio returns. We don't account for position sizing, capacity constraints, or portfolio-level transaction costs. A real implementation would look different.
Currency. Returns are computed in the currency each line trades in, against a benchmark denominated in the home currency of its exchange. Where a listing trades in a different currency from its index, that gap sits in the abnormal return. Cross-border investors also face FX risk not captured here.
Takeaway
PEAD is a global phenomenon with nearly universal structure (every market we report except Norway has a positive Q5-Q1 spread) but the tradeable signal depends heavily on where you're trading. With MOC execution and local benchmarks, India (+2.93%), Canada (+1.28%), Thailand (+1.05%) and Taiwan (+0.85%) show post-entry beat drift with the miss leg moving the other way. Major developed markets (US -0.32%, Japan -0.30%, Korea -0.14%) show no beat drift at all.
Hong Kong and China print the largest beat numbers here, and we don't claim those levels as an earnings effect: both legs drift up in both markets. Their quintile spreads (+2.73pp and +2.14pp) are what survives.
The announcement-day reaction accounts for most of what traditional PEAD studies measure. Once removed, the beat-side signal only survives in markets with slower information diffusion. Taiwan has the widest quintile spread (Q5-Q1 = +4.55pp), driven by miss-side underperformance. India has the strongest beat-side drift (+2.93%) and the most balanced quintile gradient.
Norway's thin dataset (1,613 events) produces an unreliable negative Q5-Q1 spread, the only such case. The cleaner takeaway: the surprise ranking survives MOC execution wherever analyst coverage is thinner and information diffuses more slowly. Read that ranking through the quintile spread. The per-leg drift number is only an earnings number when the two legs point in opposite directions.
Data: Ceta Research (FMP financial data warehouse). 14 exchanges run, 12 reported, 2000-2025 (date ranges vary by exchange). Exchange-specific market cap filters. MOC execution (next-day close entry). Abnormal returns vs local index benchmarks. 1st/99th percentile winsorization. Surprise cap 200%. Single-period return cap 200%. Min entry price $1. Price oscillation cleanup applied. ASX, SAO, SGX excluded for known fatal data quality issues. UK (LSE) and Germany (XETRA) withdrawn 2026-08-29 on domicile grounds. Past performance does not guarantee future results. Educational content only, not investment advice.
References
- Ball, R. & Brown, P. (1968). "An Empirical Evaluation of Accounting Income Numbers." Journal of Accounting Research, 6(2), 159-178.
- Bernard, V. & Thomas, J. (1989). "Post-Earnings-Announcement Drift: Delayed Price Response or Risk Premium?" Journal of Accounting Research, 27(Supplement), 1-36.
- Bernard, V. & Thomas, J. (1990). "Evidence that Stock Prices Do Not Fully Reflect the Implications of Current Earnings for Future Earnings." Journal of Accounting and Economics, 13(4), 305-340.

