
Post-Earnings Drift in Japan: The Ranking Is What Survives
With MOC entry and the Nikkei as benchmark, Japan's beat drift vanishes (-0.30%, t=-2.16). Misses land at -0.83% (t=-5.21). Both legs sit below the index, so what survives is the ranking: Q5-Q1 +1.07pp, 2000-2025.

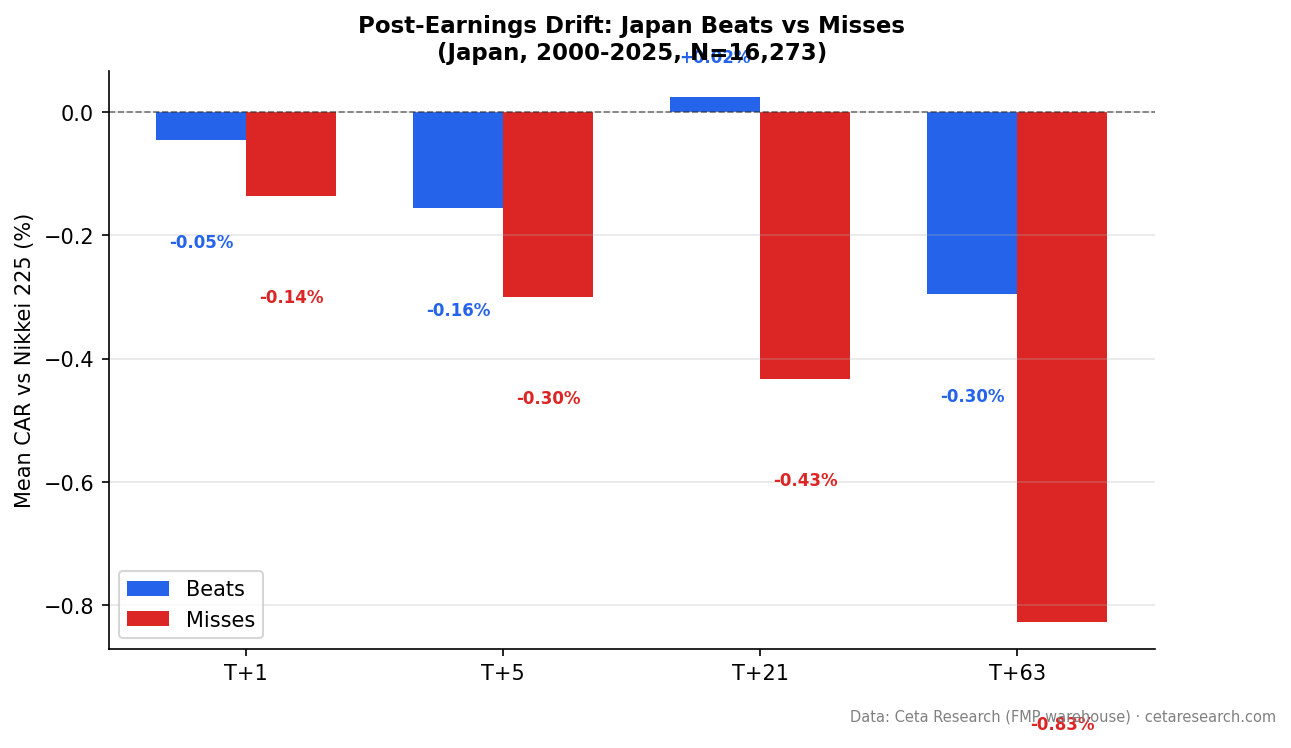
Japan's PEAD signal is a ranking signal. Misses finish behind beats, and neither group beats the Nikkei.
Contents
We analyzed 16,273 earnings events on JPX between 2000 and 2025, using next-day close entry and the Nikkei 225 as benchmark. Beats drifted -0.30% vs the Nikkei at T+63 (t=-2.16). Misses fell -0.83% (t=-5.21). Both legs are negative and both are significant. With realistic execution, the beat drift that appeared in earlier studies (using EWJ as benchmark and same-day entry) disappears. What remains is the ordering between the two groups.
The Q5-Q1 spread is +1.07 percentage points, confirming the relative signal. But the absolute drift for beats has vanished.
Data: FMP financial data warehouse, 2000–2025. Backtest run 2026-05-05. Corrected 2026-08-29.
Correction, 2026-08-29. We re-tested this study by checking whether the miss leg moves opposite to the beat leg. At T+63 it doesn't: beats and misses are both below the Nikkei and both are significant. That makes the -0.83% miss number inseparable from whatever the whole earnings-covered JPX universe did against the index, so it isn't a clean measurement of the earnings surprise. "Miss-avoidance" in this post now means misses rank behind beats, not that missing costs you 0.83% against the market. The quintile spread carries the same information without the ambiguity. No backtest number has been changed.
The Strategy
Same event-study methodology as the global PEAD analysis. We measure Cumulative Abnormal Return (CAR) at T+1, T+5, T+21, and T+63 trading days, benchmarked against the Nikkei 225.
Signal: Surprise = (epsActual - epsEstimated) / |epsEstimated|
Parameters:
- Universe: JPX, market cap > ¥100B (historical FY key_metrics)
- Period: 2000-2025 (16,273 events: 9,295 beats, 6,978 misses)
- Benchmark: Nikkei 225 (^N225, local currency)
- Execution: Next-day close (MOC)
- Surprise cap: |surprise| <= 200%
- Winsorized means: 1st/99th percentile
- Event windows: T+1, T+5, T+21, T+63 trading days
Note on data density: JPX data in the FMP warehouse is most complete from approximately 2013 onward. The effective study window for high-confidence results is roughly 12 years, not 25. Event counts are still substantial (16,273 total), but the earlier years carry less weight.
Data: Ceta Research (FMP financial data warehouse), earnings_surprises table.
Screen for current JPX earnings surprises:
SELECT es.symbol,
    CAST(es.date AS DATE) AS event_date,
    es.epsActual AS actual_eps,
    es.epsEstimated AS est_eps,
    ROUND((es.epsActual - es.epsEstimated)
        / ABS(NULLIF(es.epsEstimated, 0)) * 100, 1) AS surprise_pct
FROM earnings_surprises es
JOIN profile p ON es.symbol = p.symbol
WHERE p.exchange IN ('JPX')
  AND CAST(es.date AS DATE) >= CURRENT_DATE - INTERVAL '30' DAY
  AND es.epsEstimated IS NOT NULL
  AND ABS(es.epsEstimated) > 0.01
  AND es.epsActual > es.epsEstimated
ORDER BY surprise_pct DESC
LIMIT 30
What We Found
Misses rank behind beats. Both trail the Nikkei.
With next-day close entry and the Nikkei as benchmark:
| Category | T+1 | T+5 | T+21 | T+63 |
|---|---|---|---|---|
| Beats (9,295 events) | -0.05% | -0.16% | +0.02% | -0.30% |
| Misses (6,978 events) | -0.14% | -0.30% | -0.43% | -0.83% |
Beats hover around zero at every window. There's no positive post-entry drift for Japanese earnings beats vs the Nikkei. The +1.84% reported in earlier versions of this study (using the EWJ ETF and same-day entry) was primarily the announcement-day reaction plus USD/JPY currency effects in the benchmark.
Misses drift lower still. The -0.83% at T+63 is significant (t=-5.21). Beat hit rate: 47.1%. Miss hit rate: 46.4%.
Both legs are below the Nikkei, so read the ordering rather than the level. Beats at -0.30% and misses at -0.83% are both significant and both negative. Two significant legs pointing the same way means part of the move belongs to the whole earnings-covered JPX universe rather than to the surprise. The Nikkei is also a price index while our stock returns are dividend-adjusted, which biases both legs upward, and that bias is not separated out here. What is left once the shared component cancels is that misses finish behind beats, and the quintile spread below measures that ordering across the full surprise distribution.
The quintile structure is monotonic and wide.
| Quintile | Surprise Range | CAR at T+63 |
|---|---|---|
| Q1 (worst misses) | -199.4% to -22.3% | -0.74% |
| Q2 | -22.3% to -1.7% | -0.80% |
| Q3 | -1.7% to 11.5% | -0.97% |
| Q4 | 11.5% to 35.9% | -0.48% |
| Q5 (biggest beats) | 35.9% to 200% | +0.32% |
All quintiles except Q5 are negative. The Q5-Q1 spread is +1.07 percentage points. Q5 barely produces positive drift at +0.32%. The signal is a gradient, not a strong absolute return at the top. Q3 at -0.97% is an anomaly worth noting. The relative ordering is mostly monotonic, but the absolute numbers don't support a long-only beat-chasing strategy.
Japan vs Asia
With MOC execution and local benchmarks, the comparison to other Asian markets shows a different picture than earlier versions of this study.
India has the strongest beat drift globally (+2.93% vs Sensex at T+63). Misses show no significant drift (-0.05%, not significant). India is the one market where post-entry beat drift is clearly large enough to be tradeable.
China (SHZ+SHH) prints beat drift of +1.75% vs SSE Composite at T+63, but misses drift positive too (+0.70%), so that level is a coverage premium rather than an earnings effect. Its quintile spread is what carries the earnings signal.
Japan sits with the developed markets now. Beats are flat (-0.30%). Misses are lower (-0.83%). Both legs are below the index, so the signal is an ordering, not a short thesis with a number attached.
| Market | Beats T+63 | Misses T+63 | Benchmark |
|---|---|---|---|
| India | +2.93% | -0.05% | Sensex |
| China † | +1.75% | +0.70% | SSE Composite |
| Japan † | -0.30% | -0.83% | Nikkei 225 |
| US † | -0.32% | -0.91% | SPY |
| Canada | +1.28% | -0.08% | TSX Composite |
† Beats and misses move the same way at T+63 and both legs are significant, so the per-leg level is not attributable to the earnings surprise in these three markets. India and Canada pass that test: their miss legs move the other way. Full detail in the global comparison post.
Japan's earlier appearance as a strong two-sided signal (beats +1.84%, misses -1.38% vs EWJ) was amplified by the announcement-day reaction and by using a USD-denominated ETF as benchmark. With the Nikkei as benchmark and MOC entry, Japan's PEAD profile is closer to the US than to India or China.
Limitations
Effective history. FMP coverage for JPX grows substantially from 2013 onward. Results spanning the full 2000-2025 label reflect more of a 12-year effective study than a 25-year one. The 16,273 event count is real, but the distribution is skewed toward recent years.
MOC execution. Entering at next-day close removes the announcement-day reaction. This is the earliest realistic entry point, but removes the largest component of PEAD as traditionally measured.
Nikkei as benchmark. The Nikkei 225 is a price-weighted index of Japan's largest companies. Using it as benchmark is more appropriate than EWJ (which introduces USD/JPY currency effects), but the price-weighted methodology may not perfectly represent a cap-weighted universe. It is also a price index, while our stock returns are dividend-adjusted, so both legs carry a positive bias we have not sized here.
Both legs point the same way. At T+63 beats and misses are both significantly below the Nikkei. The per-leg levels therefore include a component common to the whole earnings-covered JPX universe. Statements about the ordering (misses behind beats, Q5 ahead of Q1) hold; statements about either leg's distance from the market don't.
Currency effects. All returns are computed in local currency (JPY). For US investors, JPY/USD fluctuations change actual realized returns. Japan has had significant yen depreciation over parts of this period.
Structural breaks. Japan's equity market has changed significantly since the Bank of Japan's ETF purchase programs began in 2013. Central bank buying of equity ETFs creates a price support mechanism that may alter drift patterns in ways that aren't captured by a uniform analysis.
Transaction costs. Japanese equity markets have tight bid-ask spreads for large-caps but meaningful friction for smaller names. The ¥100B threshold filters out the thinnest markets, but execution costs still reduce net capture.
Takeaway
Japan's PEAD signal with MOC execution and Nikkei benchmark is a ranking, not a beat-chasing signal. Beats drift -0.30% at T+63 (t=-2.16). Misses drift -0.83% (t=-5.21). Both are below the index and both are significant, so the surviving claim is that misses finish behind beats, which the Q5-Q1 spread of +1.07pp measures directly.
This puts Japan in the developed-market camp alongside the US (beats -0.32%) and Korea (beats -0.14%), where the announcement-day reaction captures nearly all the beat-side PEAD. For investors in JPX, the implementable signal is ranking the worst-miss quintile last rather than chasing beats.
For beat-side drift that stands on its own, India is the case in our global study where the beat leg is clearly positive (+2.93% vs Sensex) and the miss leg moves the other way. Hong Kong prints a bigger-looking +2.55% vs the Hang Seng, but its misses drift up too, so that number carries the same ambiguity as Japan's.
Data: Ceta Research (FMP financial data warehouse). 16,273 events, JPX, 2000-2025. MOC execution (next-day close entry). Abnormal returns computed vs Nikkei 225. 1st/99th percentile winsorization. Surprise cap 200%, Single-period return cap 200%. Past performance does not guarantee future results. Educational content only, not investment advice.
References
- Ball, R. & Brown, P. (1968). "An Empirical Evaluation of Accounting Income Numbers." Journal of Accounting Research, 6(2), 159-178.
- Bernard, V. & Thomas, J. (1989). "Post-Earnings-Announcement Drift: Delayed Price Response or Risk Premium?" Journal of Accounting Research, 27(Supplement), 1-36.
- Bernard, V. & Thomas, J. (1990). "Evidence that Stock Prices Do Not Fully Reflect the Implications of Current Earnings for Future Earnings." Journal of Accounting and Economics, 13(4), 305-340.

