
R&D Efficiency Backtest (India/NSE): 6.50% CAGR vs Sensex 12.06%, 56% Cash
The R&D efficiency screen on NSE-only sits in cash for 56% of years. When invested it was volatile, with two spectacular years (2014 +59.81% against a Sensex up 8.14%, and 2023 +83.18% against 21.83%). The 25-year CAGR of 6.50% trails the Sensex's 12.06%. It doesn't beat the Indian market.

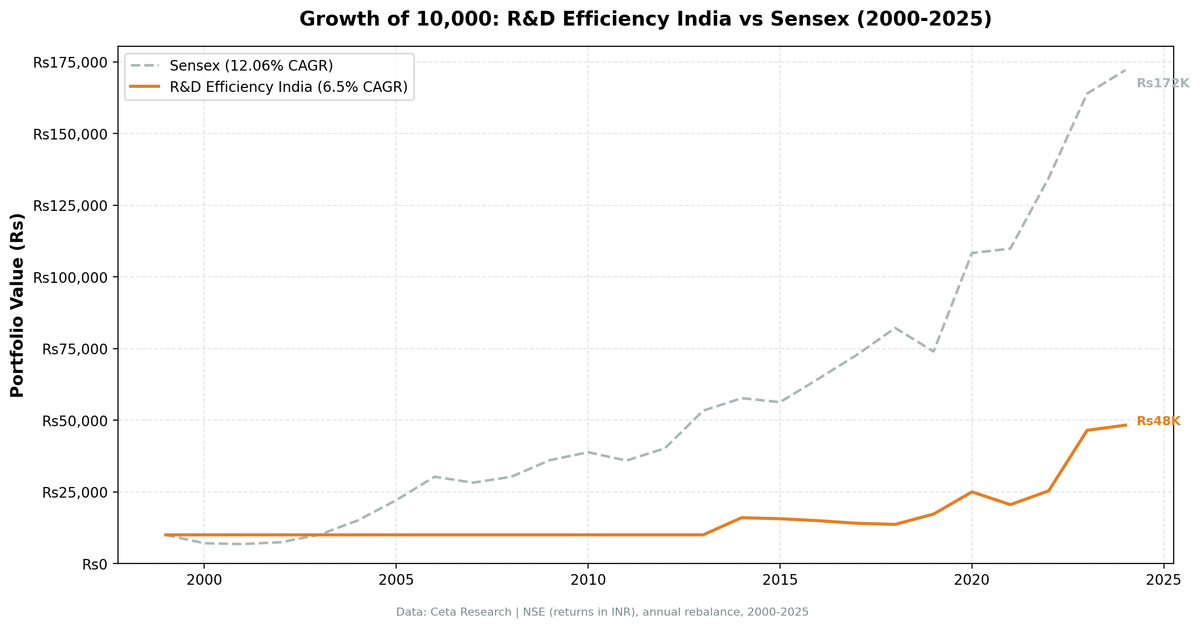
The R&D efficiency screen on NSE has a thin qualifying universe. The strategy held cash in 14 of 25 years, every year from 2000 through 2013. In those years fewer than 10 NSE companies passed all filters at once. When the screen did find stocks it delivered some extraordinary years: 2014 (+59.81% vs Sensex +8.14%), 2023 (+83.18% vs Sensex +21.83%). But the full 25-year CAGR is 6.50% vs Sensex 12.06%. The strategy underperforms its own market by 5.56pp annually.
Contents
- Method
- What We Found
- A thin universe, a volatile active period
- Why the sector composition drives the returns
- Why results changed from the previous version
- Full returns (all 25 years)
- Performance summary
- The Screen
- Limitations
- Takeaway
The honest version of this result: the screen works in India when it has enough qualifying companies to hold. But the 56% cash rate means it's invested well under half the time, and the active-period record is volatile. The two spectacular years (2014, 2023) prop up the compounded return, while 2021 (-19.28% excess), 2017 (-18.95% excess) and 2016 (-18.90% excess) are the drags.
Data: FMP financial data warehouse, 2000–2025. Updated August 2026.
Method
Data source: Ceta Research (FMP financial data warehouse) Universe: NSE only, market cap above exchange-specific threshold (₹20B, roughly $240M USD) Period: 2000–2024 (25 annual rebalance periods; invested in 2014–2024 only) Rebalancing: Annual (July), equal weight top 30 by R&D efficiency Execution: Next-day close (MOC, signal from prior close, entry at following close) Benchmark: Sensex (^BSESN, BSE Sensex 30 index) Cash rule: Hold cash if fewer than 10 stocks qualify
Filters:
| Criterion | Threshold | Rationale |
|---|---|---|
| R&D / Revenue | 2–30% | Real R&D investment, not negligible or excessive |
| Gross Margin | > 40% | Excludes hardware, manufacturing, commodity companies |
| ROE | > 10% | Quality floor |
| Ranking signal | Gross Profit / R&D Expenses | Higher = more output per R&D dollar |
Universe note: NSE-only. BSE was removed due to significant dual-listing overlap with NSE (estimated 38% duplication), which inflated portfolio counts and introduced position duplicates in earlier versions of this backtest. An older version of this study ran BSE+NSE combined and benchmarked to SPY, which produced a headline of 15.74% CAGR. That number carried both the dual-listing duplication and the wrong benchmark. The NSE-only results here, measured against the Sensex, are the accurate ones.
Data availability: FMP's NSE R&D expense data is thin before 2014 for the specific combination of filters used. The strategy held cash in 14 of 25 years, 2000 through 2013 without exception, then ran continuously from 2014 onward, so the invested record is 11 years. The screen counts distinct companies rather than listings, which is why 2011, an invested year in an earlier version of this study, no longer clears the 10-company floor.
Transaction costs: size-tiered (0.1% for market cap > ₹equivalent of $10B, 0.3% for $2–10B, 0.5% below $2B), one-way.
Data quality guards: price rows where adjusted close spikes and then reverts within a day or two are removed before any price lookup, since those are phantom holiday rows and broken split adjustments in the vendor feed rather than real moves. Individual positions are dropped if the entry price is below $1 equivalent or the single-period return exceeds 200%. Both guards are new to this run.
Full methodology: backtests/METHODOLOGY.md
What We Found
A thin universe, a volatile active period
The core problem on NSE is that the qualifying universe is small. The R&D efficiency screen requires R&D spending of 2-30% of revenue, gross margins above 40%, and ROE above 10%. On NSE, this combination is met by a small set of pharma and IT companies. Through most of the 2000s, fewer than 10 companies met all criteria at once.
The screen found nothing at all until 2014, then ran continuously. Its first year was among its best: +59.81% vs Sensex +8.14%. Then came three consecutive losing years (2016 to 2018), a strong 2019, and the spectacular 2023 (+83.18% vs Sensex +21.83%).
The invested-period record (11 years):
| Year | Portfolio | Sensex | Excess |
|---|---|---|---|
| 2014 | +59.81% | +8.14% | +51.67% |
| 2015 | -2.23% | -2.39% | +0.15% |
| 2016 | -4.44% | +14.45% | -18.90% |
| 2017 | -6.00% | +12.95% | -18.95% |
| 2018 | -2.73% | +12.91% | -15.64% |
| 2019 | +26.28% | -9.98% | +36.26% |
| 2020 | +44.97% | +46.43% | -1.46% |
| 2021 | -17.85% | +1.43% | -19.28% |
| 2022 | +23.55% | +22.49% | +1.07% |
| 2023 | +83.18% | +21.83% | +61.34% |
| 2024 | +3.86% | +5.00% | -1.14% |
Win rate in the invested years: 5 out of 11. Compounding only those 11 years, the strategy returned 15.38% a year against the Sensex's 11.24% over the same years. So the screen does add value when it can deploy, though a win rate under half means that value comes from the size of two years rather than from consistency. The problem is that it spends the other 14 years in cash while the Sensex compounds without it.
Three of the four worst years are consecutive: 2016, 2017 and 2018 gave back 18.90, 18.95 and 15.64 points. That stretch is when the screen's pharma names were dealing with USFDA import alerts while the broader Indian market ran.
Why the sector composition drives the returns
India's NSE is dominated by pharma and IT services companies that pass the R&D efficiency screen: Sun Pharma, Dr. Reddy's, Cipla, Lupin, TCS, Infosys, Wipro, HCL Technologies. These companies have gross margins above 40%, R&D spending in the 5-15% range, and consistent ROE.
When these sectors perform well, the strategy does well. When they lag, there's no diversification to compensate. 2016 through 2018 saw Indian pharma companies dealing with USFDA import alerts and regulatory delays, so the companies that dominate the screen were underperforming the broader market. 2021 saw post-COVID mean reversion in pharma names.
The 2023 result (+83.18%) was exceptional, driven by a concentrated book of high-efficiency pharma and IT names in a year when both ran hard. This kind of concentrated sector performance can be very good or very bad depending on the year.
Why results changed from the previous version
An older version of this backtest used BSE+NSE combined and benchmarked to SPY. It showed 15.74% CAGR against SPY's 7.83% and only 24% cash periods. Three things changed:
1. Universe: BSE+NSE became NSE only. Removing BSE eliminated significant dual-listing duplication. This reduced the qualifying count below the minimum threshold in more years, pushing cash periods from 24% to 56%.
2. Benchmark: SPY became the Sensex. India's equity market compounded at 12.06% CAGR over this period. Comparing INR returns to a USD index understated the local market badly.
3. Execution: same-day entry became next-day close (MOC), which removed the same-bar entry bias.
All three changes move in the direction of accuracy. The 15.74% figure was real arithmetic on the wrong universe against the wrong benchmark. The Sensex is the right yardstick for an Indian equity strategy.
Full returns (all 25 years)
| Year | Portfolio | Sensex | Excess |
|---|---|---|---|
| 2000 | 0.00% (cash) | -29.29% | +29.29% |
| 2001 | 0.00% (cash) | -4.12% | +4.12% |
| 2002 | 0.00% (cash) | +9.63% | -9.63% |
| 2003 | 0.00% (cash) | +35.24% | -35.24% |
| 2004 | 0.00% (cash) | +49.41% | -49.41% |
| 2005 | 0.00% (cash) | +46.97% | -46.97% |
| 2006 | 0.00% (cash) | +37.11% | -37.11% |
| 2007 | 0.00% (cash) | -6.82% | +6.82% |
| 2008 | 0.00% (cash) | +7.27% | -7.27% |
| 2009 | 0.00% (cash) | +19.12% | -19.12% |
| 2010 | 0.00% (cash) | +7.75% | -7.75% |
| 2011 | 0.00% (cash) | -7.52% | +7.52% |
| 2012 | 0.00% (cash) | +11.87% | -11.87% |
| 2013 | 0.00% (cash) | +32.77% | -32.77% |
| 2014 | +59.81% | +8.14% | +51.67% |
| 2015 | -2.23% | -2.39% | +0.15% |
| 2016 | -4.44% | +14.45% | -18.90% |
| 2017 | -6.00% | +12.95% | -18.95% |
| 2018 | -2.73% | +12.91% | -15.64% |
| 2019 | +26.28% | -9.98% | +36.26% |
| 2020 | +44.97% | +46.43% | -1.46% |
| 2021 | -17.85% | +1.43% | -19.28% |
| 2022 | +23.55% | +22.49% | +1.07% |
| 2023 | +83.18% | +21.83% | +61.34% |
| 2024 | +3.86% | +5.00% | -1.14% |
The 2003 to 2006 rows are the expensive ones. The Sensex returned 35%, 49%, 47% and 37% in those four windows while the screen sat in cash. No later run of good years recovers that.
Performance summary
| Metric | Portfolio | Sensex |
|---|---|---|
| CAGR (full 25 years) | 6.50% | 12.06% |
| Total return | 382.5% | 1,621.6% |
| Max drawdown | -17.85% | -32.20% |
| Annualized volatility | 22.76% | 19.59% |
| Sharpe ratio | 0.012 | 0.284 |
| Avg stocks held (when invested) | 17.5 | n/a |
| Cash periods | 56% (14 of 25 years) | n/a |
Rs 10,000 invested in 2000 would have grown to Rs 48,247 in the portfolio vs Rs 172,157 in the Sensex over the same 25 years. Returns in INR.
The Sharpe ratio of 0.012 reflects the negative excess return combined with the cash drag. The max drawdown of -17.85% equals the 2021 loss, which on an annual series is the only single year large enough to set the peak-to-trough figure. It's genuinely shallower than the Sensex's -32.20%, but on a strategy that's in cash half the time that's a statement about deployment, not about risk control.
The Screen
Run this on the NSE universe to see today's top R&D efficiency stocks:
WITH inc AS (
    SELECT symbol, revenue, grossProfit, researchAndDevelopmentExpenses,
           ROW_NUMBER() OVER (PARTITION BY symbol ORDER BY dateEpoch DESC) AS rn
    FROM income_statement
    WHERE period = 'FY'
      AND revenue > 0
      AND grossProfit > 0
      AND researchAndDevelopmentExpenses > 0
)
SELECT
    inc.symbol,
    p.companyName,
    p.exchange,
    p.sector,
    ROUND(inc.researchAndDevelopmentExpenses / inc.revenue * 100, 1) AS rd_ratio_pct,
    ROUND(inc.grossProfit / inc.revenue * 100, 1) AS gross_margin_pct,
    ROUND(inc.grossProfit / inc.researchAndDevelopmentExpenses, 2) AS rd_efficiency,
    ROUND(k.returnOnEquityTTM * 100, 1) AS roe_pct,
    ROUND(p.marketCap / 1e9, 2) AS mktcap_b
FROM inc
JOIN profile p ON inc.symbol = p.symbol
JOIN key_metrics_ttm k ON inc.symbol = k.symbol
WHERE inc.rn = 1
  AND inc.researchAndDevelopmentExpenses / inc.revenue > 0.02
  AND inc.researchAndDevelopmentExpenses / inc.revenue < 0.30
  AND inc.grossProfit / inc.revenue > 0.40
  AND k.returnOnEquityTTM > 0.10
  AND p.marketCap > 20000000000
  AND p.exchange = 'NSE'
  AND p.isFund = false
  AND p.isEtf = false
  AND p.isActivelyTrading = true
  -- Exclude non-operating lines: warrants, rights, units and preferred shares.
  -- isFund is false for a closed-end fund's preferred line, so GAM-PB (which reports
  -- investment income as revenue at a 100% gross margin) otherwise ranks 3rd here.
  AND p.symbol NOT LIKE '%-WT'
  AND p.symbol NOT LIKE '%-RT'
  AND p.symbol NOT LIKE '%-U'
  AND p.symbol NOT LIKE '%-UN'
  AND p.symbol NOT LIKE '%-P_'
QUALIFY ROW_NUMBER() OVER (PARTITION BY p.companyName
                           ORDER BY p.averageVolume DESC) = 1
ORDER BY rd_efficiency DESC
LIMIT 30
Run this query on Ceta Research
Limitations
Currency risk. Returns are in INR. The INR has lost roughly 3-4% annually against USD over long periods. For a USD-based investor, this reduces the effective CAGR.
Thin qualifying universe. The strategy held cash for 14 of 25 years on NSE-only data. This isn't a data artifact, the NSE simply has fewer companies meeting all three criteria simultaneously than BSE+NSE combined. A lower gross margin threshold or lower R&D ratio would expand the universe but change the signal. Even when invested, the book averaged 17.5 names against a 30-stock target.
Sector concentration. The portfolio is heavily concentrated in pharma and IT services. Both sectors can underperform for multi-year periods (2016-2018 for pharma regulatory issues, 2021 for post-COVID mean reversion). There's no defensive diversification when these sectors lag.
Previous version used wrong benchmark. The prior published version compared Indian returns to SPY. This was misleading, India's market returned 12.06% CAGR (Sensex) over this period. The Sensex is the correct local benchmark. This correction significantly changes the narrative.
Look-ahead bias mitigation. The 45-day point-in-time lag prevents use of financial data before it was publicly reported. Survivorship bias from the current profile table is partially present.
Takeaway
The R&D efficiency screen on NSE finds real companies with real competitive advantages: Indian pharma generics with 60-70% gross margins, IT services companies with consistent R&D in platforms and delivery automation. In years when these sectors lead (2014, 2023), the strategy produces extraordinary returns.
The problem is the qualifying universe is too thin for consistent deployment. A 56% cash rate means the strategy is idle for well over half the period, and the Sensex compounded at 12.06% across the whole of it, including the 2003 to 2006 run when the screen owned nothing.
The screen is worth running to identify India's most R&D-efficient pharma and IT companies. But as a full-period systematic strategy against a Sensex benchmark, the current version doesn't generate net alpha.
Full backtest code: github.com/ceta-research/backtests
Data: Ceta Research (FMP financial data warehouse). Returns are in Indian Rupees (INR). Currency risk applies for non-INR investors. Benchmark: BSE Sensex 30 (^BSESN). Past performance does not guarantee future results.
Past performance does not guarantee future results. This is educational content, not investment advice.

