
We Backtested Revenue Acceleration on 25 Years of US Data. It Failed.
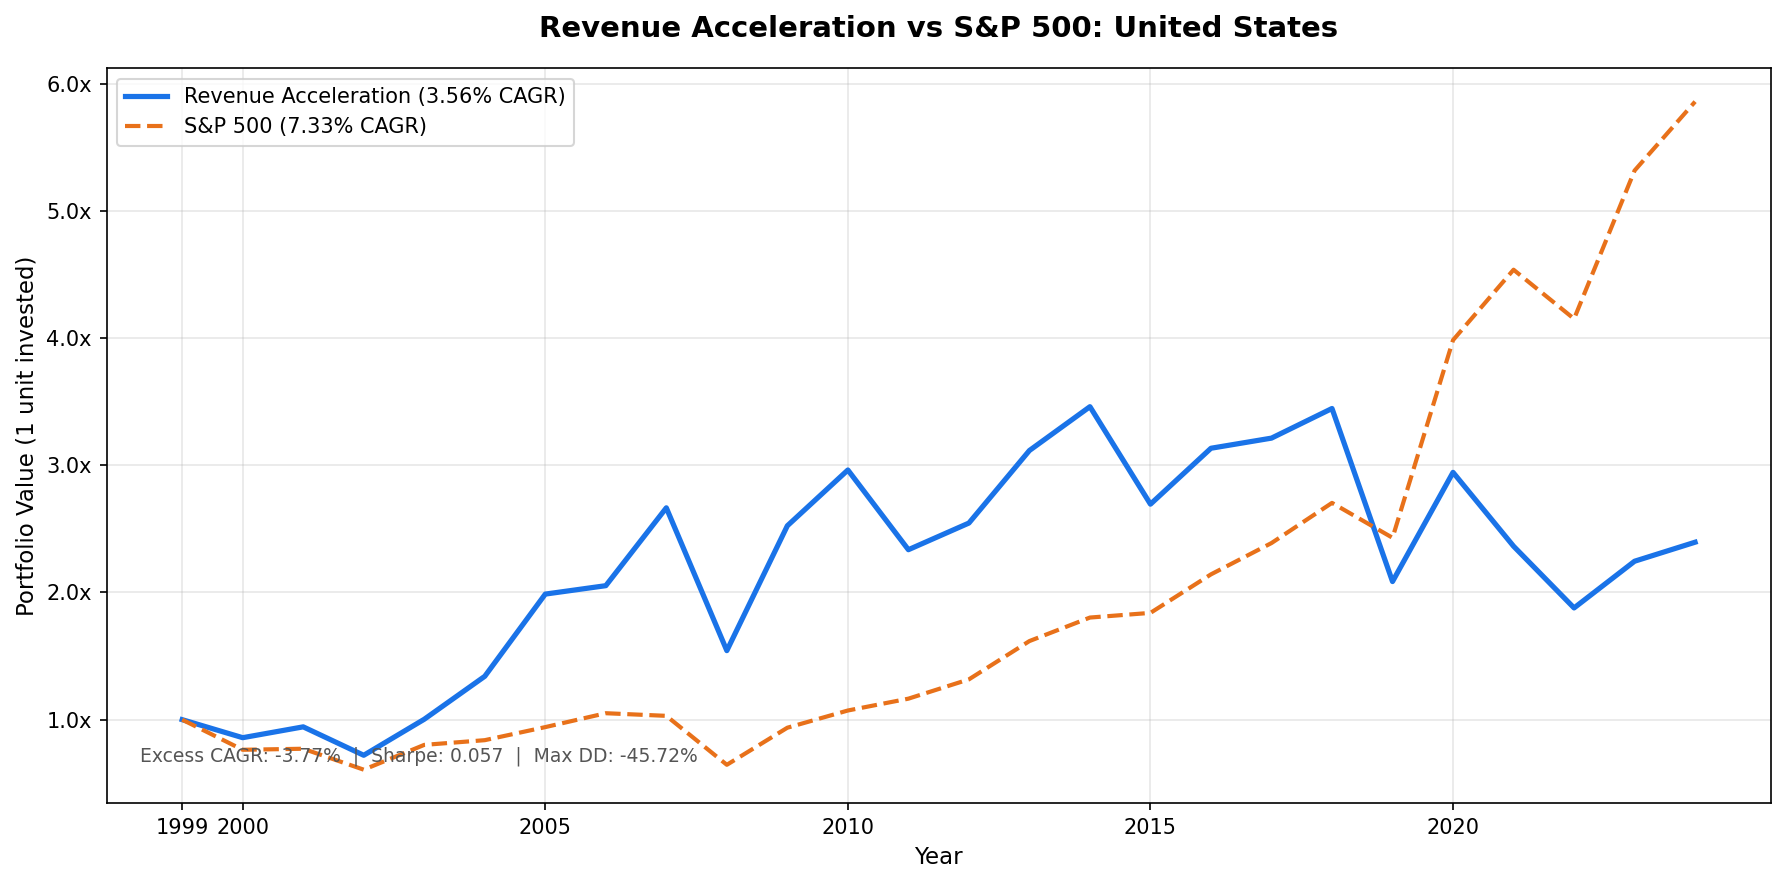
We ran revenue acceleration on all US stocks from 2000 to 2025. 3.56% CAGR vs 7.33% for the S&P 500, 107% down capture, fully invested every year. Every year from 2011 on lost to the index.

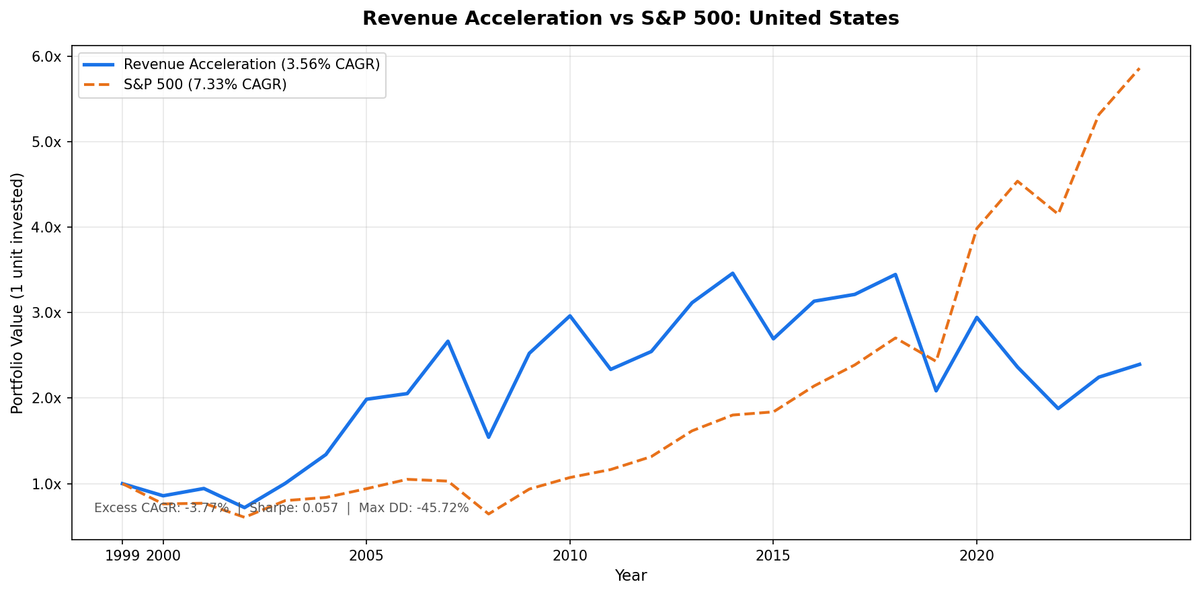
We ran the revenue acceleration strategy on all US stocks (NYSE, NASDAQ, AMEX) from 2000 to 2025. The signal: buy companies whose revenue growth rate is speeding up, filtered for quality. The result: 3.56% annualized vs 7.33% for the S&P 500. A $10,000 investment grew to $23,952 vs $58,591 for the index.
Contents
- Method
- What is Revenue Acceleration?
- What We Found
- The strategy underperformed in 17 of 25 years.
- Year-by-Year Returns
- The early years looked like confirmation.
- 2011, 2019, and 2021 broke it.
- Why the signal fails.
- Limitations
- Takeaway
- Part of a Series
- Run This Screen Yourself
- References
The strategy underperformed by 3.77 percentage points per year, captured 107.0% of the market's downside, and drew down further than the index in the worst stretch. It took on more risk and delivered less return.
Data: FMP financial data warehouse, 2000–2025. Updated August 2026.
Method
Data source: Ceta Research (FMP financial data warehouse) Universe: NYSE + NASDAQ + AMEX, market cap > $1B USD Period: 2000–2025 (25 years, 25 annual periods) Rebalancing: Annual (April 1), equal weight Execution: Next-day close. The screen is computed on the rebalance date and filled at the following session's close Benchmark: S&P 500 Total Return (SPY) Risk-free rate: 2.0% (US 10-year), applied to both the portfolio and the benchmark Sharpe Cash rule: Hold cash if fewer than 10 stocks qualify Transaction costs: Size-tiered model (0.1–0.5% one-way based on market cap)
All financial data uses a 45-day lag on annual filings to prevent look-ahead bias. Revenue figures, ROE, and debt-to-equity come from fiscal year filings as they would have been available at each April rebalance date.
Two execution details matter for reproducing these numbers. Entries and exits both use the next session's close rather than the close of the rebalance date itself, so no trade is filled at a price observed on the same bar that produced the signal. And the price data passes two quality screens before use: rows where adjusted close spikes and reverts within a day or two are dropped as bad adjustments, and any position entering below $1 or posting a single-year return above 200% is excluded as a likely data artifact rather than a real trade.
What is Revenue Acceleration?
Revenue growth is straightforward: how much did revenue increase year-over-year? Revenue acceleration is a second-order metric: is that growth rate speeding up or slowing down?
A company with 10% YoY revenue growth that grew 7% the prior year is accelerating. A company with 25% revenue growth that grew 30% the prior year is decelerating, even though it's still a fast grower. The acceleration signal tries to find companies whose growth story is improving.
Signal computation: - growth_current = (revenue_t - revenue_t1) / revenue_t1 (most recent FY vs prior FY) - growth_prior = (revenue_t1 - revenue_t2) / revenue_t2 (prior FY vs two years ago) - acceleration = growth_current - growth_prior
Requires three consecutive annual revenue filings per symbol.
All six filters must pass at each April rebalance:
| Filter | Threshold | Why |
|---|---|---|
| Revenue acceleration | > 0 | Growth rate must be speeding up |
| Current revenue growth | > 5% | Exclude recovering-from-near-zero noise |
| Return on equity | > 10% | Quality filter |
| Debt/equity | < 1.5 | Reasonable leverage |
| Market cap | > $1B USD | Liquid, institutional-grade stocks |
| Selection | Top 30 by acceleration magnitude | Rank by strength of signal |
Academic basis: Chan, Jegadeesh & Lakonishok (1996) found that past returns and past earnings surprises each predict drift in future returns, which is the underreaction case for trading fundamental momentum. The opposing finding is older and better known. Lakonishok, Shleifer & Vishny (1994) showed that investors extrapolate past growth too far into the future, which leaves the fastest growers overpriced rather than underpriced. Revenue acceleration is a bet on the first mechanism. The results below point to the second.
What We Found
The strategy underperformed in 17 of 25 years.
| Metric | Revenue Acceleration | S&P 500 |
|---|---|---|
| CAGR | 3.56% | 7.33% |
| Total Return | 140% | 486% |
| Max Drawdown | -45.72% | -39.33% |
| Volatility (ann.) | 27.45% | 21.07% |
| Sharpe Ratio | 0.057 | 0.253 |
| Up Capture | 85.7% | N/A |
| Down Capture | 107.0% | N/A |
| Cash Periods | 0 of 25 | N/A |
| Avg Stocks | 23.6 | N/A |
The strategy was fully invested every year, with no periods where qualifying stocks dropped below 10. That means the underperformance can't be explained by cash drag.
The pair of capture ratios tells the core story. Across the years the S&P 500 fell, this portfolio absorbed 107.0% of the decline on average, and in the years it rose the portfolio kept only 85.7% of the gain. Those are averages, not rules: the strategy actually held up better than the index in two of the six down years, 2000 and 2007. But it fell further in the other four, and giving up upside while taking on extra downside is the combination that compounds badly. It shows up in the drawdown: the worst peak-to-trough stretch was -45.72% against the index's -39.33%.
Year-by-Year Returns
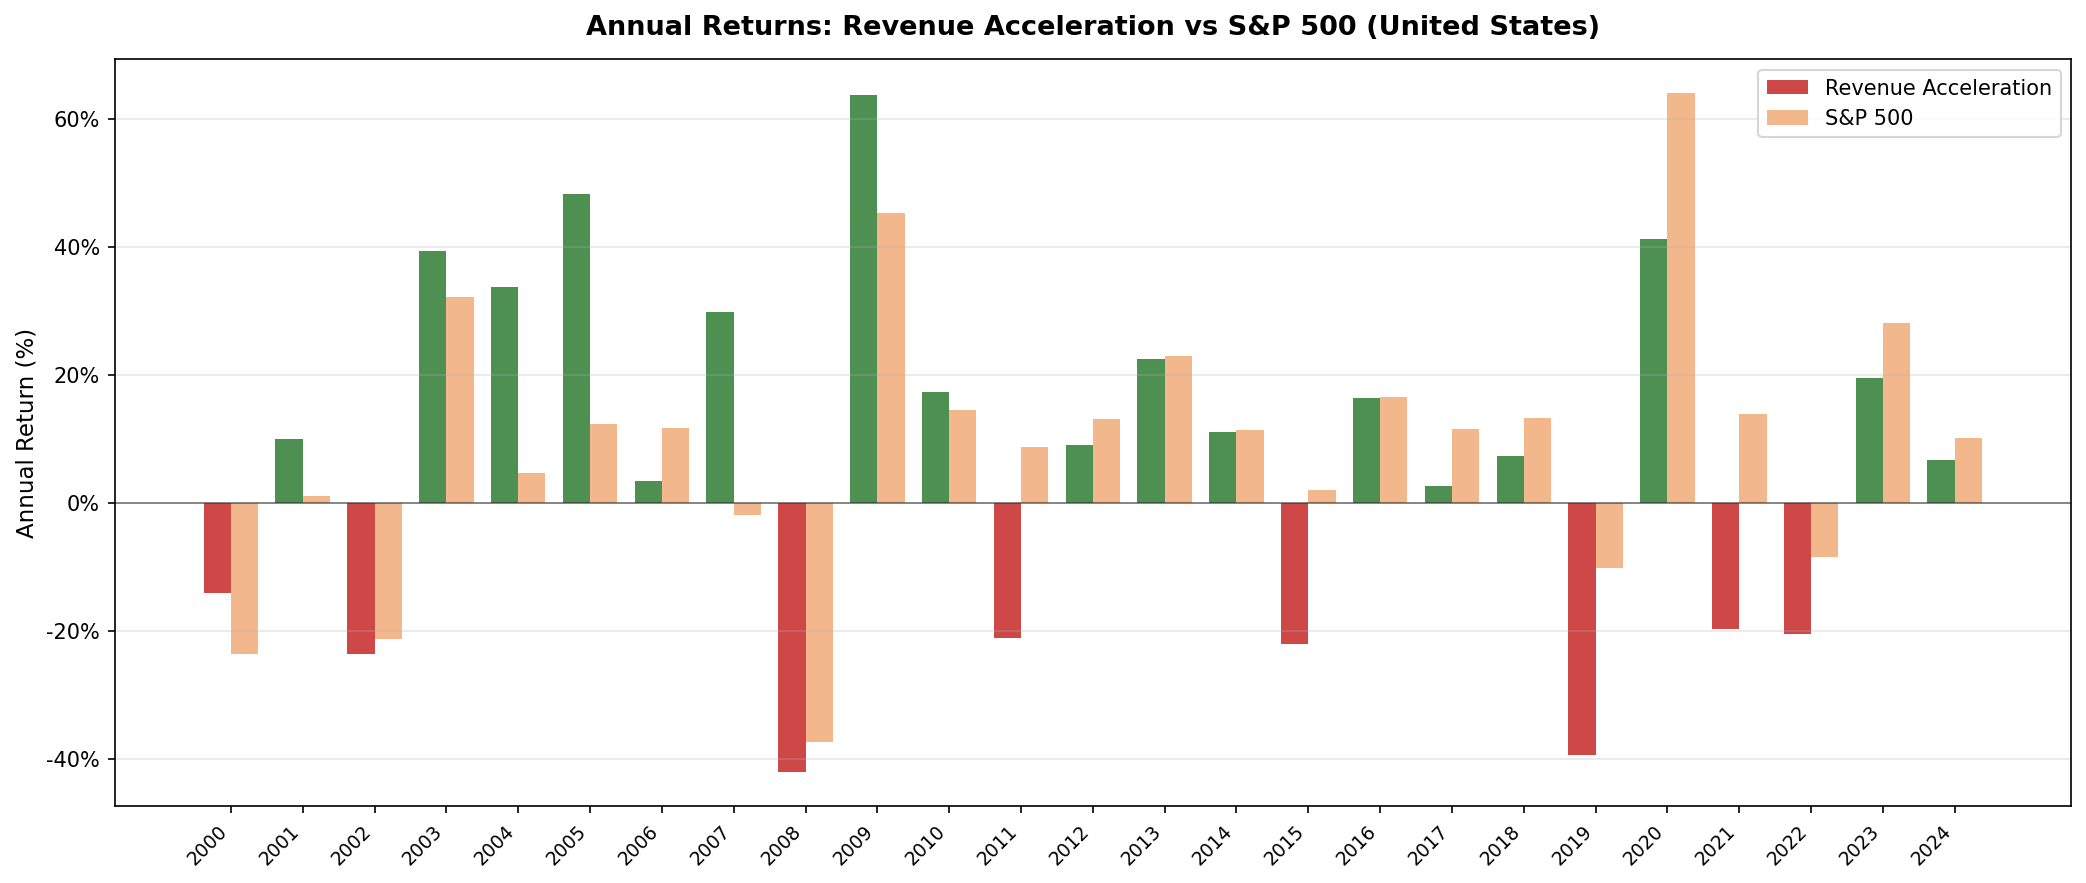
Each row runs April to April, so "2019" means April 2019 to April 2020.
| Year | Rev Accel | S&P 500 | Excess |
|---|---|---|---|
| 2000 | -14.17% | -23.68% | +9.5% |
| 2001 | +9.93% | +1.07% | +8.9% |
| 2002 | -23.69% | -21.34% | -2.3% |
| 2003 | +39.34% | +32.14% | +7.2% |
| 2004 | +33.66% | +4.61% | +29.1% |
| 2005 | +48.20% | +12.25% | +36.0% |
| 2006 | +3.33% | +11.60% | -8.3% |
| 2007 | +29.81% | -1.97% | +31.8% |
| 2008 | -42.13% | -37.36% | -4.8% |
| 2009 | +63.65% | +45.19% | +18.5% |
| 2010 | +17.37% | +14.44% | +2.9% |
| 2011 | -21.15% | +8.68% | -29.8% |
| 2012 | +8.97% | +13.02% | -4.0% |
| 2013 | +22.40% | +22.87% | -0.5% |
| 2014 | +11.06% | +11.43% | -0.4% |
| 2015 | -22.15% | +2.04% | -24.2% |
| 2016 | +16.32% | +16.46% | -0.1% |
| 2017 | +2.54% | +11.49% | -8.9% |
| 2018 | +7.25% | +13.22% | -6.0% |
| 2019 | -39.48% | -10.14% | -29.3% |
| 2020 | +41.16% | +63.95% | -22.8% |
| 2021 | -19.72% | +13.89% | -33.6% |
| 2022 | -20.53% | -8.51% | -12.0% |
| 2023 | +19.55% | +28.08% | -8.5% |
| 2024 | +6.66% | +10.19% | -3.5% |
The early years looked like confirmation.
From 2000 to 2010, the strategy beat the S&P 500 in eight years out of eleven, and in 2004, 2005, and 2007 by enormous margins (+29.1%, +36.0%, +31.8%). After the dot-com crash, accelerating companies were genuinely mispriced. Energy companies, mid-cap industrials, healthcare names the market had written off alongside tech: the acceleration filter found them before the market rerated them.
If the backtest had stopped in 2010, this would be a very different write-up. Then the sign flipped and stayed flipped: every one of the fourteen years from 2011 to 2024 produced a negative excess return. Not one break-even year in the back half of the sample.
2011, 2019, and 2021 broke it.
Three years define the strategy's failure.
2011: Portfolio -21.2% vs SPY +8.7%. A -29.8% gap. The European sovereign debt crisis and US credit downgrade triggered a risk-off rotation. Revenue accelerators in 2011 were overweight cyclical and tech names that got hit hard in the selloff.
2019: Portfolio -39.5% vs SPY -10.1%. A -29.3% gap. The portfolio was concentrated in names that had accelerated through the 2018 growth cycle, many of which got cut in half when growth expectations reset and then met the COVID selloff.
2021: Portfolio -19.7% vs SPY +13.9%. A -33.6% gap, the largest in the study. In a year when the index returned close to 14%, the acceleration portfolio lost a fifth of its value. This is the clearest evidence that the signal picks peak-cycle names that are about to decelerate.
Those three years cost 93 percentage points of relative performance between them. Strip them out and the other 22 years compound at 8.69% a year against the index's 7.85%. The whole 25-year verdict rests on three bad Aprils, which is itself a reason to distrust the strategy: a signal whose result hinges on three observations out of 25 isn't measuring something stable.
Why the signal fails.
Revenue acceleration identifies companies at the top of their growth trajectory. The logic is that market participants will underestimate how long the acceleration lasts, creating persistent mispricing. The data says the opposite happens: markets already price in the acceleration. By April of any given year, companies that showed the strongest revenue growth acceleration in their last filing are already trading at premium valuations.
There is a second problem underneath the pricing one. Chan, Karceski & Lakonishok (2003) found almost no persistence in company growth rates beyond what chance would produce. If growth rates don't persist, an accelerating year carries little information about the next one, and the signal is ranking companies on a number that isn't predictive to begin with.
When growth expectations miss, these are exactly the names that fall furthest. The down capture of 107.0% isn't a fluke. It's the mechanism.
Limitations
Annual rebalancing creates lag. The strategy rebalances once per year in April. If a company's revenue growth peaked in the prior fiscal year and decelerated in the current one, the signal won't catch it until the next April filing. This means holding names that have already decelerated for up to 12 months.
Revenue is a lagging indicator. Revenue figures for fiscal year 2024 become available around March 2025. By the time we act on them, the market has already seen multiple quarters of data suggesting the direction.
Survivorship bias. Company profiles use current exchange listings. Delisted companies that went to zero aren't tracked through their failure. This biases results upward, so true performance is likely modestly worse.
The universe includes closed-end funds. The screen runs on every listing with the required filings, and closed-end funds report investment income in the revenue field. Because that income swings with mark-to-market gains, funds can post enormous "revenue acceleration" and crowd into the top 30. In most years they're a small minority (2 or 3 of 30 in 2005, 2012 and 2023), but in April 2018 they took 18 of the 30 slots. Rerunning with funds and ETFs excluded lifts the US CAGR from 3.56% to 4.26%, still 3.07 points behind the index. The conclusion doesn't change, but the portfolio in some years holds less of what the name suggests than you'd expect.
Transaction costs included. Results reflect size-tiered transaction costs on entry and exit. Without costs, CAGR would be approximately 0.3–0.5% higher annually.
Annual observations are few. Twenty-five annual periods is a small sample for a strategy this volatile (27.45% annualized). The direction of the result is consistent, but the precise gap carries wide error bars.
25 years spans multiple regimes. The strategy behaved differently in 2000–2010 (positive alpha in eight of eleven years) vs 2011–2024 (negative in all fourteen). No single regime dominates the full period, and the split is stark enough that the average hides more than it shows.
Takeaway
Revenue acceleration fails as a standalone strategy in the US market. Over 25 years, it returned 3.56% annually against 7.33% for the S&P 500. A $10,000 investment grew to $23,952 vs $58,591 for the index. The risk metrics confirm the underperformance isn't just bad luck: down capture of 107.0%, a max drawdown of -45.72% against the index's -39.33%, and a Sharpe ratio of 0.057 vs the benchmark's 0.253.
The honest interpretation: the US equity market prices growth momentum too efficiently for revenue acceleration alone to generate alpha. The signal is public, widely tracked, and reflects information that has already been bid into stock prices by the time it shows up in annual filings.
That verdict is specific to the US. Run the same screen on Canadian or German listings and the result changes, which says more about what those markets' accelerators are made of than about the signal itself.
Revenue acceleration may still have value as a secondary filter combined with valuation screens or as a momentum confirmation signal. As the primary ranking factor, it doesn't work in the US.
Part of a Series
This post is part of our Revenue Acceleration global exchange comparison:
- Canada: 8.39% CAGR, +1.07% over the S&P 500 and +4.34% over the TSX Composite, with 43% down capture
- Germany: 7.71% CAGR, +3.20% over the DAX, and the shallowest drawdown in the study at -21.52%
- Revenue Acceleration: 15-Exchange Global Comparison: from Canada +1.07% to Hong Kong -11.49% against the S&P 500
Run This Screen Yourself
The current US revenue acceleration screen, top 30 accelerating stocks on the latest annual filings. This version adds guards the backtest doesn't use: it drops funds and ETFs, dedupes share classes, and bounds growth and ROE to keep restatement artifacts out of the top rows. Without them the first page fills with closed-end funds and companies showing five-figure percentage "growth".
WITH inc AS (
    SELECT symbol, revenue, dateEpoch,
           ROW_NUMBER() OVER (PARTITION BY symbol ORDER BY dateEpoch DESC) AS rn
    FROM income_statement
    WHERE period = 'FY' AND revenue > 0
),
rev_calc AS (
    SELECT r1.symbol,
           (r1.revenue - r2.revenue) / NULLIF(r2.revenue, 0) AS growth_current,
           (r2.revenue - r3.revenue) / NULLIF(r3.revenue, 0) AS growth_prior,
           (r1.revenue - r2.revenue) / NULLIF(r2.revenue, 0)
             - (r2.revenue - r3.revenue) / NULLIF(r3.revenue, 0) AS acceleration
    FROM inc r1
    JOIN inc r2 ON r1.symbol = r2.symbol AND r2.rn = 2
    JOIN inc r3 ON r1.symbol = r3.symbol AND r3.rn = 3
    WHERE r1.rn = 1
),
met AS (
    SELECT symbol, returnOnEquity, marketCap,
           ROW_NUMBER() OVER (PARTITION BY symbol ORDER BY dateEpoch DESC) AS rn
    FROM key_metrics WHERE period = 'FY'
),
rat AS (
    SELECT symbol, debtToEquityRatio,
           ROW_NUMBER() OVER (PARTITION BY symbol ORDER BY dateEpoch DESC) AS rn
    FROM financial_ratios WHERE period = 'FY'
)
SELECT rc.symbol,
       p.companyName,
       p.sector,
       ROUND(rc.growth_current * 100, 1) AS current_growth_pct,
       ROUND(rc.growth_prior * 100, 1) AS prior_growth_pct,
       ROUND(rc.acceleration * 100, 1) AS acceleration_ppt,
       ROUND(m.returnOnEquity * 100, 1) AS roe_pct,
       ROUND(r.debtToEquityRatio, 2) AS de_ratio,
       ROUND(m.marketCap / 1e9, 1) AS mktcap_b
FROM rev_calc rc
JOIN met m ON rc.symbol = m.symbol AND m.rn = 1
JOIN rat r ON rc.symbol = r.symbol AND r.rn = 1
JOIN profile p ON rc.symbol = p.symbol
WHERE rc.growth_current > rc.growth_prior
  AND rc.growth_current > 0.05
  AND rc.growth_current < 3.0        -- data guard: >300% YoY is a restatement artifact
  AND rc.growth_prior > -0.5         -- data guard: prior year didn't collapse
  AND m.returnOnEquity > 0.10
  AND m.returnOnEquity < 1.0         -- data guard: drops corrupted ROE rows
  AND r.debtToEquityRatio >= 0
  AND r.debtToEquityRatio < 1.5
  AND m.marketCap > 1000000000
  AND p.exchange IN ('NYSE', 'NASDAQ', 'AMEX')
  AND p.isFund = false AND p.isEtf = false AND p.isActivelyTrading = true
QUALIFY ROW_NUMBER() OVER (PARTITION BY p.companyName ORDER BY rc.symbol) = 1
ORDER BY rc.acceleration DESC
LIMIT 30
Run this screen on Ceta Research
The full backtest code (Python + DuckDB) is on GitHub.
References
- Chan, L. K. C., Jegadeesh, N., & Lakonishok, J. (1996). "Momentum Strategies." Journal of Finance, 51(5), 1681–1713.
- Lakonishok, J., Shleifer, A., & Vishny, R. (1994). "Contrarian Investment, Extrapolation, and Risk." Journal of Finance, 49(5), 1541–1578.
- Chan, L. K. C., Karceski, J., & Lakonishok, J. (2003). "The Level and Persistence of Growth Rates." Journal of Finance, 58(2), 643–684.
Data: Ceta Research, FMP financial data warehouse. Universe: NYSE + NASDAQ + AMEX. Annual rebalance (April), next-day close execution, equal weight, transaction costs included, 2000–2025. Not investment advice.

