
We Backtested Revenue Surprise Momentum on 25 Years of US Data
Companies that beat quarterly revenue estimates outperformed by 3.5% annually. We tested this on 25 years of US stocks: 11.55% CAGR vs 8.02% for SPY, with 85% down capture.

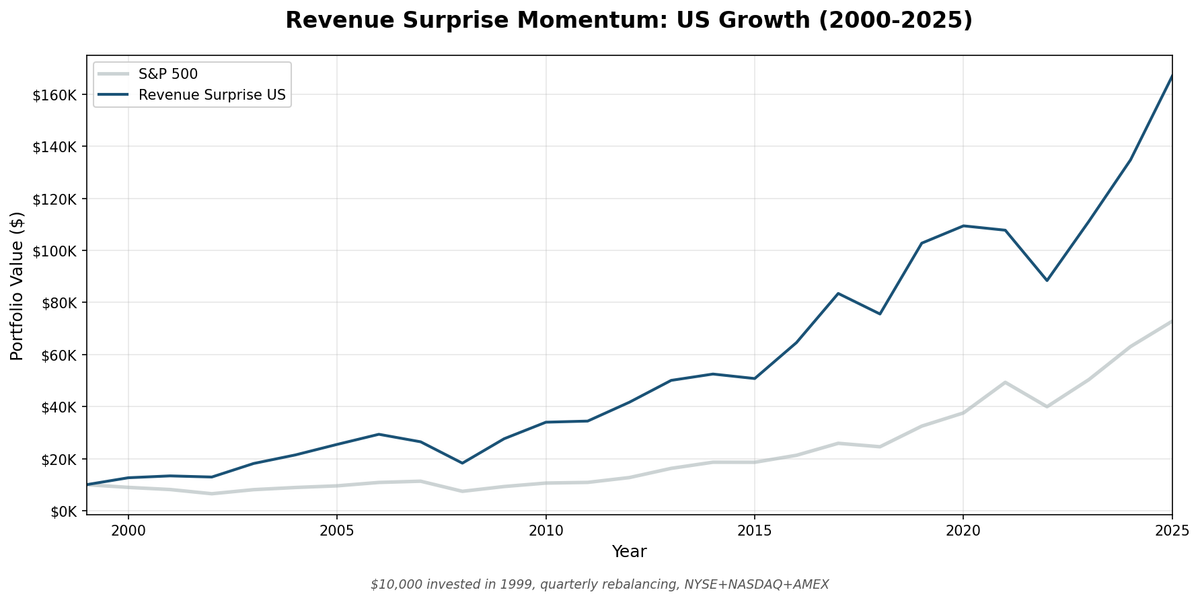
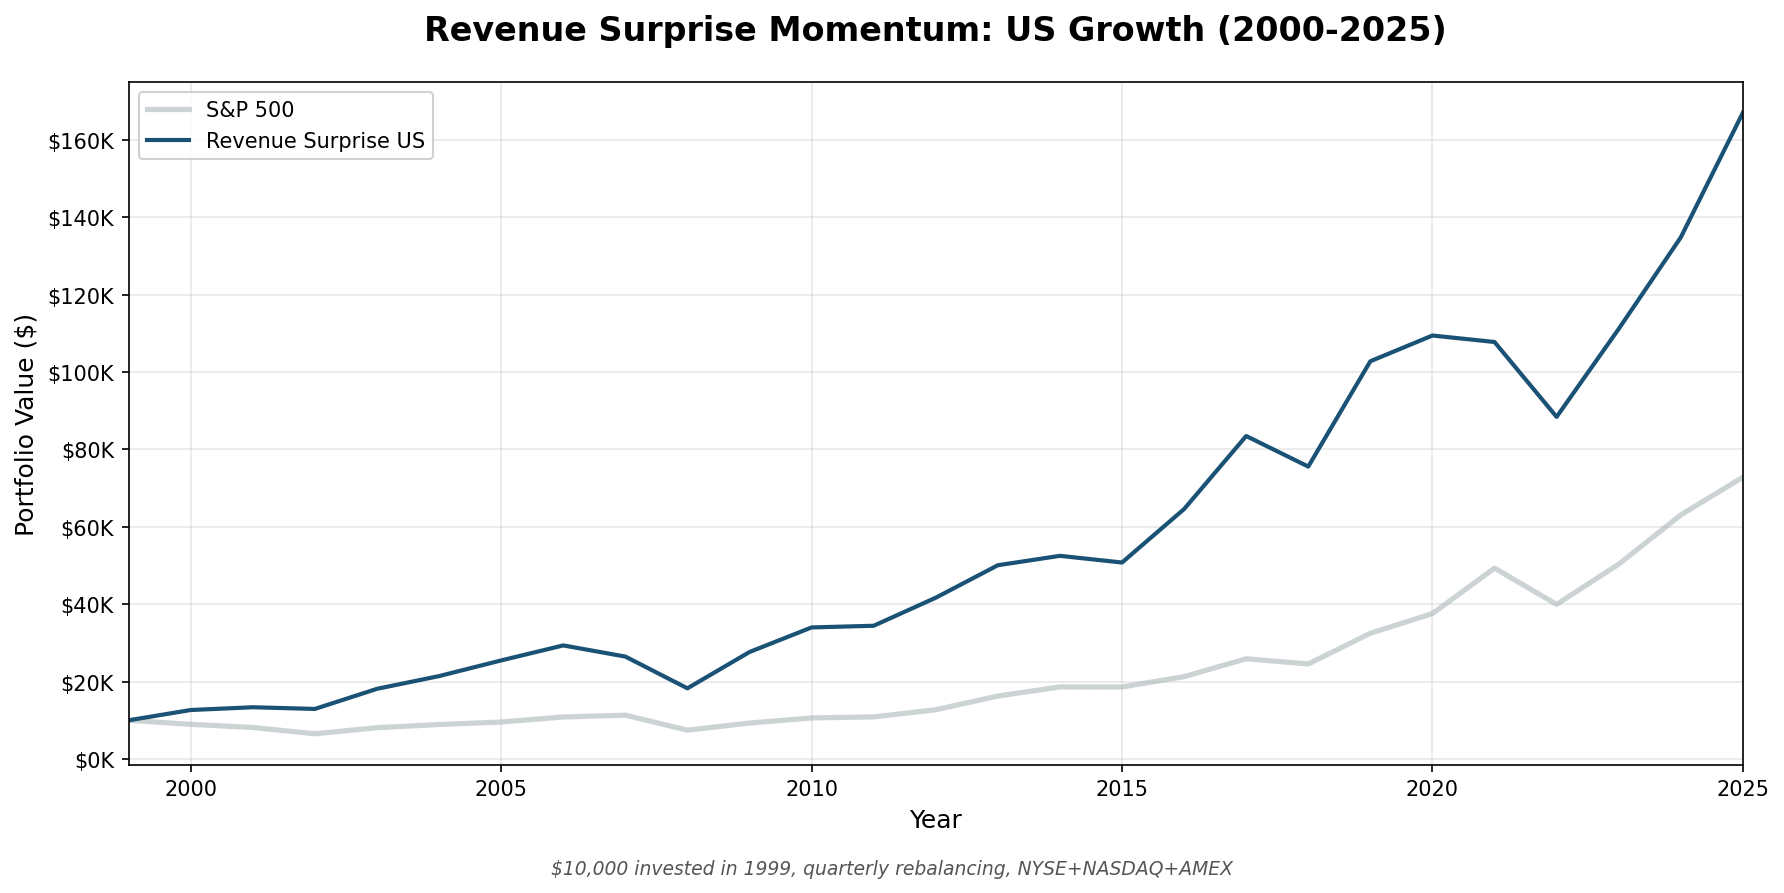
We ran a quarterly revenue surprise strategy (buying stocks that beat analyst revenue consensus estimates) on all US stocks (NYSE, NASDAQ, AMEX) from 2000 to 2025. The result: 11.55% annualized vs 8.02% for the S&P 500. A $10,000 investment grew to $167,028 vs $72,829 for the index. The strategy outperformed by 3.5 percentage points per year while capturing only 85% of the market's down moves.
Contents
- Method
- What is Revenue Surprise?
- What We Found
- Companies that beat revenue estimates outperform. Quarterly.
- Year-by-Year Returns
- When it works: fundamentals-driven markets
- When it struggles: multiple expansion environments
- Why the Signal Works
- How Much Does the Quarterly Rebalance Actually Buy You?
- Limitations
- What Changed Since March
- Takeaway
- Run This Screen Yourself
- Part of a Series
- References
The catch: one year, 2021, cost 32.8 percentage points against the index.
Data: FMP financial data warehouse, 2000–2025. Rerun August 2026 on refreshed data. Numbers differ from the March 2026 version of this post, see "What changed since March" below.
Method
Data source: Ceta Research (FMP financial data warehouse) Universe: NYSE + NASDAQ + AMEX, market cap > $2B USD Period: 2000–2025 (25.8 years, 103 quarterly periods) Rebalancing: Quarterly (January, April, July, October), equal weight Benchmark: S&P 500 Total Return (SPY) Cash rule: Hold cash if fewer than 10 stocks qualify Transaction costs: Size-tiered model (0.1–0.5% one-way based on market cap)
Financial data uses a 45-day lag on quarterly filings to prevent look-ahead bias. The revenue surprise signal is computed from fiscal quarter filings as they would have been available at each rebalance date.
All five filters must pass at each quarterly rebalance:
| Filter | Threshold | Why |
|---|---|---|
| Revenue surprise | 0% < surprise < 50% | Beats estimates, excludes outliers |
| ROE | > 8% | Quality filter: profitable on equity |
| Debt/Equity | < 2.5 | Reasonable leverage |
| Market cap | > $2B USD | Liquid, institutional-grade stocks |
| Qualifying stocks | ≥ 10 | Minimum for diversification |
From qualifying stocks, the portfolio holds the top 30 by highest revenue surprise percentage, equal weight.
What is Revenue Surprise?
Revenue surprise is the difference between a company's actual quarterly revenue and the analyst consensus estimate, expressed as a percentage:
Revenue Surprise = (Actual Revenue - Analyst Consensus) / |Analyst Consensus|
A company reporting $120B revenue against an analyst estimate of $115B has a +4.35% revenue surprise. A company missing at $110B has a -4.35% revenue surprise.
The academic basis comes from Jegadeesh & Livnat (2006), who found significant abnormal returns in the six months after an earnings announcement for stocks with large revenue surprises, measured after controlling for earnings surprises. The effect is distinct from earnings surprise (which can result from cost-cutting) because revenue beats require genuine demand growth, which is harder to manufacture and more predictive of future business trajectory.
Why we filter for 0-50% surprises: Surprises above 50% are usually data problems (currency mismatches between estimate and actual, restatements, or fiscal year mismatches). They don't represent real revenue beats.
Why quarterly, not annual: Jegadeesh & Livnat put the drift at roughly six months, levelling off after that. A quarterly rebalance keeps the portfolio inside that window; an annual one holds each selection well past it. Before transaction costs that's worth 2.15 percentage points a year over holding the same signal for a year. After costs it's worth almost nothing, because quarterly turnover is four times higher. The rebalancing section below has the full breakdown.
What We Found
Companies that beat revenue estimates outperform. Quarterly.
| Metric | Rev Surprise US | S&P 500 |
|---|---|---|
| CAGR | 11.55% | 8.02% |
| Total Return | 1,570% | 628% |
| Max Drawdown | -45.3% | -43.9% |
| Volatility | 20.50% | 16.68% |
| Sharpe Ratio | 0.466 | 0.361 |
| Sortino Ratio | 0.748 | 0.536 |
| Up Capture | 114.0% | n/a |
| Down Capture | 85.2% | n/a |
| Beta | 1.032 | n/a |
| Alpha (Jensen) | 3.35% | n/a |
| Cash Periods | 0 of 103 | n/a |
| Avg Stocks | 28.4 | n/a |
The asymmetry between up capture (114.0%) and down capture (85.2%) is the key result. The strategy captures more upside than the market and less downside. Over 25 years, that asymmetry compounds to a 1,570% total return vs the market's 628%.
That gap isn't a leverage artifact. Beta is 1.032, so the portfolio carries almost exactly market risk, and Jensen's alpha comes to 3.35% annually, close to the 3.54% raw excess. The outperformance survives risk adjustment.
The strategy carries more risk than the index on two measures: peak-to-trough, at -45.3% against -43.9%, and volatility, at 20.50% against 16.68%. The quarter-by-quarter down capture is much better than the market's, but the deepest single drawdown is slightly deeper. Lower participation in down quarters doesn't buy you a shallower worst case.
Year-by-Year Returns
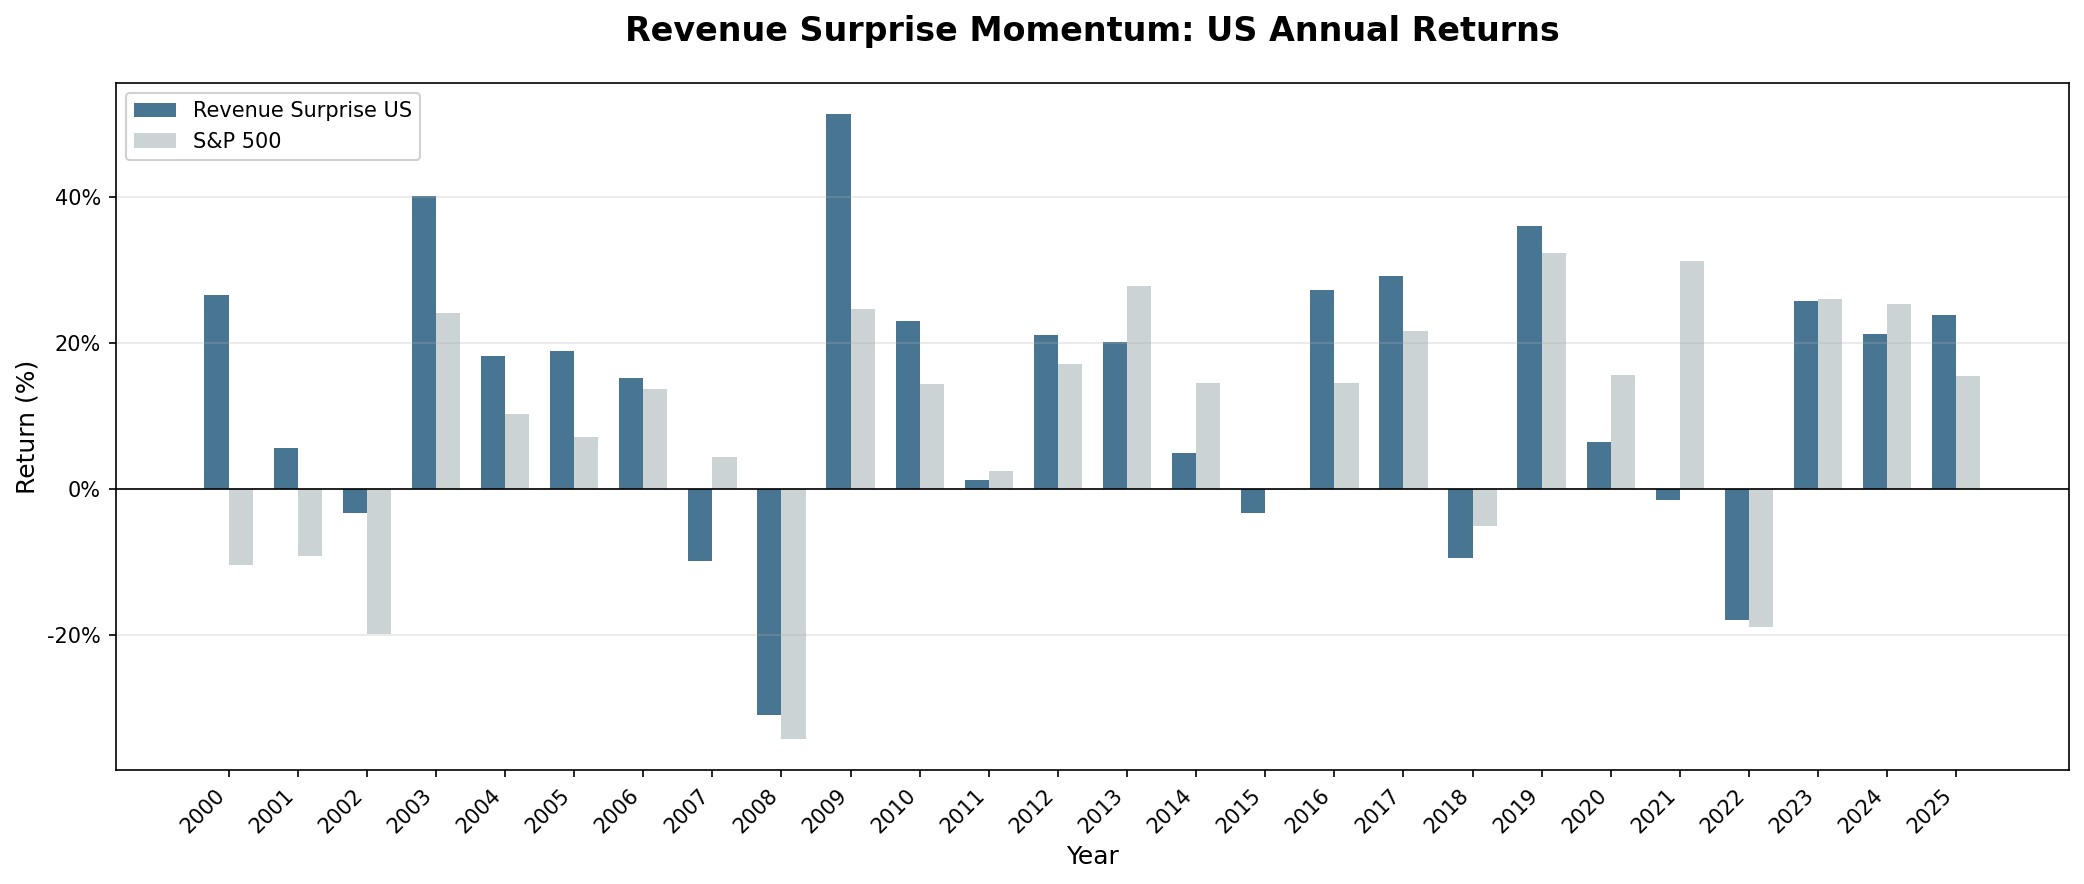
| Year | Rev Surprise | S&P 500 | Excess |
|---|---|---|---|
| 2000 | +26.5% | -10.5% | +37.0% |
| 2001 | +5.6% | -9.2% | +14.8% |
| 2002 | -3.3% | -19.9% | +16.7% |
| 2003 | +40.2% | +24.1% | +16.1% |
| 2004 | +18.1% | +10.2% | +7.9% |
| 2005 | +18.9% | +7.2% | +11.7% |
| 2006 | +15.2% | +13.7% | +1.6% |
| 2007 | -9.8% | +4.4% | -14.2% |
| 2008 | -31.0% | -34.3% | +3.3% |
| 2009 | +51.4% | +24.7% | +26.7% |
| 2010 | +23.0% | +14.3% | +8.7% |
| 2011 | +1.3% | +2.5% | -1.2% |
| 2012 | +21.1% | +17.1% | +4.0% |
| 2013 | +20.1% | +27.8% | -7.6% |
| 2014 | +4.8% | +14.5% | -9.6% |
| 2015 | -3.3% | -0.1% | -3.2% |
| 2016 | +27.2% | +14.4% | +12.8% |
| 2017 | +29.2% | +21.6% | +7.6% |
| 2018 | -9.5% | -5.2% | -4.3% |
| 2019 | +36.0% | +32.3% | +3.7% |
| 2020 | +6.5% | +15.6% | -9.2% |
| 2021 | -1.5% | +31.3% | -32.8% |
| 2022 | -18.0% | -19.0% | +1.0% |
| 2023 | +25.7% | +26.0% | -0.3% |
| 2024 | +21.3% | +25.3% | -4.0% |
| 2025 | +23.9% | +15.5% | +8.4% |
When it works: fundamentals-driven markets
The strategy's best periods were the early 2000s and the post-financial crisis recovery. In those environments, company fundamentals drove stock prices: companies with real demand growth and genuine revenue beats were rewarded.
The dot-com bust stands out. In 2000, as tech valuations collapsed, the revenue surprise screen selected companies with actual business, not story stocks. The portfolio returned +26.5% while the S&P 500 lost -10.5%. The same held through 2002: the strategy lost 3.3% while the index lost 19.9%.
2008 was similar. Revenue surprise stocks (companies with genuine demand growth) lost less than the market (-31.0% vs -34.3%). The screen kept selecting businesses with real sales momentum, which crashed less than highly valued growth names when credit froze. 2009 followed with a massive recovery: +51.4% vs +24.7%.
2016-2017 was another strong stretch, +12.8% excess in 2016 and +7.6% in 2017. The single best year remains 2000 at +37.0% excess, with 2009 second at +26.7%.
When it struggles: multiple expansion environments
The consistent failure mode is multiple expansion: periods when markets run on narrative and liquidity rather than fundamental results.
2013-2015 was a textbook case. The Federal Reserve's quantitative easing program kept rates near zero and sent capital into long-duration growth assets. Companies with high multiples and compelling narratives outperformed regardless of current revenue results. Revenue surprise stocks, often tilted toward companies with visible near-term demand rather than distant future promises, got left behind in each of those three years.
2021 is the worst year in the record: -1.5% against +31.3% for the index, an excess of -32.8%. The Fed's emergency stimulus inflated multiples to extremes. Companies with surging stock prices often showed neutral revenue surprises because their valuations had run so far ahead of fundamentals that meeting estimates was already priced in. Meanwhile companies outside tech that beat modest estimates had already had their modest rally.
2020 was a milder version of the same thing rather than a loss. COVID disrupted revenue across the economy in Q1-Q2, making the signal noisy, and the strategy still returned +6.5%. It just trailed a +15.6% index. Together 2020 and 2021 cost about 42 percentage points of cumulative excess.
2022 went the other way: the strategy lost 18.0% against the index's 19.0%. Rising rates hit everything, and companies with strong revenue weren't exempt. But they fell slightly less than the index, which, given the prior two years, was a relative win.
Why the Signal Works
Analysts anchor on recent results when making quarterly revenue estimates. A company that guided for flat revenue tends to get flat consensus estimates even when channel data, web traffic, credit card spending, or supplier orders suggest accelerating demand. When the actual result comes in above consensus, the market initially underreacts. Analysts update their models slowly, and investors who missed the early move start buying over the following weeks.
This behavior produces a drift: stocks that beat revenue estimates continue to outperform for roughly six months after the announcement, and the effect levels off after that. Jegadeesh & Livnat found analyst forecast errors decaying on the same schedule, which is what you would expect if slow analyst updating is what creates the drift in the first place.
Why revenue rather than earnings? Earnings can be manufactured through cost cuts, accounting choices, or one-time adjustments. A company can report earnings above estimates while actual business is deteriorating. Revenue is much harder to inflate. It requires customers actually buying more product. Revenue beats are more likely to reflect genuine demand growth.
How Much Does the Quarterly Rebalance Actually Buy You?
The March version of this post said annual rebalancing produced -5.1% excess and that quarterly timing was therefore non-negotiable. That comparison conflated two different changes, and on the refreshed data it doesn't hold. Here's the corrected version.
The clean test is to hold the same quarterly revenue surprise signal for a year instead of a quarter, changing only the holding period. Run that way, annual rebalancing returns 10.97% against 7.64% for the S&P 500 measured over the same January-to-January periods, an excess of +3.33%. Quarterly returns +3.54%. After costs the two are within a fifth of a percentage point of each other.
That looks like the drift story is wrong. It isn't, and the reason is transaction costs. Turn costs off and the two separate cleanly:
| Rebalance | Gross excess | Net excess | Cost drag |
|---|---|---|---|
| Quarterly | +6.08% | +3.54% | 2.55 pp |
| Annual | +3.93% | +3.33% | 0.60 pp |
Before costs, rebalancing quarterly is worth 2.15 percentage points a year over holding for a year. That's the drift Jegadeesh and Livnat describe, and it shows up exactly where the theory says it should. But quarterly rebalancing also trades four times as often, and the size-tiered cost model charges 2.55 points a year for the privilege against 0.60 for annual. Roughly nine tenths of the timing edge goes to the broker.
So the practical conclusion is close to the opposite of what we published in March. The drift is real and it does decay within months. It is also mostly not capturable at retail transaction costs. If you're running this with institutional execution, the quarterly version is meaningfully better. If you're paying the costs modelled here, annual rebalancing gets you almost the same net result with a quarter of the turnover and a quarter of the tax events.
What we can't reproduce is the original -5.1% figure. That test changed the signal as well as the holding period, computing surprise from full-year revenue against annual estimates rather than quarterly against quarterly. The current backtest doesn't implement that variant, so we're retracting the number rather than restating it.
Limitations
Point-in-time compliance. The 45-day filing lag is an approximation. Some companies file late, some early. This is a best-effort simulation, not a guaranteed clean cutoff.
Survivorship bias. Company profiles use current exchange listings. Delistings and bankruptcies aren't tracked through their terminal events, which biases results upward.
Transaction costs included. Results use size-tiered costs (0.1–0.5% one-way, charged on entry and exit). At quarterly turnover that's a large drag: the same backtest with costs switched off returns 14.10% CAGR instead of 11.55%, so costs cost 2.55 percentage points a year. Academic studies that report gross returns are not comparable to the numbers above.
Analyst estimate coverage. This strategy requires quarterly analyst revenue estimates. In the US, this data is comprehensive from the early 1990s. International markets have much sparser coverage, so the strategy is US-centric by data availability, not by design.
The paper we cite tests small caps harder than large ones. Jegadeesh & Livnat found the post-announcement drift on revenue surprises was significant for small firms but not statistically significant for large ones. For large firms the market did underreact inside the earnings-announcement window, just not strongly enough to show up in returns over the longer post-announcement period. Our screen applies a $2B floor, which sits on the large side of that split. The excess return measured here is a backtest result on its own terms; the paper does not predict it for this end of the market.
Funds in the universe. Closed-end funds and ETFs report investment income under revenue, so a revenue-ranked screen can pick them up as if they were operating companies. We checked: excluding funds and ETFs moves the US result from 11.55% to 11.44% CAGR, and excess from +3.54% to +3.43%. The $2B market cap floor and the ROE filter keep almost all of them out already.
25-year backtest, multiple regimes. The 2000–2025 period includes the tech bust, the financial crisis, QE, COVID, and rate normalization. Performance differed significantly across these regimes. The 2020-2021 period in particular shows what happens when the strategy faces extreme monetary conditions. No backtest guarantees future regime behavior.
What Changed Since March
We first published this in March 2026 and reran everything in August on refreshed data. Two things moved, and both are worth stating plainly.
The US numbers went up. CAGR 9.94% to 11.55%, excess +1.92% to +3.54%. We didn't change the screen, the filters, or the execution model. FMP revises and backfills its financial data over time, and a 25-year backtest re-run five months later picks up those revisions. Down capture improved from 93.1% to 85.2% and up capture from 110.3% to 114.0%. The tables and charts above are the August run.
The rebalancing claim was wrong. We said annual rebalancing produced -5.1% excess and quarterly was therefore mandatory. Re-measured properly, the two are nearly tied after costs. The rebalancing section above explains what we got wrong and what the corrected numbers are.
One thing didn't change: the shape of the year-by-year record. 2000, 2009 and 2016 remain the best years, 2021 remains by far the worst, and the strategy still lags in QE-driven markets.
Takeaway
Revenue surprise momentum works in the US equity market. 11.55% CAGR vs 8.02% for the S&P 500 over 25 years, with a favorable asymmetry between up and down capture and a Jensen alpha of 3.35%.
The mechanism is real: companies with genuine demand growth beat analyst estimates, the market underreacts initially, and the price drifts upward afterward. What we'd now qualify is how fast you have to act on it. See the rebalancing section above.
The risk is multiple expansion environments, where narrative and liquidity dominate fundamentals. 2020 and 2021 together cost about 42 percentage points in cumulative excess, almost all of it in 2021. If you're running this alongside other strategies, be aware that it underperforms in QE-driven bull markets, and that its worst drawdown (-45.3%) is slightly deeper than the index's.
We tested this across 9 exchanges. The US is the only one where the strategy produces a positive excess with a Sharpe ratio worth quoting. See the full comparison.
Run This Screen Yourself
The current revenue surprise screen (US stocks, most recent quarterly filing):
WITH rev_surprise AS (
    SELECT i.symbol,
           i.revenue AS actual_revenue,
           a.revenueAvg AS est_revenue,
           (i.revenue - a.revenueAvg) / ABS(a.revenueAvg) AS rev_surprise_pct,
           CAST(i.date AS DATE) AS filing_date,
           ROW_NUMBER() OVER (PARTITION BY i.symbol ORDER BY i.dateEpoch DESC) AS rn
    FROM income_statement i
    JOIN analyst_estimates a ON i.symbol = a.symbol
        AND a.period = 'quarter'
        AND ABS(CAST(i.dateEpoch AS BIGINT) - CAST(a.dateEpoch AS BIGINT)) <= 7776000
    WHERE i.period IN ('Q1', 'Q2', 'Q3', 'Q4')
      AND i.revenue IS NOT NULL AND i.revenue > 0
      AND a.revenueAvg IS NOT NULL AND a.revenueAvg > 0
)
SELECT rs.symbol, p.companyName, p.sector,
    ROUND(rs.rev_surprise_pct * 100, 2) AS rev_surprise_pct,
    ROUND(k.returnOnEquityTTM * 100, 2) AS roe_pct,
    ROUND(f.debtToEquityRatioTTM, 2) AS de_ratio,
    ROUND(p.marketCap / 1e9, 2) AS mktcap_b,
    rs.filing_date
FROM rev_surprise rs
JOIN profile p ON rs.symbol = p.symbol
JOIN key_metrics_ttm k ON rs.symbol = k.symbol
JOIN financial_ratios_ttm f ON rs.symbol = f.symbol
WHERE rs.rn = 1
  AND rs.rev_surprise_pct > 0
  AND rs.rev_surprise_pct < 0.5
  AND k.returnOnEquityTTM > 0.08
  AND (f.debtToEquityRatioTTM IS NULL OR f.debtToEquityRatioTTM < 2.5)
  AND p.marketCap > 2000000000
  AND p.exchange IN ('NYSE', 'NASDAQ', 'AMEX')
  AND p.isFund = false
  AND p.isEtf = false
  AND p.isActivelyTrading = true
QUALIFY ROW_NUMBER() OVER (PARTITION BY p.companyName
                           ORDER BY p.averageVolume DESC) = 1
ORDER BY rs.rev_surprise_pct DESC
LIMIT 30
Run this screen on Ceta Research
The full backtest code (Python + DuckDB) is on GitHub.
Part of a Series
This post is part of our Revenue Surprise global exchange comparison:
- Revenue Surprise Momentum: 9-Exchange Global Comparison (US is the only market with sufficient analyst estimate data)
References
- Jegadeesh, N. & Livnat, J. (2006). "Revenue Surprises and Stock Returns." Journal of Accounting and Economics, 41(1–2), 147–171. (Core paper establishing revenue surprise momentum)
- Bernard, V. & Thomas, J. (1989). "Post-Earnings-Announcement Drift: Delayed Price Response or Risk Premium?" Journal of Accounting Research, 27, 1–36. (PEAD foundation, related to revenue surprise drift)
- Sloan, R. (1996). "Do Stock Prices Fully Reflect Information in Accruals and Cash Flows About Future Earnings?" The Accounting Review, 71(3), 289–315. (Context: accrual anomaly, fundamental surprise signals)
Data: Ceta Research, FMP financial data warehouse. Universe: NYSE + NASDAQ + AMEX. Quarterly rebalance, equal weight, transaction costs included, 2000–2025.
Past performance does not guarantee future results. This is educational content, not investment advice.

