
Rising Dividend Yield Across 15 Exchanges: India Wins, Japan Surprises, Small Markets Struggle
We ran the same rising dividend yield screen on 15 global exchanges from 2000 to 2025. India produced 13.44% CAGR with the lowest drawdown. Five exchanges beat SPY. The signal works where dividend growth is a deliberate management decision.

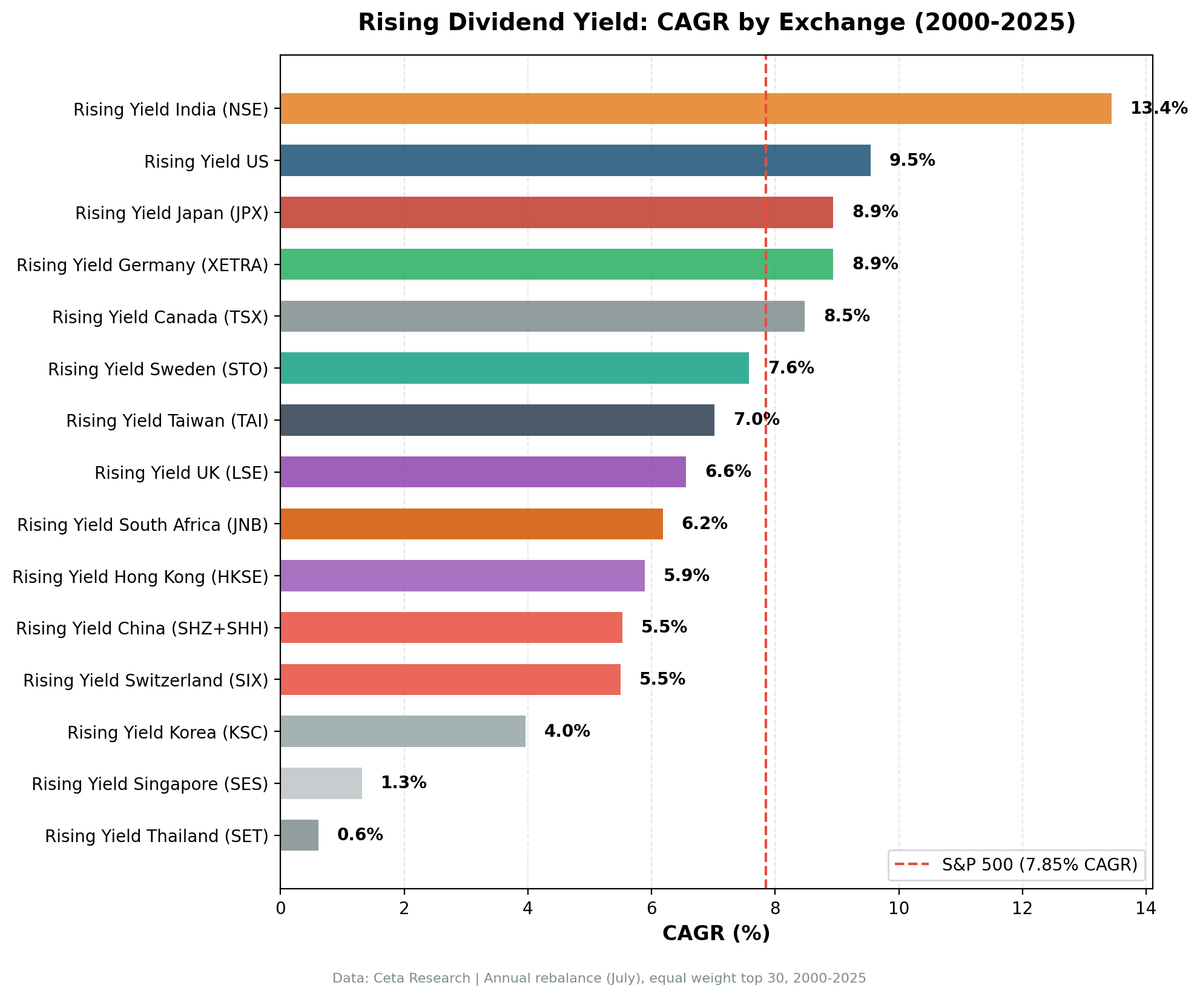
We ran the same rising dividend yield screen on 15 exchanges from 2000 to 2025. India produced 13.44% CAGR with the lowest drawdown in the study. Five exchanges beat the S&P 500 (cross-currency comparison). The strategy works where companies raise dividends deliberately. It breaks down where the signal can't find enough qualifying stocks.
Contents
- Method
- Full Results: 15 Exchanges
- India: Best by Every Metric That Matters
- Japan: The Risk-Adjusted Surprise
- Where the Signal Works: Dividend Culture Markets
- Taiwan: The Conservative Investor's Pick
- Where It Doesn't Work
- Limitations
- Takeaway
- Part of a Series
- References
Data: FMP financial data warehouse, 2000–2025. Updated March 2026.
Method
The screen is the same everywhere: 3 consecutive fiscal years of rising dividend yield, where the increase was driven by DPS growth (not falling prices). ROE above 10%, payout ratio below 75%. Top 30 by yield expansion over the trailing 2 years, equal-weighted, rebalanced annually each July. Size-tiered transaction costs (0.1% for large caps, 0.3% for mid caps, 0.5% for small caps, one-way).
| Parameter | Value |
|---|---|
| Signal | 3 consecutive FY of rising dividendYield via DPS growth |
| Filters | ROE > 10%, Payout < 75%, exchange-specific market cap thresholds |
| Selection | Top 30 by 2-year yield expansion, equal weight |
| Rebalancing | Annual (July), 45-day data lag |
| Benchmark | S&P 500 Total Return (SPY, USD) |
| Period | 2000-2025 |
| Code | github.com/ceta-research/backtests |
Returns are in local currency. SPY is the cross-exchange benchmark in USD. Currency effects are not modeled.
Australia (ASX) and Brazil (SAO) were excluded. FMP's split-adjusted prices for these two exchanges contain fatal errors (hundreds of symbols with price ratios above 1,000x) that produce artifact returns. Every other exchange we ran, including Thailand, is reported below.
Full methodology: METHODOLOGY.md
These benchmarks leave dividends out. Portfolio returns here use dividend-adjusted prices, so they include dividends. Most of the indices we measure against do not. The ASX 200, FTSE 100, Hang Seng, KOSPI, Nikkei 225, OMX Stockholm 30, SET Index, SMI, SSE Composite, STI, Sensex, TAIEX and TSX Composite are price indices, so excess return against them is overstated by roughly the local dividend yield, which has run between about 1.3% and 4% in these markets. Those comparisons are like for like: the S&P 500 figure runs through SPY, which is dividend-adjusted; the DAX is a performance index; the Bovespa reinvests dividends. Treat any edge thinner than the local yield as a tie rather than a win.
Full Results: 15 Exchanges
Sorted by CAGR descending. SPY benchmark: 7.85% CAGR (cross-currency comparison).
| Exchange | CAGR | Excess vs SPY | Sharpe | MaxDD | Cash% | Avg Stocks |
|---|---|---|---|---|---|---|
| India (NSE) | 13.44% | +5.59% | 0.289 | -11.71% | 28% | 26.7 |
| US (NYSE+NAS+AMEX) | 9.54% | +1.69% | 0.392 | -28.42% | 0% | 26.5 |
| Japan (JPX) | 8.94% | +1.09% | 0.430 | -41.15% | 16% | 26.6 |
| Germany (XETRA) | 8.94% | +1.09% | 0.392 | -38.73% | 0% | 20.6 |
| Canada (TSX) | 8.48% | +0.63% | 0.369 | -28.45% | 0% | 22.2 |
| Sweden (STO) | 7.58% | -0.27% | 0.276 | -45.89% | 20% | 23.1 |
| Taiwan (TAI) | 7.02% | -0.83% | 0.427 | -16.24% | 32% | 27.8 |
| UK (LSE) | 6.56% | -1.29% | 0.139 | -40.80% | 0% | 14.5 |
| South Africa (JNB) | 6.18% | -1.67% | -0.200 | -33.81% | 32% | 13.9 |
| Hong Kong (HKSE) | 5.89% | -1.96% | 0.146 | -33.97% | 12% | 23.8 |
| China (SHZ+SHH) | 5.53% | -2.32% | 0.079 | -53.52% | 0% | 24.3 |
| Switzerland (SIX) | 5.50% | -2.35% | 0.283 | -37.57% | 0% | 13.9 |
| Korea (KSC) | 3.96% | -3.89% | 0.059 | -26.48% | 40% | 24.6 |
| Singapore (SES) | 1.32% | -6.53% | -0.092 | -36.09% | 32% | 9.6 |
| Thailand (SET) | 0.61% | -7.24% | -0.099 | -55.92% | 24% | 21.3 |
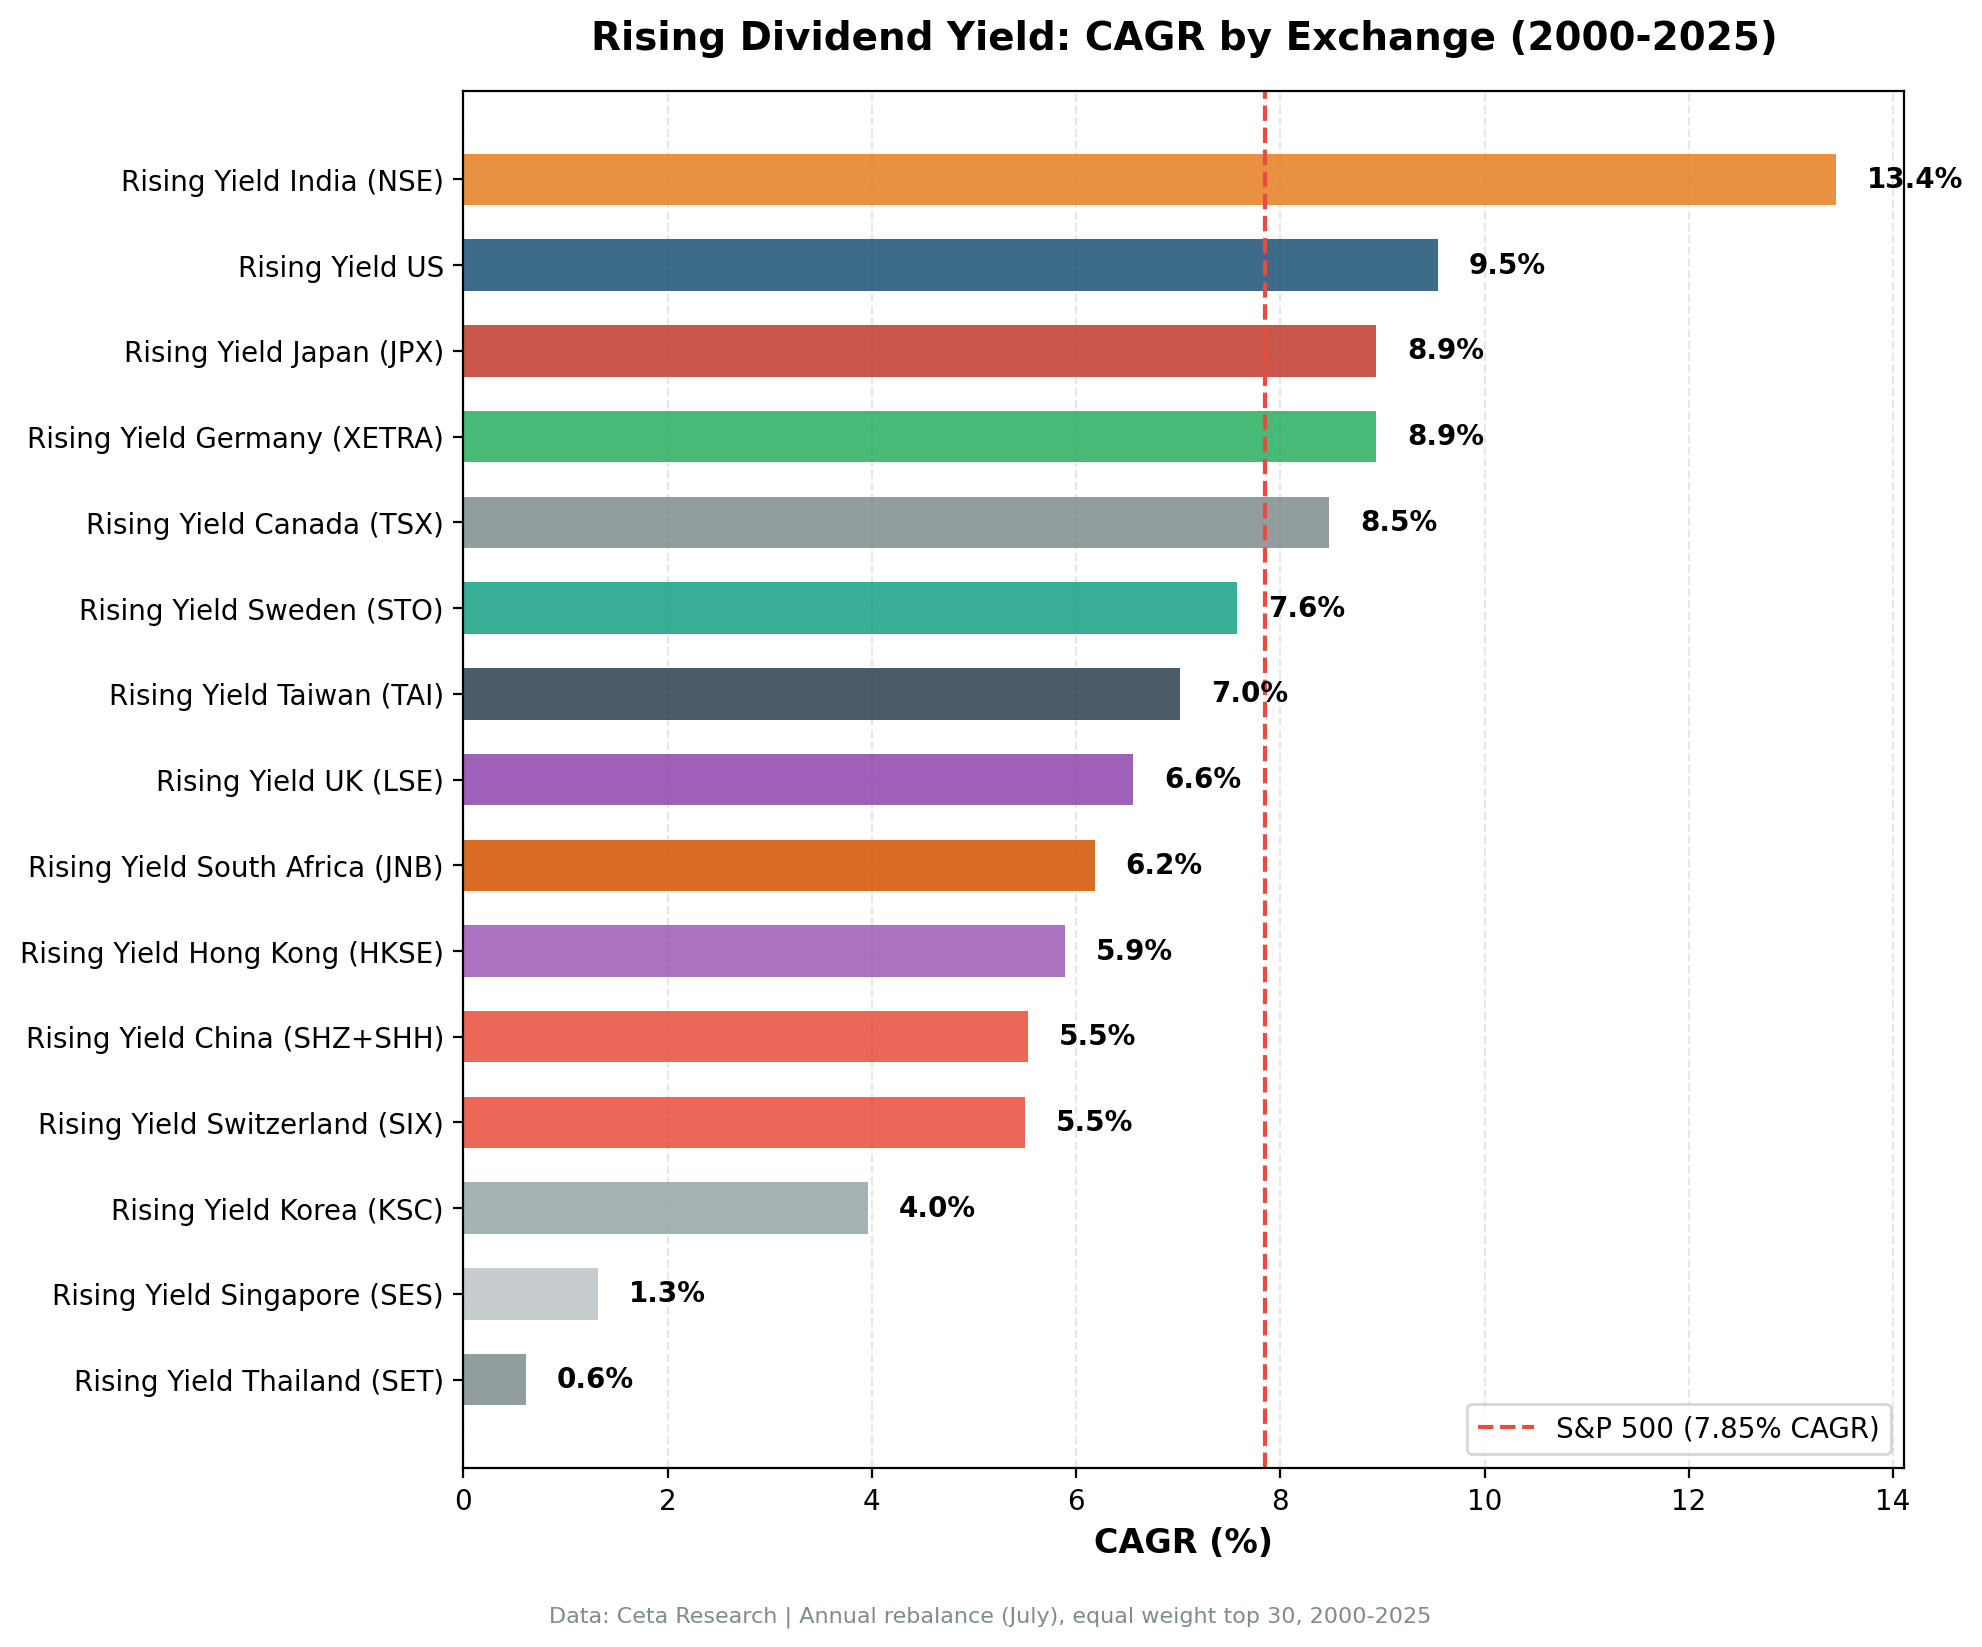
Note on local benchmarks: The table above uses SPY as a cross-market benchmark for comparison. Against local benchmarks, many markets show stronger alpha: Germany +3.90% vs DAX, Canada +4.53% vs TSX, Japan +5.63% vs Nikkei, UK +5.34% vs FTSE 100. India's +5.59% vs SPY drops to +1.38% vs Sensex (12.06% CAGR). The SPY comparison enables cross-market ranking, but local benchmarks provide the honest alpha measurement.
India: Best by Every Metric That Matters
India didn't just win on returns. It won on risk.
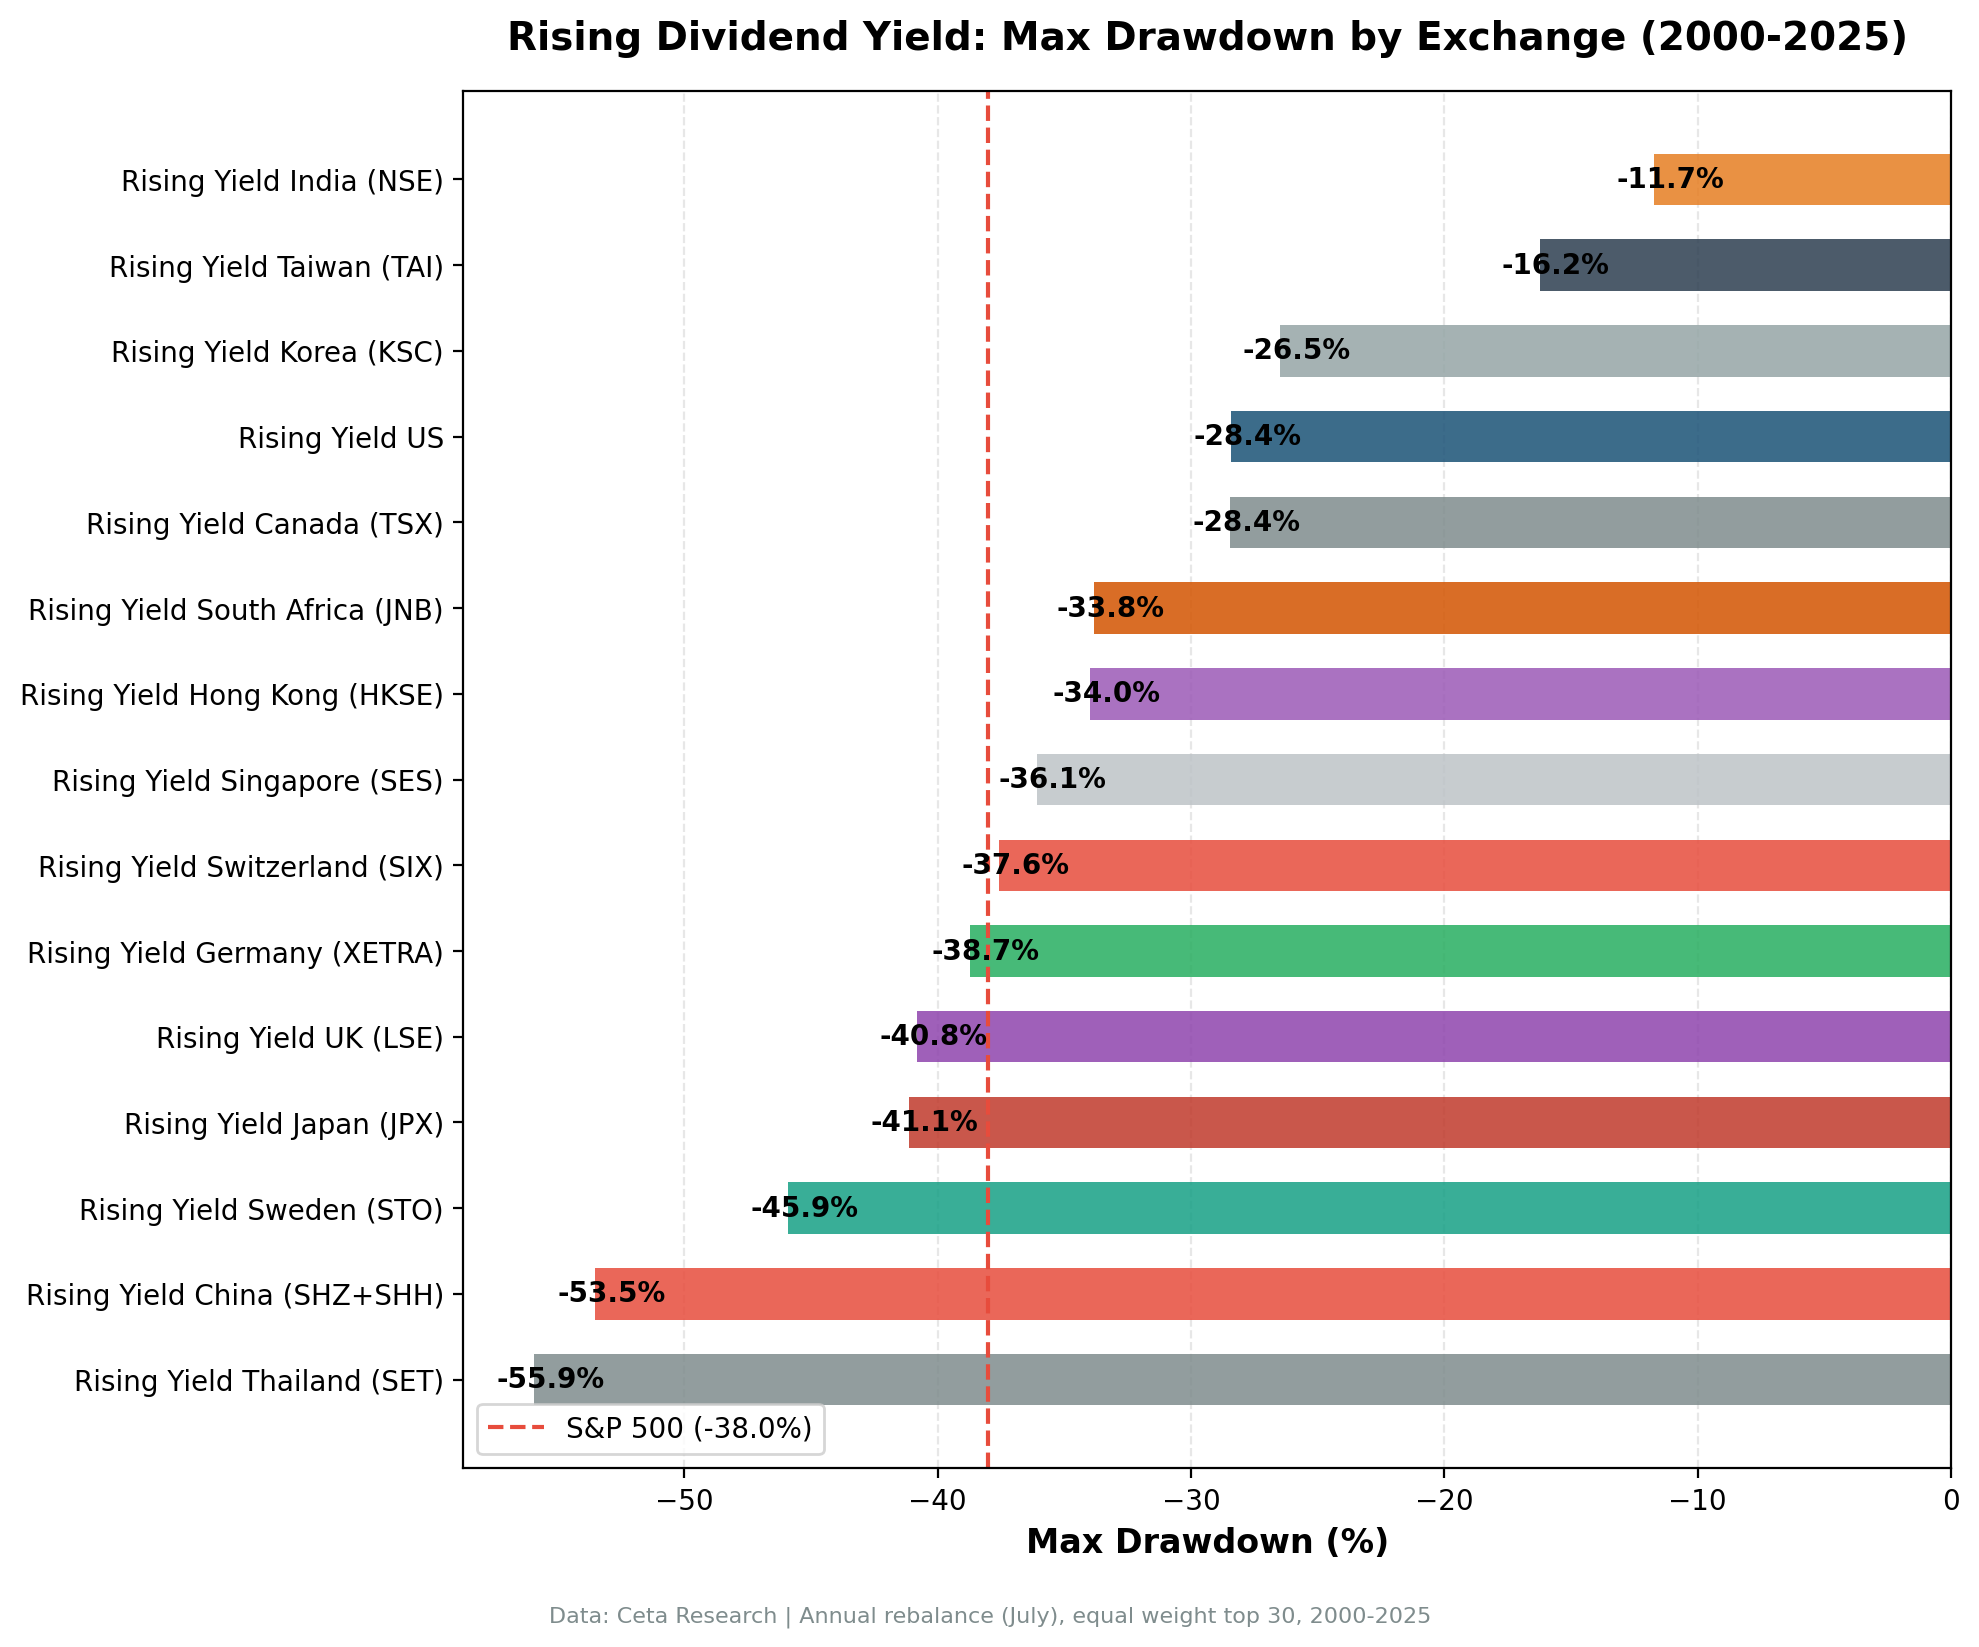
13.44% CAGR with a -11.71% max drawdown gives India a Calmar ratio of 1.147, the best in the study by a wide margin. Taiwan is next at 0.43, then the US at 0.34. India delivered more than double the return per unit of drawdown risk of any other market.
The 28% cash rate is real. The screen couldn't find 10 qualifying stocks in about 7 of 25 periods. That cash drag pulled the CAGR down from what a fully invested portfolio would have produced. When the screen was invested, it compounded aggressively.
Indian companies that pass this filter tend to be IT exporters, private banks, and consumer staples firms with founder-family governance. They raise dividends because they can. Cash flows are real, payout ratios are conservative, and the dividend growth signal carries genuine information about future earnings.
Japan: The Risk-Adjusted Surprise
Japan posted the highest Sharpe ratio in the entire study at 0.43. It also delivered the highest Sortino at 1.168, meaning its downside volatility was unusually low relative to returns. The 8.94% CAGR beats SPY outright, and the path to get there was smoother than the -41.15% max drawdown suggests. That drawdown came from one event (the 2008 crisis), not a pattern of repeated losses. The screen beat the Nikkei in 72% of years.
The Abenomics-era corporate governance reforms changed how Japanese companies think about dividends. Starting around 2013, the Tokyo Stock Exchange pressured companies to return capital to shareholders. Dividend growth became a signal of management alignment, not just a payout decision. The screen captured that structural shift. Pre-2013, Japan was a mediocre dividend market. Post-2013, it produced some of the strongest rising-yield candidates globally.
26.6 average stocks per period keeps Japan's universe deep enough for the screen to work consistently. The 16% cash rate, concentrated in early years, barely dented the overall result.
Where the Signal Works: Dividend Culture Markets
Five exchanges beat SPY. All five share a trait: deep, established dividend-paying traditions.
| Exchange | Excess vs SPY | Cash% | What's driving it |
|---|---|---|---|
| India | +5.59% | 28% | Founder-family governance, conservative payouts, real FCF |
| US | +1.69% | 0% | Deepest universe, 27 stocks every year, steady alpha |
| Japan | +1.09% | 16% | Post-Abenomics governance reforms, rising payout culture |
| Germany | +1.09% | 0% | Mittelstand culture, dividends as fixed commitment |
| Canada | +0.63% | 0% | Pipelines, utilities, REITs. Stable coverage, low vol |
Zero cash periods in the US, Germany, and Canada means the screen always found enough qualifying dividend growers. These markets produce a steady supply of companies that raise dividends backed by earnings growth.
Sweden (7.58% CAGR) and Taiwan (7.02%) came closest among the markets that missed, each within a point of SPY. Every market that cleared SPY did it on the back of a deep, reliable supply of dividend growers, and Japan's Sharpe (0.43) is the highest in the study.
Taiwan: The Conservative Investor's Pick
Taiwan won't grab headlines with 7.02% CAGR. But look at the risk profile: -16.24% max drawdown (second only to India) and a 0.427 Sharpe that ranks second in the study, behind only Japan.
The 32% cash rate tells the story. The screen went conservative often, sitting in cash when it couldn't find enough rising-yield stocks. That cash drag cost returns but preserved capital. When the screen was invested, it selected semiconductor supply chain companies and financials with genuinely growing dividends.
For a mandate where drawdown control matters more than raw return, Taiwan's implementation is compelling. A -16% worst case over 25 years is exceptional for any equity strategy.
Where It Doesn't Work
Ten of 15 exchanges trailed SPY (cross-currency comparison). That's honest. Not every signal works everywhere.
Small markets struggle the most. Singapore (1.32% CAGR, -6.53% vs SPY) is the worst performer among the mid-size markets. With only 9.6 average stocks per period and 32% cash, the exchange simply doesn't have enough qualifying dividend growers. Korea (3.96%, -3.89% vs SPY, 40% cash) has the same problem. The signal is fine. The universe is too thin.
Thailand is the weakest market. 0.61% CAGR with a -55.92% max drawdown, the worst on both counts. The screen finds stocks, but Thai dividend payers didn't hold up through repeated crises. This market is effectively untradeable for the signal.
China's dividend culture is different. 5.53% CAGR with -53.52% max drawdown. Chinese state-owned enterprises often raise dividends as policy, not because cash flows support it. The rising yield signal carries less information when dividend decisions are disconnected from business fundamentals.
The UK vs SPY comparison is misleading. The LSE returned 6.56% CAGR vs SPY's 7.85%, appearing to underperform by -1.29%. But the FTSE 100 itself returned only 1.23% CAGR. Against its local benchmark, the strategy delivered +5.34% excess. The UK's structural issues (commodity-heavy sectors) affected both the strategy and the benchmark. As a UK stock selector, the strategy works. As a global allocation, it lags because the UK market underperformed globally.
Hong Kong, Switzerland, Taiwan: Similar story. These markets trail SPY in cross-currency terms, but beat their local benchmarks (Hong Kong +4.25% vs Hang Seng, Switzerland +3.76% vs SMI, Taiwan +2.93% vs TAIEX). The strategy works as a local selector but the underlying markets underperformed USD-based global indices.
Limitations
Currency effects. Every exchange reports in local currency. India's 13.44% CAGR would shrink by roughly 2.5-3% per year if converted to USD (the rupee lost about 45% of its USD value over 25 years, from roughly 46 to 84 per dollar). Even adjusted, India still beats SPY. Japan's 8.94% would likely fall below SPY after yen depreciation. Hong Kong's HKD peg to USD makes that comparison clean.
Market structure differences. Transaction costs, liquidity, and trading hours vary. The size-tiered cost model adjusts for this, but it can't capture everything. Bid-ask spreads in Singapore or Korea are wider than in the US.
Data quality varies. FMP's dividend data coverage is strongest for the US, Europe, and Japan. Emerging markets have more gaps, and Australia and Brazil were dropped entirely for fatal split-adjustment errors. The 28% cash rate in India partially reflects periods where data was insufficient, not just where the signal failed.
Survivorship bias. The backtest uses point-in-time data to the extent available, but delisted companies with missing terminal returns could bias results upward in some markets.
Takeaway
The rising dividend yield screen works, but it's selective. Five of 15 exchanges beat SPY in cross-currency terms over 25 years. Against local benchmarks, 11 of 15 beat their home market index. The common thread: markets where dividend growth is a deliberate management decision backed by real earnings.
India is the standout. Best return (13.44% CAGR), best drawdown (-11.71%), best Calmar (1.147). The combination of a deep dividend culture, conservative payout norms, and founder-managed companies makes the rising yield signal exceptionally informative.
Japan is the risk-adjusted surprise. Corporate governance reforms turned a mediocre dividend market into one that produces the highest Sharpe (0.43) and Sortino (1.168) in the study. Against the Nikkei's 3.31% CAGR, the strategy's +5.63% excess is substantial.
The practical takeaway: this screen is pickier than a simple high-yield or dividend coverage strategy. It needs 3 consecutive years of improvement driven by actual dividend growth. Markets that produce enough qualifying stocks (US, Germany, Canada, Japan) deliver consistent results. Markets where the universe is too thin (Singapore, Korea) or where dividend decisions are disconnected from fundamentals (China) don't.
If you want broad global exposure to dividend growers, start with the markets that beat SPY and stayed fully invested: the US, Germany, and Canada. If you want the best single-market implementation, the data says India.
Part of a Series
This is the global comparison post. Individual exchange analyses with year-by-year breakdowns, annual return tables, and charts:
- Rising Dividend Yield on US Stocks (NYSE + NASDAQ + AMEX) - 9.54% CAGR, zero cash periods, the consistent baseline
- Rising Dividend Yield on Indian Stocks (NSE) - 13.44% CAGR, -11.71% drawdown, the standout
- Rising Dividend Yield on German Stocks (XETRA) - 8.94% CAGR, +3.90% vs DAX, Mittelstand dividend culture
- Rising Dividend Yield on Japanese Stocks (JPX) - 8.94% CAGR, +5.63% vs Nikkei, highest Sharpe
- Rising Dividend Yield on UK Stocks (LSE) - 6.56% CAGR, +5.34% vs FTSE 100
- Rising Dividend Yield on Canadian Stocks (TSX) - 8.48% CAGR, +4.53% vs TSX, zero cash periods
References
- Lintner, J. (1956). "Distribution of Incomes of Corporations Among Dividends, Retained Earnings, and Taxes." American Economic Review, 46(2), 97-113.
- Fama, E. & French, K. (1988). "Dividend Yields and Expected Stock Returns." Journal of Financial Economics, 22(1), 3-25.
- Arnott, R. & Asness, C. (2003). "Surprise! Higher Dividends = Higher Earnings Growth." Financial Analysts Journal, 59(1), 70-87.
Data: Ceta Research, FMP financial data warehouse. 15 exchanges, 2000-2025, annual July rebalance, equal weight (top 30 by 2-year yield expansion), ROE > 10%, payout < 75%, exchange-specific market cap thresholds. Returns in local currency. Cross-market benchmark: S&P 500 Total Return (SPY, USD). Local benchmark comparisons available in individual market posts. Past performance does not guarantee future results. This is research, not investment advice.

