
Sector-Adjusted Momentum on US Stocks: 9.46% CAGR, But the Edge Is Beta, Not Alpha
Sector-adjusted momentum on US stocks returned 9.46% annually from 2000-2025 vs the S&P 500's 8.02%. The 1.45-point raw edge is pure beta: lower Sharpe, deeper drawdowns, and the worst down capture in the study. Risk-adjusted, the index wins.

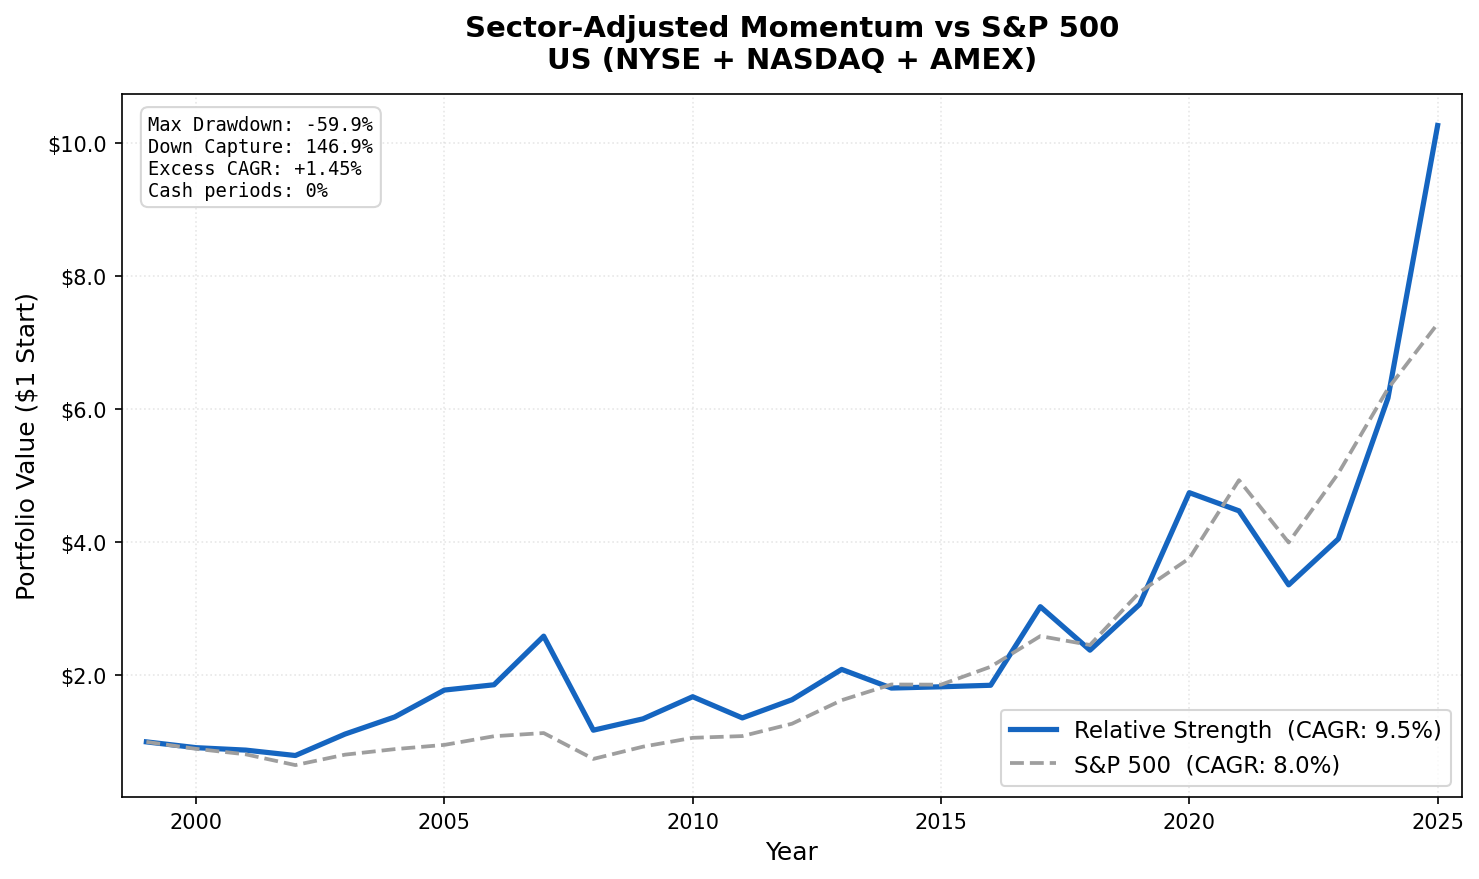
We backtested the Sector-Adjusted Momentum strategy on US stocks (NYSE, NASDAQ, AMEX) from 2000 to 2025. The strategy buys stocks outperforming their own sector peers, stripping out sector-level trends to isolate company-specific momentum. The result: 9.46% annually versus the market's 8.02%. That looks like a 1.44 percentage point annual win. It isn't. Once you adjust for risk, the edge disappears.
Contents
- Method
- Performance
- Why the Outperformance Is Beta, Not Alpha
- What This Means for the Moskowitz-Grinblatt Finding
- Comparison to Raw Momentum in the US
- The Current Screen
- By the Numbers
- Academic Basis
The US is the most instructive case in a 14-exchange study. Zero cash periods, 29.7 average stocks, 8.7 average active sectors. The signal fires every quarter without fail. It beats the S&P 500 on raw return. But it does so by behaving like a leveraged version of the index, not by picking better stocks. This page shows the difference between return and alpha.
Data: FMP financial data warehouse, 2000-2025. Updated June 2026.
Method
Data source: Ceta Research (FMP financial data warehouse) Universe: NYSE + NASDAQ + AMEX stocks, market cap > $1B USD Period: 2000-2025 (25 years, 103 quarterly periods) Rebalancing: Quarterly (January, April, July, October), equal weight Benchmark: S&P 500 Total Return (SPY), 8.02% CAGR over this period Transaction costs: 0.1% one-way (large-cap tier for US market) Cash rule: Hold cash if fewer than 10 stocks qualify at a rebalance date
Signal construction: 1. Compute each stock's 12-month return, skipping the most recent month (12M-1M per Jegadeesh & Titman 1993) 2. Compute the equal-weighted sector average across qualifying US stocks 3. Relative strength = stock return minus sector average return 4. Buy top 30 by relative strength, equal weight
Data quality guards: Minimum price $1.00, maximum raw signal 500% (filters split-adjustment artifacts), maximum single-period return 200%, and a price-oscillation filter that removes phantom holiday rows and broken split adjustments.
Zero of 103 quarters were cash periods. The US has the largest, deepest equity market in the dataset.
Performance
| Metric | Strategy | SPY |
|---|---|---|
| CAGR (2000-2025) | 9.46% | 8.02% |
| Excess CAGR | +1.45% | N/A |
| Sharpe Ratio | 0.248 | 0.361 |
| Max Drawdown | -59.90% | -43.86% |
| Annualized Volatility | 30.11% | 16.68% |
| Up Capture | 147.5% | 100% |
| Down Capture | 146.9% | 100% |
| Cash Periods | 0/103 (0%) | N/A |
| Avg Stocks Held | 29.7 | N/A |
| Avg Active Sectors | 8.7 | N/A |
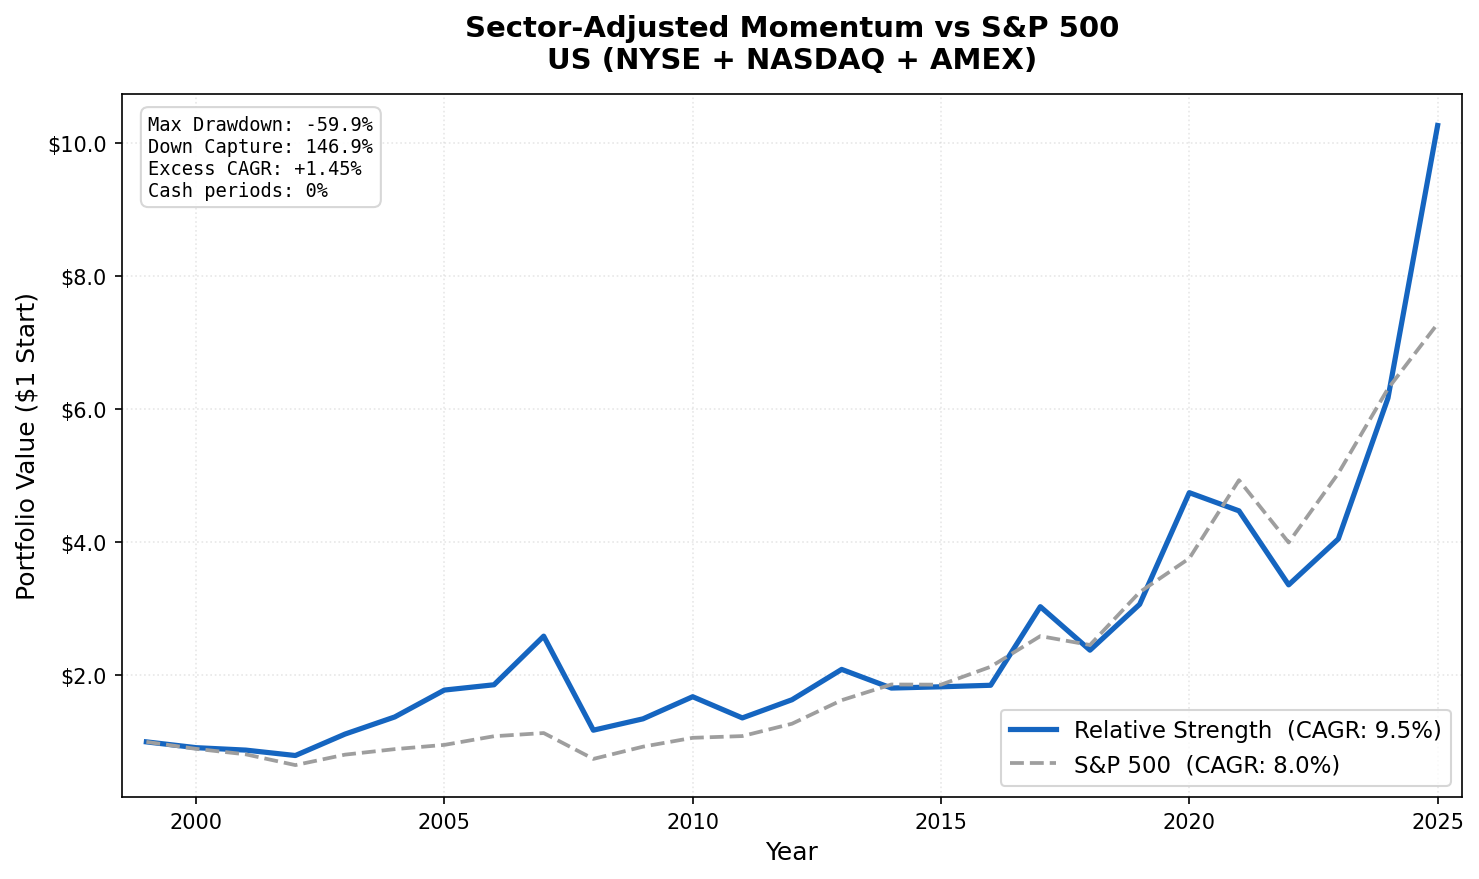
A dollar invested in the strategy in January 2000 grew to $10.26 by the end of 2025. The same dollar in SPY grew to $7.28. The strategy ends ahead. But look at how it got there: 30.1% annualized volatility against the market's 16.7%, a 59.9% max drawdown against 43.9%, and up and down capture both near 147%. The portfolio captures about one and a half times the market's moves in both directions. That is the signature of leverage, not stock selection.
Why the Outperformance Is Beta, Not Alpha
The headline number is misleading on its own. Three figures explain what's really happening.
Beta is 1.46. The portfolio moves roughly 1.46 times as much as the S&P 500. In a 25-year stretch where the market compounded at 8% a year, a 1.46-beta tilt mechanically earns more than the market, because it amplifies a rising market. That's not skill. It's exposure.
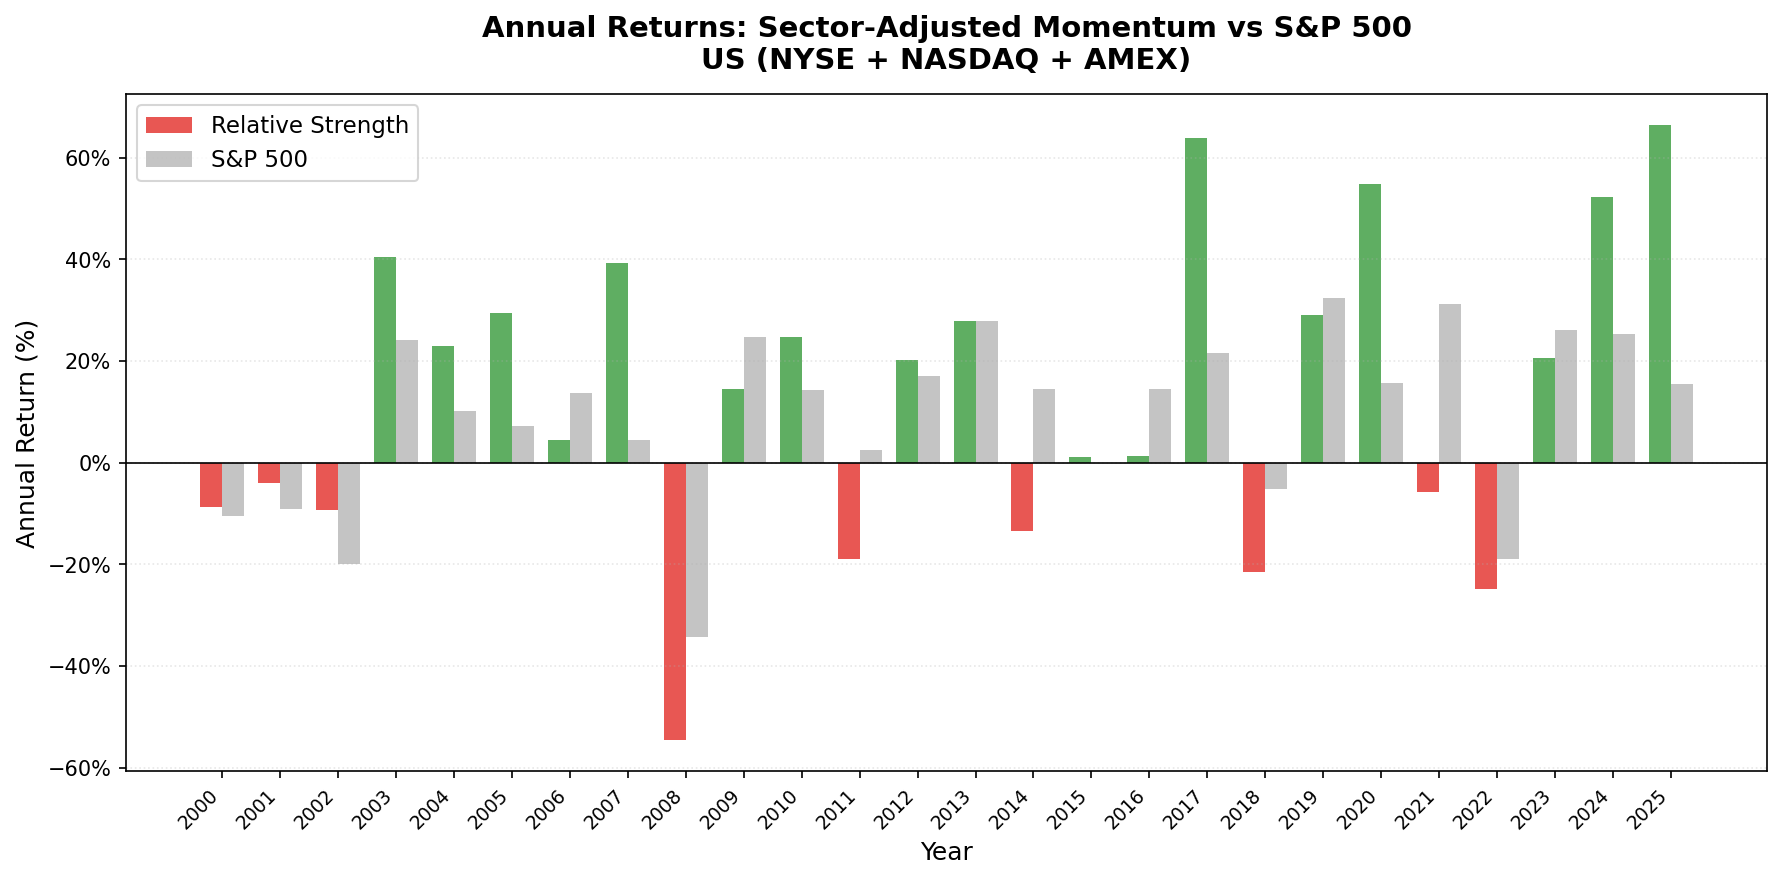
Up capture and down capture are both about 147%. The portfolio gains 147 cents for every dollar the market gains, and loses 147 cents for every dollar it loses. A genuine alpha source would capture more on the upside than the downside. This captures the same multiple in both directions, which is exactly what a leveraged index position does.
Jensen's alpha is negative: -1.3%. Once you account for the beta exposure, the risk-adjusted contribution is below zero. The strategy's Sharpe ratio of 0.248 sits well under the S&P 500's 0.361. On a risk-adjusted basis, the index wins.
So the strategy beats the market on raw return and loses to it on every risk measure that matters. The 1.44 point raw edge is compensation for taking 80% more volatility and a 16 point deeper drawdown, not evidence that sector-adjusted stock picking adds value in the US.
The 146.9% down capture is the same momentum crash problem documented across all momentum strategies. Stocks that have been outperforming their sector peers are the most crowded positions in the market. When the market sells off, they sell off harder. Sector-adjusting the signal does not change that.
What This Means for the Moskowitz-Grinblatt Finding
Moskowitz and Grinblatt (1999) showed that roughly half of US momentum profits come from sector-level trends, and half from picking winners within sectors. The relative strength signal strips out the sector half and keeps the stock-specific half.
The US result is consistent with that decomposition. The stock-specific half that remains is real enough to keep the portfolio in winning, high-beta names, which is why raw returns are strong in a bull market. But it isn't a clean, market-neutral alpha source. It's a high-beta tilt toward sector-relative winners. In the most efficient, most heavily covered equity market in the world, that tilt earns its return through exposure, not through an information edge.
For a US investor, the practical reading is straightforward: if you want this return profile, a leveraged or high-beta index position gives you the same thing with less complexity and lower turnover. The sector adjustment doesn't buy you risk-adjusted outperformance here.
Comparison to Raw Momentum in the US
Raw 12-month momentum in the US (buying the top decile by 12M-1M return, equal weight) historically delivers 10-12% CAGR in academic research over similar periods, also with high volatility and severe crash risk. Sector-adjusted momentum lands in the same neighborhood on return and carries the same crash profile. The sector adjustment changes which stocks you hold, but not the fundamental character of the strategy: a high-beta momentum tilt that rises and falls harder than the market.
Where the sector adjustment earns its keep is outside the US, in markets with weaker local benchmarks and slower information diffusion. Sweden, India, the UK, and Germany all show genuine risk-adjusted improvement. The US does not.
The Current Screen
The screen identifies US stocks with the strongest company-specific momentum, stocks winning within their sectors. It's useful context for what the strategy holds today, even though the portfolio-level edge is beta rather than alpha.
WITH universe AS (
    SELECT p.symbol, p.companyName, MIN(p.exchange) AS exchange, p.sector,
           MAX(k.marketCap) / 1e9 AS market_cap_billions
    FROM profile p
    JOIN key_metrics_ttm k ON p.symbol = k.symbol
    WHERE k.marketCap > 1000000000           -- $1B USD
      AND p.isActivelyTrading = true
      AND p.sector IS NOT NULL AND p.sector != ''
      AND p.exchange IN ('NYSE', 'NASDAQ', 'AMEX')
    GROUP BY p.symbol, p.companyName, p.sector
),
price_1m_ago AS (
    SELECT symbol, adjClose AS price_1m,
           ROW_NUMBER() OVER (PARTITION BY symbol
               ORDER BY ABS(CAST(dateEpoch AS BIGINT) -
                   CAST(EXTRACT(EPOCH FROM (CURRENT_DATE - INTERVAL '30' DAY))::BIGINT AS BIGINT))
           ) AS rn
    FROM stock_eod
    WHERE CAST(date AS DATE) BETWEEN CURRENT_DATE - INTERVAL '45' DAY AND CURRENT_DATE - INTERVAL '15' DAY
      AND adjClose > 1.0
),
price_12m_ago AS (
    SELECT symbol, adjClose AS price_12m,
           ROW_NUMBER() OVER (PARTITION BY symbol
               ORDER BY ABS(CAST(dateEpoch AS BIGINT) -
                   CAST(EXTRACT(EPOCH FROM (CURRENT_DATE - INTERVAL '365' DAY))::BIGINT AS BIGINT))
           ) AS rn
    FROM stock_eod
    WHERE CAST(date AS DATE) BETWEEN CURRENT_DATE - INTERVAL '395' DAY AND CURRENT_DATE - INTERVAL '335' DAY
      AND adjClose > 1.0
),
raw_momentum AS (
    SELECT u.symbol, u.companyName, u.exchange, u.sector, u.market_cap_billions,
           ROUND((p1m.price_1m - p12.price_12m) / p12.price_12m * 100, 1) AS raw_mom_pct
    FROM universe u
    JOIN price_12m_ago p12 ON u.symbol = p12.symbol AND p12.rn = 1
    JOIN price_1m_ago p1m  ON u.symbol = p1m.symbol  AND p1m.rn = 1
    WHERE p12.price_12m > 1.0 AND p1m.price_1m > 1.0
      AND (p1m.price_1m - p12.price_12m) / p12.price_12m <= 5.0
),
sector_avg AS (
    SELECT sector, COUNT(*) AS sector_count, AVG(raw_mom_pct) AS sector_avg_mom
    FROM raw_momentum
    GROUP BY sector
    HAVING COUNT(*) >= 5
)
SELECT m.symbol, m.companyName, m.exchange, m.sector,
       ROUND(m.market_cap_billions, 2) AS market_cap_billions,
       m.raw_mom_pct,
       ROUND(s.sector_avg_mom, 1) AS sector_avg_pct,
       ROUND(m.raw_mom_pct - s.sector_avg_mom, 1) AS relative_strength_pct,
       s.sector_count
FROM raw_momentum m
JOIN sector_avg s ON m.sector = s.sector
ORDER BY relative_strength_pct DESC
LIMIT 30
Run it on the Ceta Research Data Explorer.
By the Numbers
Period: 2000-2025 (25 years, 103 quarterly periods) Strategy CAGR: 9.46% SPY benchmark CAGR: 8.02% Excess CAGR: +1.45% (raw), -1.3% Jensen's alpha (risk-adjusted) Sharpe ratio: 0.248 (vs SPY 0.361) Max drawdown: -59.90% (vs SPY -43.86%) Annualized volatility: 30.11% (vs SPY 16.68%) Beta: 1.46 Up capture / down capture: 147.5% / 146.9% Cash periods: 0 of 103 (0%) Average stocks held: 29.7 of 30 target Average active sectors: 8.7
Academic Basis
Moskowitz, T. & Grinblatt, M. (1999). "Do Industries Explain Momentum?" Journal of Finance, 54(4), 1249-1290. Established industry momentum as roughly half of total momentum profits in US markets. The stock-specific half that the RS signal isolates keeps the portfolio in high-beta winners, which explains its raw return without explaining its risk-adjusted shortfall.
Jegadeesh, N. & Titman, S. (1993). "Returns to Buying Winners and Selling Losers." Journal of Finance, 48(1), 65-91. The foundational momentum paper. Established the 12M skip-1M lookback to avoid short-term reversal contamination.
Data: Ceta Research (FMP financial data warehouse). Backtest period 2000-2025 on NYSE, NASDAQ, AMEX. Past performance does not guarantee future results. This is educational content, not investment advice.

