
Sector Mean Reversion on Hong Kong Stocks (HKSE): 6.87% CAGR, +5.26% vs Hang Seng
Sector mean reversion on HKSE large caps from 2000 to 2025: 6.87% CAGR vs 1.61% for the Hang Seng, a +5.26% annual outperformance. 2009 was +77.76%, 2008 was -47.51%. Sharpe 0.148 against a Hang Seng that scored negative at -0.065. Extreme year-to-year variance.

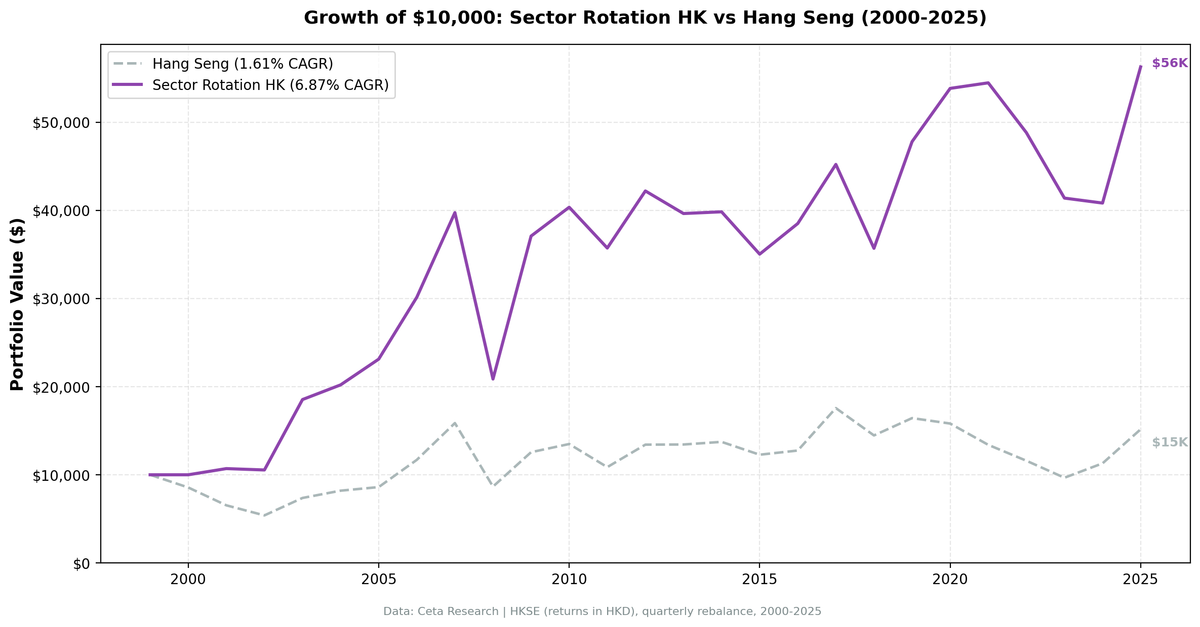
Hong Kong's sector mean reversion result is a mixed picture. Over 26 years, the strategy returned 6.87% annualized in HKD, beating the Hang Seng Index's 1.61% by +5.26% per year. The year-by-year story is anything but smooth. 2009 delivered +77.76% and 2003 delivered +75.79%. 2008 was -47.51%. HKSE produces dramatic individual years that average out to a positive edge over the local benchmark, and a lagging position relative to global alternatives.
Contents
- Method
- What is Sector Mean Reversion?
- Most Selected Sectors (of 104 quarters)
- The Screen
- What We Found
- 26 years. +5.26% annual excess vs the Hang Seng.
- Year-by-Year Returns
- Notable Periods
- 2001-2003: the strongest run in the record
- 2006-2008: trailing the boom, sharing the bust
- 2009: the recovery, +77.76%
- 2013-2015: three flat-to-negative years
- 2017: the worst relative year, -20.35pp
- 2019-2021: three straight double-digit wins
- 2022-2023: losing money, still beating the index
- 2024-2025: a bad miss, then a shared rally
- Backtest Methodology
- Limitations
- Takeaway
- Part of a Series
- References
- Run This Screen Yourself
Context on the benchmark: The Hang Seng returned 1.61% annually over 26 years as a price index, with a negative Sharpe of -0.065. Beating it by +5.26% is a real edge, but a global investor benchmarking against SPY (8.02%) would note that Hong Kong's strategy at 6.87% CAGR still lags by -1.15%. Both comparisons matter.
Data: FMP financial data warehouse, 2000-2025. Updated August 2026.
Method
Data source: Ceta Research (FMP financial data warehouse) Universe: HKSE (Hong Kong Stock Exchange), market cap > HKD $3B (~USD $400M) Period: 2000-2025 (26 years, 104 quarterly periods) Rebalancing: Quarterly (January, April, July, October) Signal: Buy all stocks in the bottom 2 sectors by 12-month trailing equal-weighted return Portfolio construction: Equal weight all qualifying stocks in selected sectors Benchmark: Hang Seng Index (^HSI) Cash rule: Hold cash if fewer than 5 sectors qualify, or fewer than 10 stocks pass the filters Currency note: Returns are in HKD (local currency). Benchmark is Hang Seng (HKD).
This is a pure price signal. No fundamental data is used, so there's no reporting lag to model. Entry is at the next available close after the signal date, not the signal-day close. Full methodology: backtests/METHODOLOGY.md
What is Sector Mean Reversion?
The strategy is simple. At each quarterly rebalance, we rank all sectors by their equal-weighted 12-month trailing return. We buy every qualifying stock in the bottom 2 sectors. Next quarter, we re-rank and rotate.
The academic basis comes from Moskowitz and Grinblatt (1999), who showed that industry-level momentum explains much of the stock momentum anomaly, which is why a sector-level signal carries information at all. Their result at a 12-month horizon was continuation, not reversal, so this strategy tests against it rather than following from it. The contrarian premise is a separate claim: sectors that have underperformed for a full year tend to carry suppressed valuations and depressed sentiment that eventually normalize.
Hong Kong is a structurally unusual market for this strategy. It's classified as a developed market, but a large portion of its listed companies are mainland Chinese firms (H-shares, Red Chips) that trade in Hong Kong but operate under PRC regulatory and economic conditions. The sector underperformance that drives the strategy's signal in HK often reflects policy risk, regulatory crackdowns, and real estate sector stress, not the sentiment-driven cycles that fuel reversion in Western markets. That structural difference shows up in the results.
With an average of 68.7 stocks per quarter across the two selected sectors, the portfolio is more concentrated than the US (569.1 stocks) but comparable to other Asian markets.
Most Selected Sectors (of 104 quarters)
| Sector | Quarters Selected |
|---|---|
| Technology | 23 (22%) |
| Communication Services | 22 (21%) |
| Basic Materials | 21 (20%) |
| Real Estate | 20 (19%) |
| Utilities | 20 (19%) |
| Energy | 20 (19%) |
| Financial Services | 18 (17%) |
| Healthcare | 18 (17%) |
| Consumer Cyclical | 17 (16%) |
| Consumer Defensive | 13 (12%) |
| Industrials | 8 (7%) |
The striking thing is how flat this distribution is. Technology leads at 22% and six sectors sit within three percentage points of it. Compare that with Japan, where Utilities alone take 39% of quarters. No Hong Kong sector stayed cheap long enough to dominate the signal. Leadership rotated, which is what you'd expect in a market where China-linked sectors cycle through regulatory and macro risk as much as sentiment. Technology and Communication Services carry the 2021 regulatory crackdown, Real Estate carries the Evergrande-era stress from 2020 onward, and Basic Materials and Energy track the commodity cycle.
The Screen
The screen below runs live. It ranks HKSE sectors by their current 12-month equal-weighted return. The bottom rows are what the backtest would buy today.
WITH prices AS (
    SELECT e.symbol, e.adjClose, CAST(e.date AS DATE) AS trade_date
    FROM stock_eod e
    JOIN profile p ON e.symbol = p.symbol
    WHERE p.sector IS NOT NULL AND p.sector != ''
      AND p.marketCap > 3000000000
      AND p.exchange IN ('HKSE')
      AND CAST(e.date AS DATE) >= CURRENT_DATE - INTERVAL '400' DAY
      AND e.adjClose IS NOT NULL AND e.adjClose > 0
),
recent AS (
    SELECT symbol, adjClose AS recent_price
    FROM prices
    QUALIFY ROW_NUMBER() OVER (PARTITION BY symbol ORDER BY trade_date DESC) = 1
),
year_ago AS (
    SELECT symbol, adjClose AS old_price
    FROM prices
    WHERE trade_date <= CURRENT_DATE - INTERVAL '252' DAY
    QUALIFY ROW_NUMBER() OVER (PARTITION BY symbol ORDER BY trade_date DESC) = 1
),
stock_returns AS (
    SELECT r.symbol, pr.sector,
        (r.recent_price / ya.old_price - 1) * 100 AS return_12m
    FROM recent r
    JOIN year_ago ya ON r.symbol = ya.symbol
    JOIN profile pr ON r.symbol = pr.symbol
    WHERE ya.old_price > 0 AND r.recent_price > 0
      AND (r.recent_price / ya.old_price - 1) BETWEEN -0.99 AND 5.0
)
SELECT pr.sector,
    ROUND(AVG(sr.return_12m), 2) AS avg_return_12m_pct,
    COUNT(DISTINCT sr.symbol) AS n_stocks,
    ROW_NUMBER() OVER (ORDER BY AVG(sr.return_12m) ASC) AS rank_worst
FROM stock_returns sr
JOIN profile pr ON sr.symbol = pr.symbol
GROUP BY pr.sector
HAVING COUNT(DISTINCT sr.symbol) >= 5
ORDER BY avg_return_12m_pct ASC
What We Found
The strategy produced volatile, dramatic years that compounded into a positive edge over the local Hang Seng Index. The down capture of 74.46% is a genuine positive: the strategy absorbs less downside than the Hang Seng in bad markets. Paired with 112.05% up capture, the asymmetry generates the +5.26% annual excess.
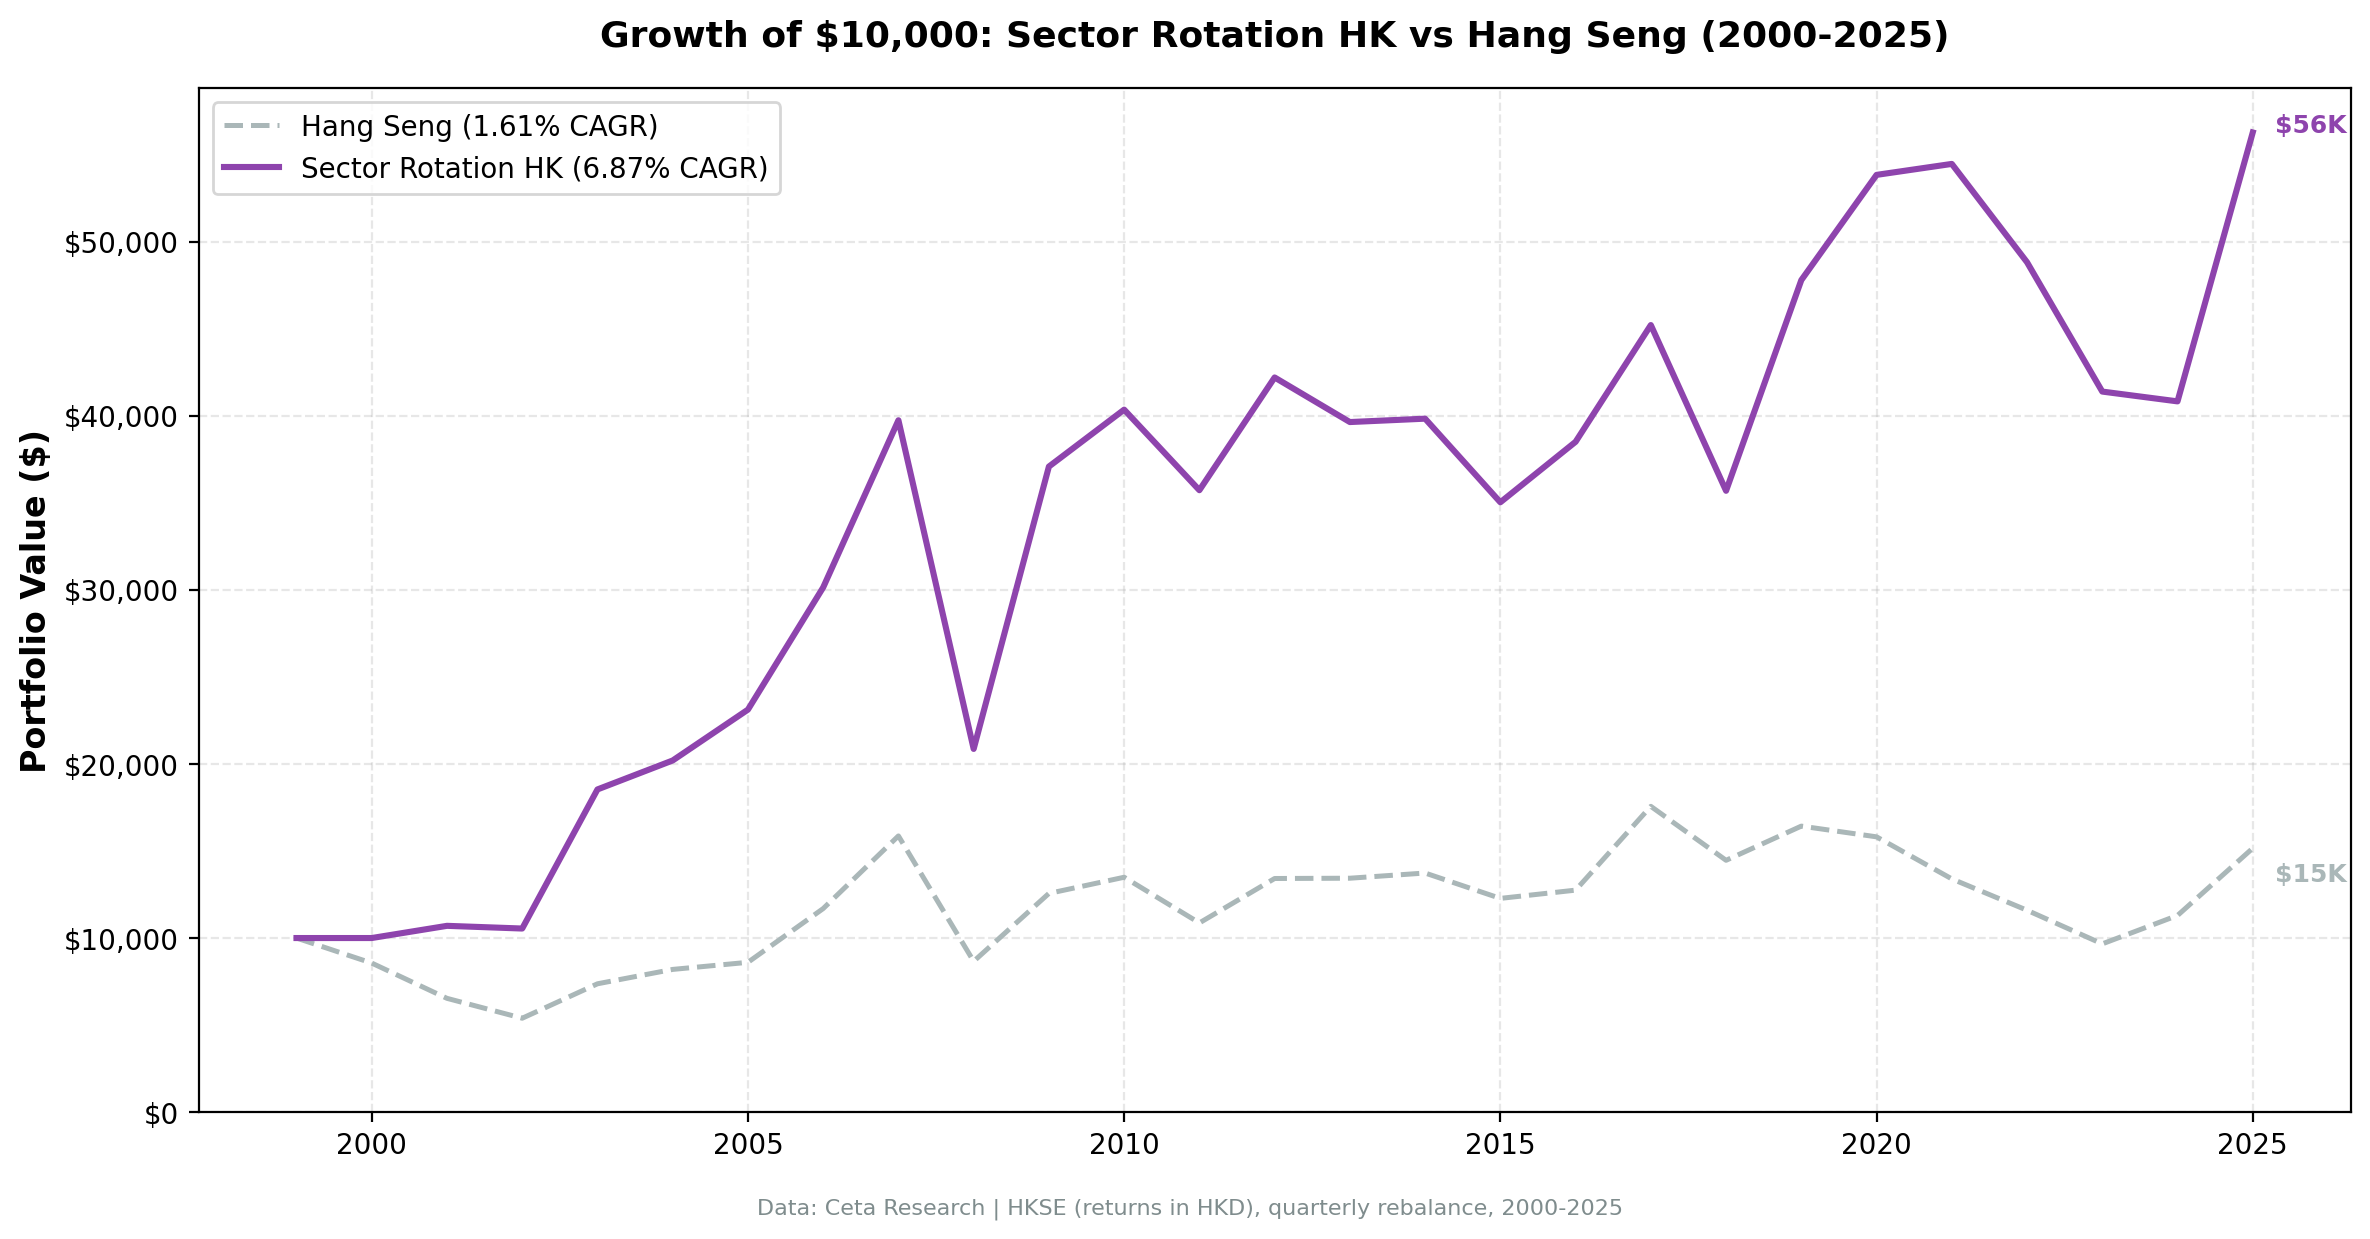
26 years. +5.26% annual excess vs the Hang Seng.
| Metric | Portfolio | Hang Seng |
|---|---|---|
| CAGR | 6.87% | 1.61% |
| Excess CAGR | +5.26% | |
| Total Return | 462.90% | 51.64% |
| Volatility | 26.22% | 21.28% |
| Max Drawdown | -49.60% | -50.50% |
| Sharpe Ratio | 0.148 | -0.065 |
| Sortino Ratio | 0.252 | -0.094 |
| Calmar Ratio | 0.139 | 0.032 |
| Win Rate (of 104 quarters) | 54.81% | |
| Up Capture | 112.05% | |
| Down Capture | 74.46% | |
| Beta | 1.043 | |
| Jensen Alpha | +5.32% | |
| Avg Stocks per Period | 68.7 | |
| Cash Periods | 4 of 104 |
HKD 10,000 compounded to HKD 56,290 in the strategy against HKD 15,164 in the Hang Seng.
The up capture of 112.05% and down capture of 74.46% explain the positive long-run edge. The strategy captures more than the Hang Seng in up markets and less in down markets. The Hang Seng's own 1.61% CAGR baseline is low enough that a modestly asymmetric strategy accumulates a large gap over 26 years. The index's Sharpe is negative at -0.065, meaning Hong Kong equities didn't compensate holders for risk at all over the period. The strategy's 0.148 clears that bar without being good in absolute terms.
The strategy beat the Hang Seng in 54.81% of the 104 quarters and in 15 of 26 calendar years. Four quarters were spent in cash, all of them in 2000, against zero for the US.
Year-by-Year Returns
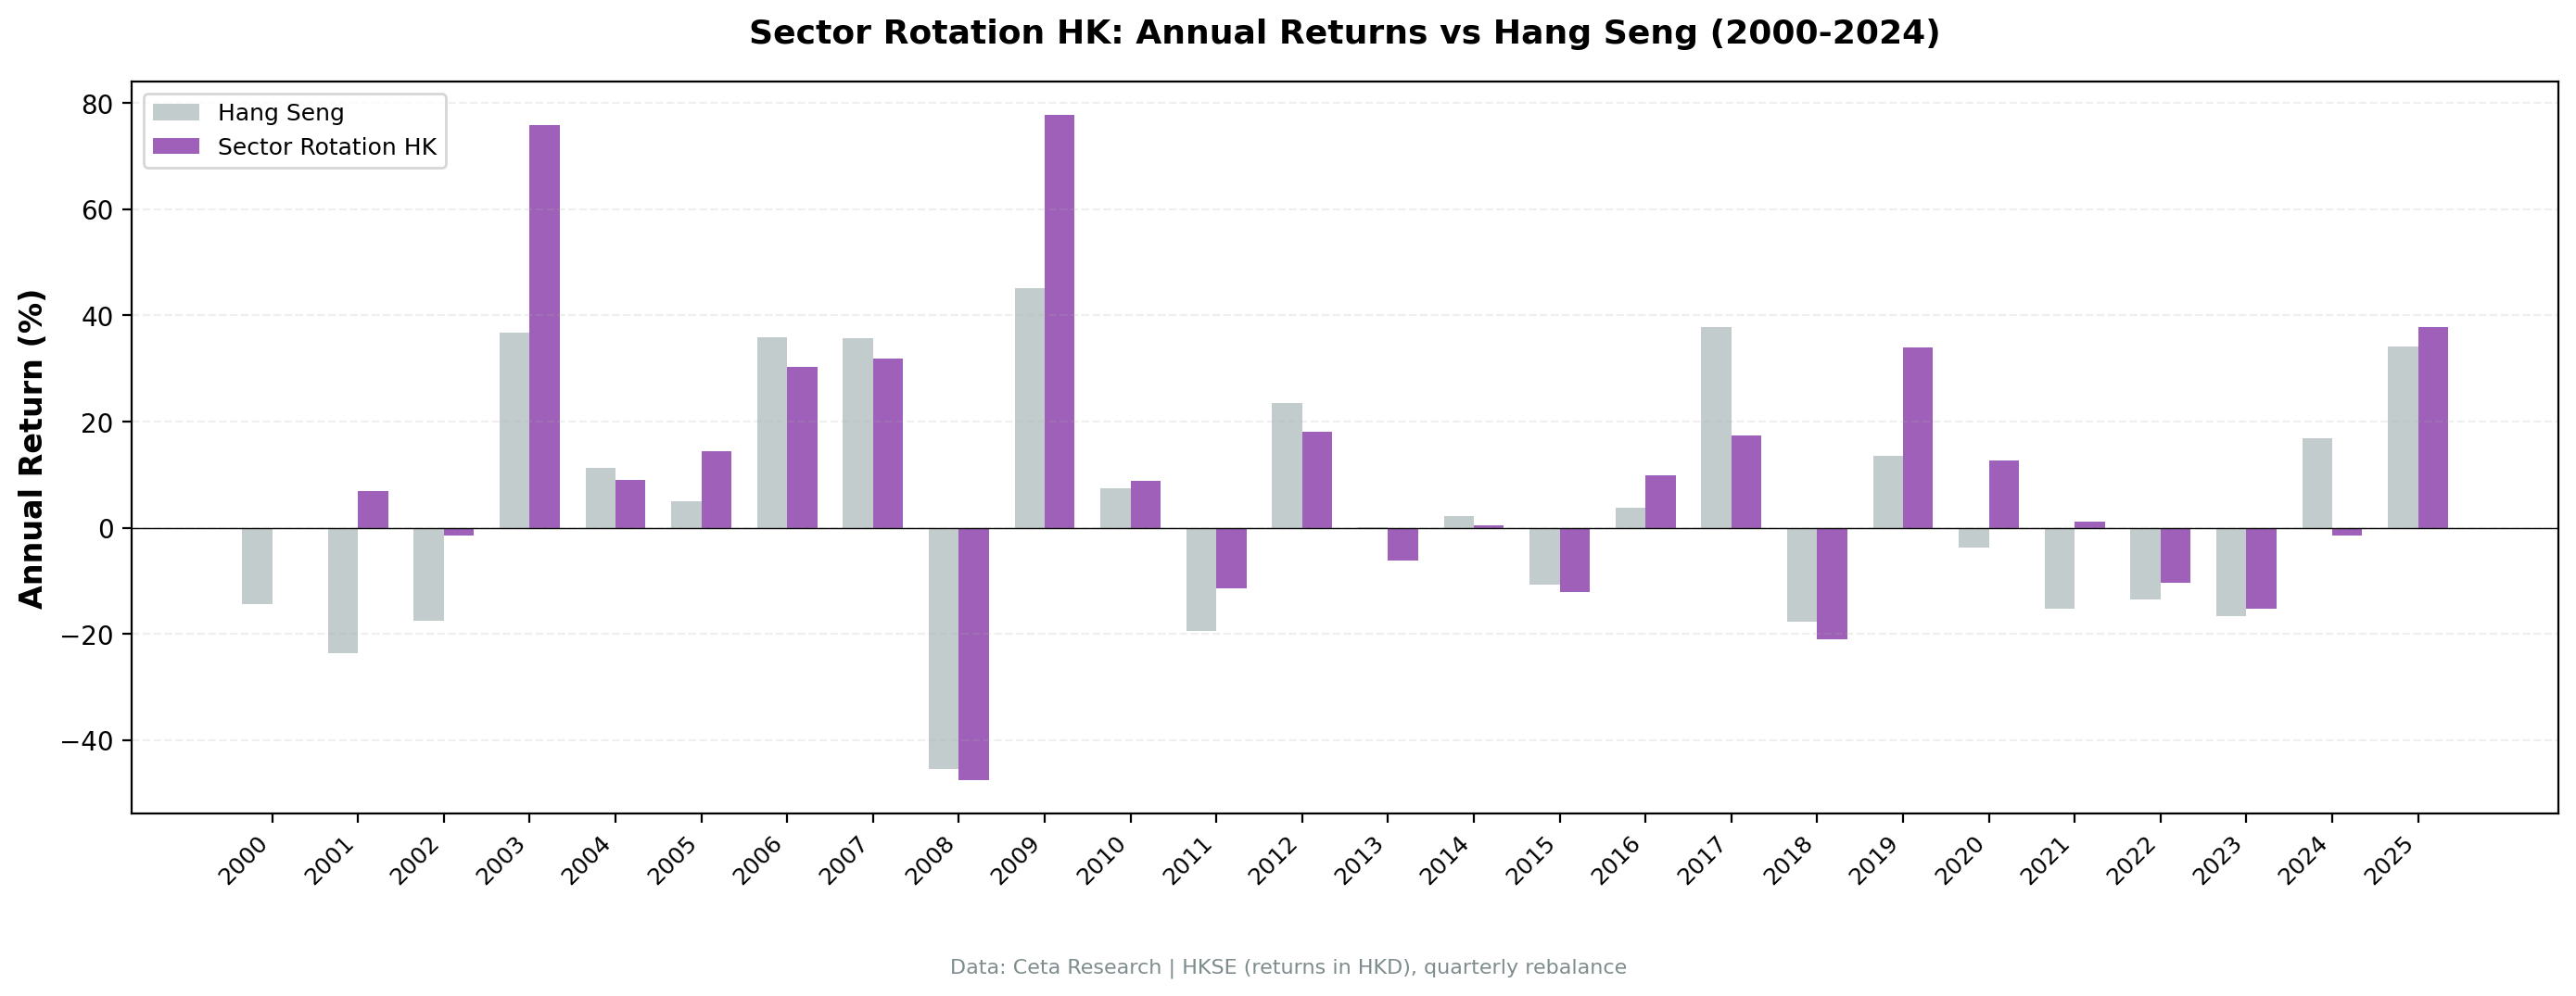
| Year | Portfolio | Hang Seng | Excess |
|---|---|---|---|
| 2000 | 0.00% (cash) | -14.39% | +14.39% |
| 2001 | +7.01% | -23.67% | +30.68% |
| 2002 | -1.45% | -17.49% | +16.05% |
| 2003 | +75.79% | +36.69% | +39.11% |
| 2004 | +8.98% | +11.22% | -2.24% |
| 2005 | +14.46% | +4.97% | +9.49% |
| 2006 | +30.37% | +35.90% | -5.53% |
| 2007 | +31.86% | +35.70% | -3.84% |
| 2008 | -47.51% | -45.42% | -2.09% |
| 2009 | +77.76% | +45.07% | +32.68% |
| 2010 | +8.82% | +7.39% | +1.43% |
| 2011 | -11.47% | -19.45% | +7.98% |
| 2012 | +18.13% | +23.49% | -5.36% |
| 2013 | -6.07% | +0.12% | -6.19% |
| 2014 | +0.49% | +2.22% | -1.73% |
| 2015 | -12.06% | -10.61% | -1.45% |
| 2016 | +9.92% | +3.86% | +6.06% |
| 2017 | +17.42% | +37.76% | -20.35% |
| 2018 | -21.06% | -17.65% | -3.42% |
| 2019 | +33.91% | +13.58% | +20.33% |
| 2020 | +12.65% | -3.75% | +16.40% |
| 2021 | +1.17% | -15.28% | +16.45% |
| 2022 | -10.37% | -13.45% | +3.07% |
| 2023 | -15.22% | -16.66% | +1.44% |
| 2024 | -1.36% | +16.89% | -18.24% |
| 2025 | +37.84% | +34.22% | +3.62% |
Notable Periods
2001-2003: the strongest run in the record
The opening stretch is easy to miss, because two of the three years look unremarkable in absolute terms. The Hang Seng fell -23.67% in 2001 and -17.49% in 2002. The strategy returned +7.01% and -1.45%, for +30.68pp and +16.05pp of excess. Neither year needed a boom. The index simply fell much further.
2003 is where the absolute numbers arrive. SARS crushed Hong Kong early in the year and retail, travel and hospitality-linked sectors were decimated. By mid-2003 the epidemic was contained and the China-driven economic boom resumed. Beaten-down sectors the strategy had loaded up on recovered hard: +75.79% against the Hang Seng's +36.69%. The +39.11pp excess is the best relative year in the entire HK backtest, ahead of 2009.
2006-2008: trailing the boom, sharing the bust
The run-up to the Global Financial Crisis was exceptional for Chinese and HK-listed companies. Mainland firms were listing in Hong Kong and capital flowed into the China growth story. The strategy participated but didn't lead, because a portfolio of the two worst-performing sectors is structurally the wrong place to be in a momentum-driven melt-up: +30.37% against +35.90% in 2006, +31.86% against +35.70% in 2007. Two small relative losses.
2008 then cost -47.51% against the Hang Seng's -45.42%, a -2.09pp gap. HK's heavy exposure to mainland financial and real estate companies amplified the GFC shock for everyone, and the beaten-down sectors offered no shelter. Roughly in line with the index, which is the honest read: this strategy has a 1.043 beta and doesn't defend against a systemic repricing.
2009: the recovery, +77.76%
2009 produced +77.76% against the Hang Seng's +45.07%, a +32.68pp excess. This is sector mean reversion working as designed: the sectors most destroyed in 2008 recovered most violently the following year.
The problem is sequencing. Losing 47.51% and then gaining 77.76% leaves you 6.7% below where you started. The compounding math is unforgiving. The strategy needed the 2009 recovery to claw back the 2008 loss, not to build on it.
2013-2015: three flat-to-negative years
2013 returned -6.07%, 2014 +0.49%, 2015 -12.06%. The Hang Seng was close to flat across the first two (+0.12%, +2.22%) and fell -10.61% in 2015, so the relative damage was modest: -6.19pp, -1.73pp and -1.45pp. The strategy wasn't losing to the index so much as going nowhere alongside it. The sectors selected were facing structural headwinds rather than sentiment dips. HK real estate was cooling under government measures and telecom competition was eroding margins. The signal found genuine fundamental weakness, not tradeable undervaluation.
2017: the worst relative year, -20.35pp
The Hang Seng gained +37.76% in 2017 on a mainland-driven rally. The strategy returned +17.42%, less than half as much. That -20.35pp gap is the widest single-year underperformance in the HK backtest, and it repeats the 2006-2007 pattern: when the index runs hard, last year's two worst sectors don't lead.
2019-2021: three straight double-digit wins
The Chinese regulatory crackdown on tech, education and fintech (2021) hit HK-listed stocks directly, and Evergrande's collapse demolished Real Estate. The Hang Seng returned +13.58% in 2019, then -3.75% and -15.28%.
The strategy returned +33.91%, +12.65% and +1.17%, for +20.33pp, +16.40pp and +16.45pp of excess. Three consecutive double-digit relative gains. Only 2019 came with a large absolute gain. The other two are down-capture wins, the strategy holding close to flat while the index fell.
2022-2023: losing money, still beating the index
2022 returned -10.37% against -13.45% (+3.07pp). 2023 returned -15.22% against -16.66% (+1.44pp). Both years lost real money and both years beat the benchmark, which is the uncomfortable shape of relative performance in a market that fell this far. Across 2021 to 2023 the strategy lost 23.1% while the Hang Seng lost 38.9%.
2024-2025: a bad miss, then a shared rally
2024 is the second-worst relative year in the record: -1.36% against a Hang Seng that gained +16.89%, a -18.24pp gap. The sectors the strategy owned didn't participate in the recovery at all.
2025 delivered +37.84% against +34.22%, a +3.62pp edge. Sectors beaten down through 2023-2024 finally reverted, though the index reverted nearly as hard. Whether this marks a regime change or a bounce remains to be seen.
Backtest Methodology
| Parameter | Value |
|---|---|
| Signal | 12-month trailing equal-weighted sector return |
| Selection | Bottom 2 sectors each quarter |
| Universe | HKSE, market cap > HKD $3B |
| Portfolio | Equal weight all qualifying stocks in selected sectors |
| Rebalancing | Quarterly (Jan, Apr, Jul, Oct) |
| Execution | Entry at the next available close after the signal date |
| Cash rule | Hold cash if fewer than 5 sectors qualify, or fewer than 10 stocks pass the filters |
| Transaction costs | Size-tiered model. Bid-ask spread and market impact are not modelled |
| Fundamental data | None. Pure price signal, so no reporting lag applies |
| Period | 2000-2025 (104 quarterly periods) |
| Benchmark | Hang Seng Index (^HSI) |
Limitations
Mainland China exposure creates non-cyclical risk. The biggest issue for sector mean reversion in Hong Kong is that a large portion of the HKSE universe is mainland Chinese companies (H-shares, Red Chips). Their underperformance often reflects regulatory decisions, political risk and policy shifts, not the sentiment-driven cycles this strategy is designed to exploit. The 2021-2023 period is the clearest example: Real Estate underperformance was driven by Evergrande and PRC policy, not temporary investor pessimism. The strategy still beat the index through it, but that was down-capture arithmetic, not the signal finding value.
-49.60% max drawdown. HK's combination of GFC sensitivity (2008) and China regulatory risk (2021-2023) produced a deep drawdown profile. It's marginally shallower than the Hang Seng's own -50.50%, which is a narrow win rather than a defensive feature. Losing half your capital is losing half your capital.
Low Sharpe of 0.148. The strategy generates positive alpha against the local index but with 26.22% annualized volatility. That's a poor risk-adjusted outcome in absolute terms even though it clears the Hang Seng's -0.065.
The Hang Seng baseline is low. The 1.61% CAGR for the Hang Seng over 26 years as a price index means beating it by +5.26% is a lower bar than it sounds. A global investor comparing Hong Kong strategy performance against SPY (8.02%) would see a -1.15% annual lag, not an advantage.
Currency. Returns are in HKD. The HKD is pegged to the USD within a narrow band (7.75-7.85), so currency risk is minimal for USD-based investors.
Thin universe relative to US. At 68.7 stocks per quarter, the portfolio is diversified but concentrated enough that a few bad sectors can have a large impact. The 4 cash quarters, all in 2000, came from the sector-count and stock-count minimums that a smaller universe hits more often than the US does.
Survivorship bias. Exchange membership uses current profiles, not historical. Companies that were delisted, acquired, or privatized aren't tracked.
Takeaway
Sector mean reversion on HKSE beats its local benchmark. The +5.26% annual excess over the Hang Seng reflects a real edge: 112.05% up capture and 74.46% down capture generate compounding asymmetry over 26 years, and the +5.32% Jensen alpha says it survives the beta adjustment. The Hang Seng's own 1.61% CAGR baseline makes this comparison easier to win than most.
The honest global picture is different. At 6.87% CAGR, the HK strategy lags SPY (8.02%) by -1.15% annually. A global investor with the alternative of holding US equities hasn't benefited from HK sector rotation over this period.
The headline numbers are dramatic: 2009 was +77.76%, 2003 was +75.79%, 2025 was +37.84%. Those standout years are matched by a -47.51% crash in 2008 and a 2013-2015 stretch that went nowhere. The five widest relative wins came in 2003, 2009, 2001, 2019 and 2021. The two widest relative losses came in 2017 and 2024, both years the Hang Seng gained more than 16%. The variance averages out to positive against the local index, and not against the world.
Part of a Series
This analysis is part of our Sector Mean Reversion global exchange comparison. We tested the same strategy across 13 exchanges: - Sector Mean Reversion on US Stocks (NYSE + NASDAQ + AMEX): 10.60% CAGR, +2.58% vs the S&P 500 - Sector Mean Reversion on Indian Stocks (NSE): 12.68% CAGR, but only +1.44% over the Sensex and a negative Jensen alpha - Sector Mean Reversion on Korean Stocks (KSC): 14.28% CAGR, the highest in the study, with a -35.09% max drawdown against the KOSPI's -52.73% - Sector Mean Reversion on Taiwanese Stocks (TAI + TWO): 14.12% CAGR and the best risk-adjusted result of the 13, at 0.485 Sharpe - Sector Mean Reversion on Swedish Stocks (STO): 10.79% CAGR, beat the OMX Stockholm 30 in 19 of 26 years - Sector Mean Reversion: Global Exchange Comparison
References
Moskowitz, T. J., & Grinblatt, M. (1999). Do industries explain momentum? Journal of Finance, 54(4), 1249-1290.
Run This Screen Yourself
Via web UI: Run the sector screen on Ceta Research Data Explorer. Paste the SQL above, set exchange to HKSE, and hit Run to see current sector rankings.
Via Python:
import requests, time

API_KEY = "your_api_key"  # get one at cetaresearch.com
BASE = "https://tradingstudio.finance/api/v1"

query = """
WITH prices AS (
    SELECT e.symbol, e.adjClose, CAST(e.date AS DATE) AS trade_date
    FROM stock_eod e
    JOIN profile p ON e.symbol = p.symbol
    WHERE p.sector IS NOT NULL AND p.sector != ''
      AND p.marketCap > 3000000000
      AND p.exchange IN ('HKSE')
      AND CAST(e.date AS DATE) >= CURRENT_DATE - INTERVAL '400' DAY
      AND e.adjClose IS NOT NULL AND e.adjClose > 0
),
recent AS (
    SELECT symbol, adjClose AS recent_price
    FROM prices
    QUALIFY ROW_NUMBER() OVER (PARTITION BY symbol ORDER BY trade_date DESC) = 1
),
year_ago AS (
    SELECT symbol, adjClose AS old_price
    FROM prices
    WHERE trade_date <= CURRENT_DATE - INTERVAL '252' DAY
    QUALIFY ROW_NUMBER() OVER (PARTITION BY symbol ORDER BY trade_date DESC) = 1
),
stock_returns AS (
    SELECT r.symbol, pr.sector,
        (r.recent_price / ya.old_price - 1) * 100 AS return_12m
    FROM recent r
    JOIN year_ago ya ON r.symbol = ya.symbol
    JOIN profile pr ON r.symbol = pr.symbol
    WHERE ya.old_price > 0 AND r.recent_price > 0
      AND (r.recent_price / ya.old_price - 1) BETWEEN -0.99 AND 5.0
)
SELECT pr.sector,
    ROUND(AVG(sr.return_12m), 2) AS avg_return_12m_pct,
    COUNT(DISTINCT sr.symbol) AS n_stocks,
    ROW_NUMBER() OVER (ORDER BY AVG(sr.return_12m) ASC) AS rank_worst
FROM stock_returns sr
JOIN profile pr ON sr.symbol = pr.symbol
GROUP BY pr.sector
HAVING COUNT(DISTINCT sr.symbol) >= 5
ORDER BY avg_return_12m_pct ASC
"""

resp = requests.post(f"{BASE}/data-explorer/execute", headers={
    "X-API-Key": API_KEY, "Content-Type": "application/json"
}, json={
    "query": query,
    "options": {"format": "json", "limit": 100},
    "resources": {"memoryMb": 16384, "threads": 6}
})
task_id = resp.json()["taskId"]

while True:
    result = requests.get(f"{BASE}/tasks/data-query/{task_id}",
                          headers={"X-API-Key": API_KEY}).json()
    if result["status"] in ("completed", "failed"):
        break
    time.sleep(2)

print("Sector rankings (worst to best, 12-month return):")
for r in result["result"]["rows"]:
    flag = " <-- BUY" if r["rank_worst"] <= 2 else ""
    print(f"#{r['rank_worst']} {r['sector']:30s} {r['avg_return_12m_pct']:+.1f}%  ({r['n_stocks']} stocks){flag}")
Get your API key at cetaresearch.com. The full backtest code (Python + DuckDB) is on GitHub.
Data: Ceta Research, FMP financial data warehouse. Universe: HKSE, market cap > HKD $3B. Quarterly rebalance, equal weight, 2000-2025. Returns in HKD. Benchmark: Hang Seng Index (^HSI). Past performance does not guarantee future results.
Past performance does not guarantee future results. This is educational content, not investment advice.

