
Sector Mean Reversion in Taiwan: 14.12% CAGR and the Best Sharpe Ratio in Our 13-Exchange Study
Taiwan's sector mean reversion produced 14.12% CAGR over 26 years with the highest Sharpe ratio (0.485) in a 13-exchange study. The standout metric: a down capture of 52.88%, so the portfolio absorbed about half the TAIEX's losses while keeping 110.19% of its gains.

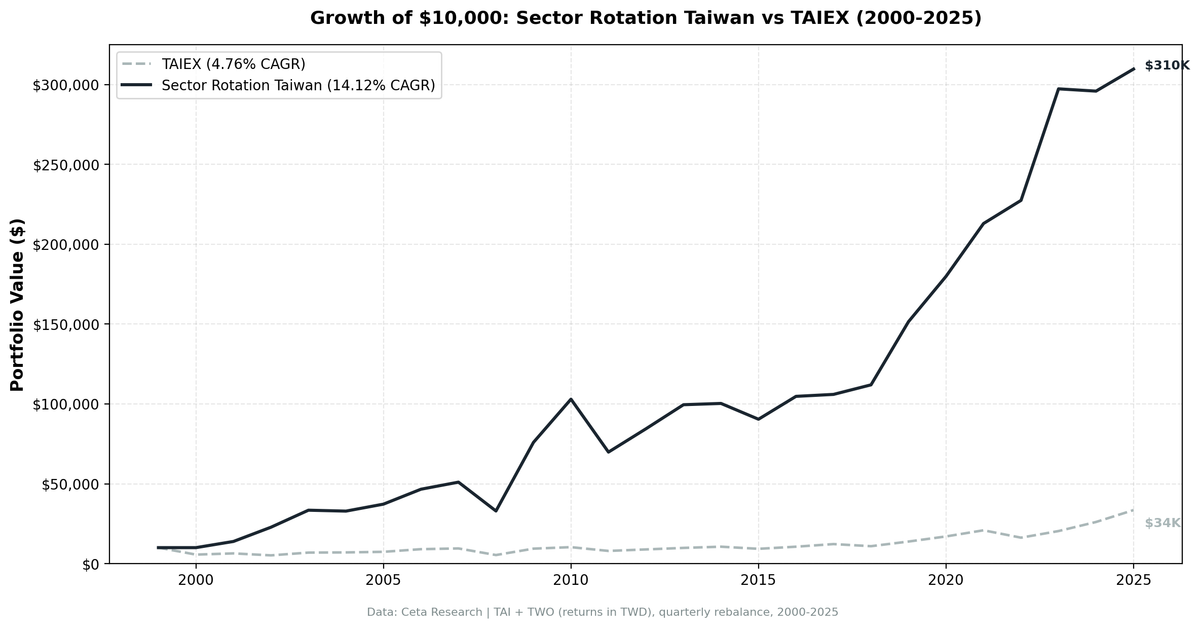
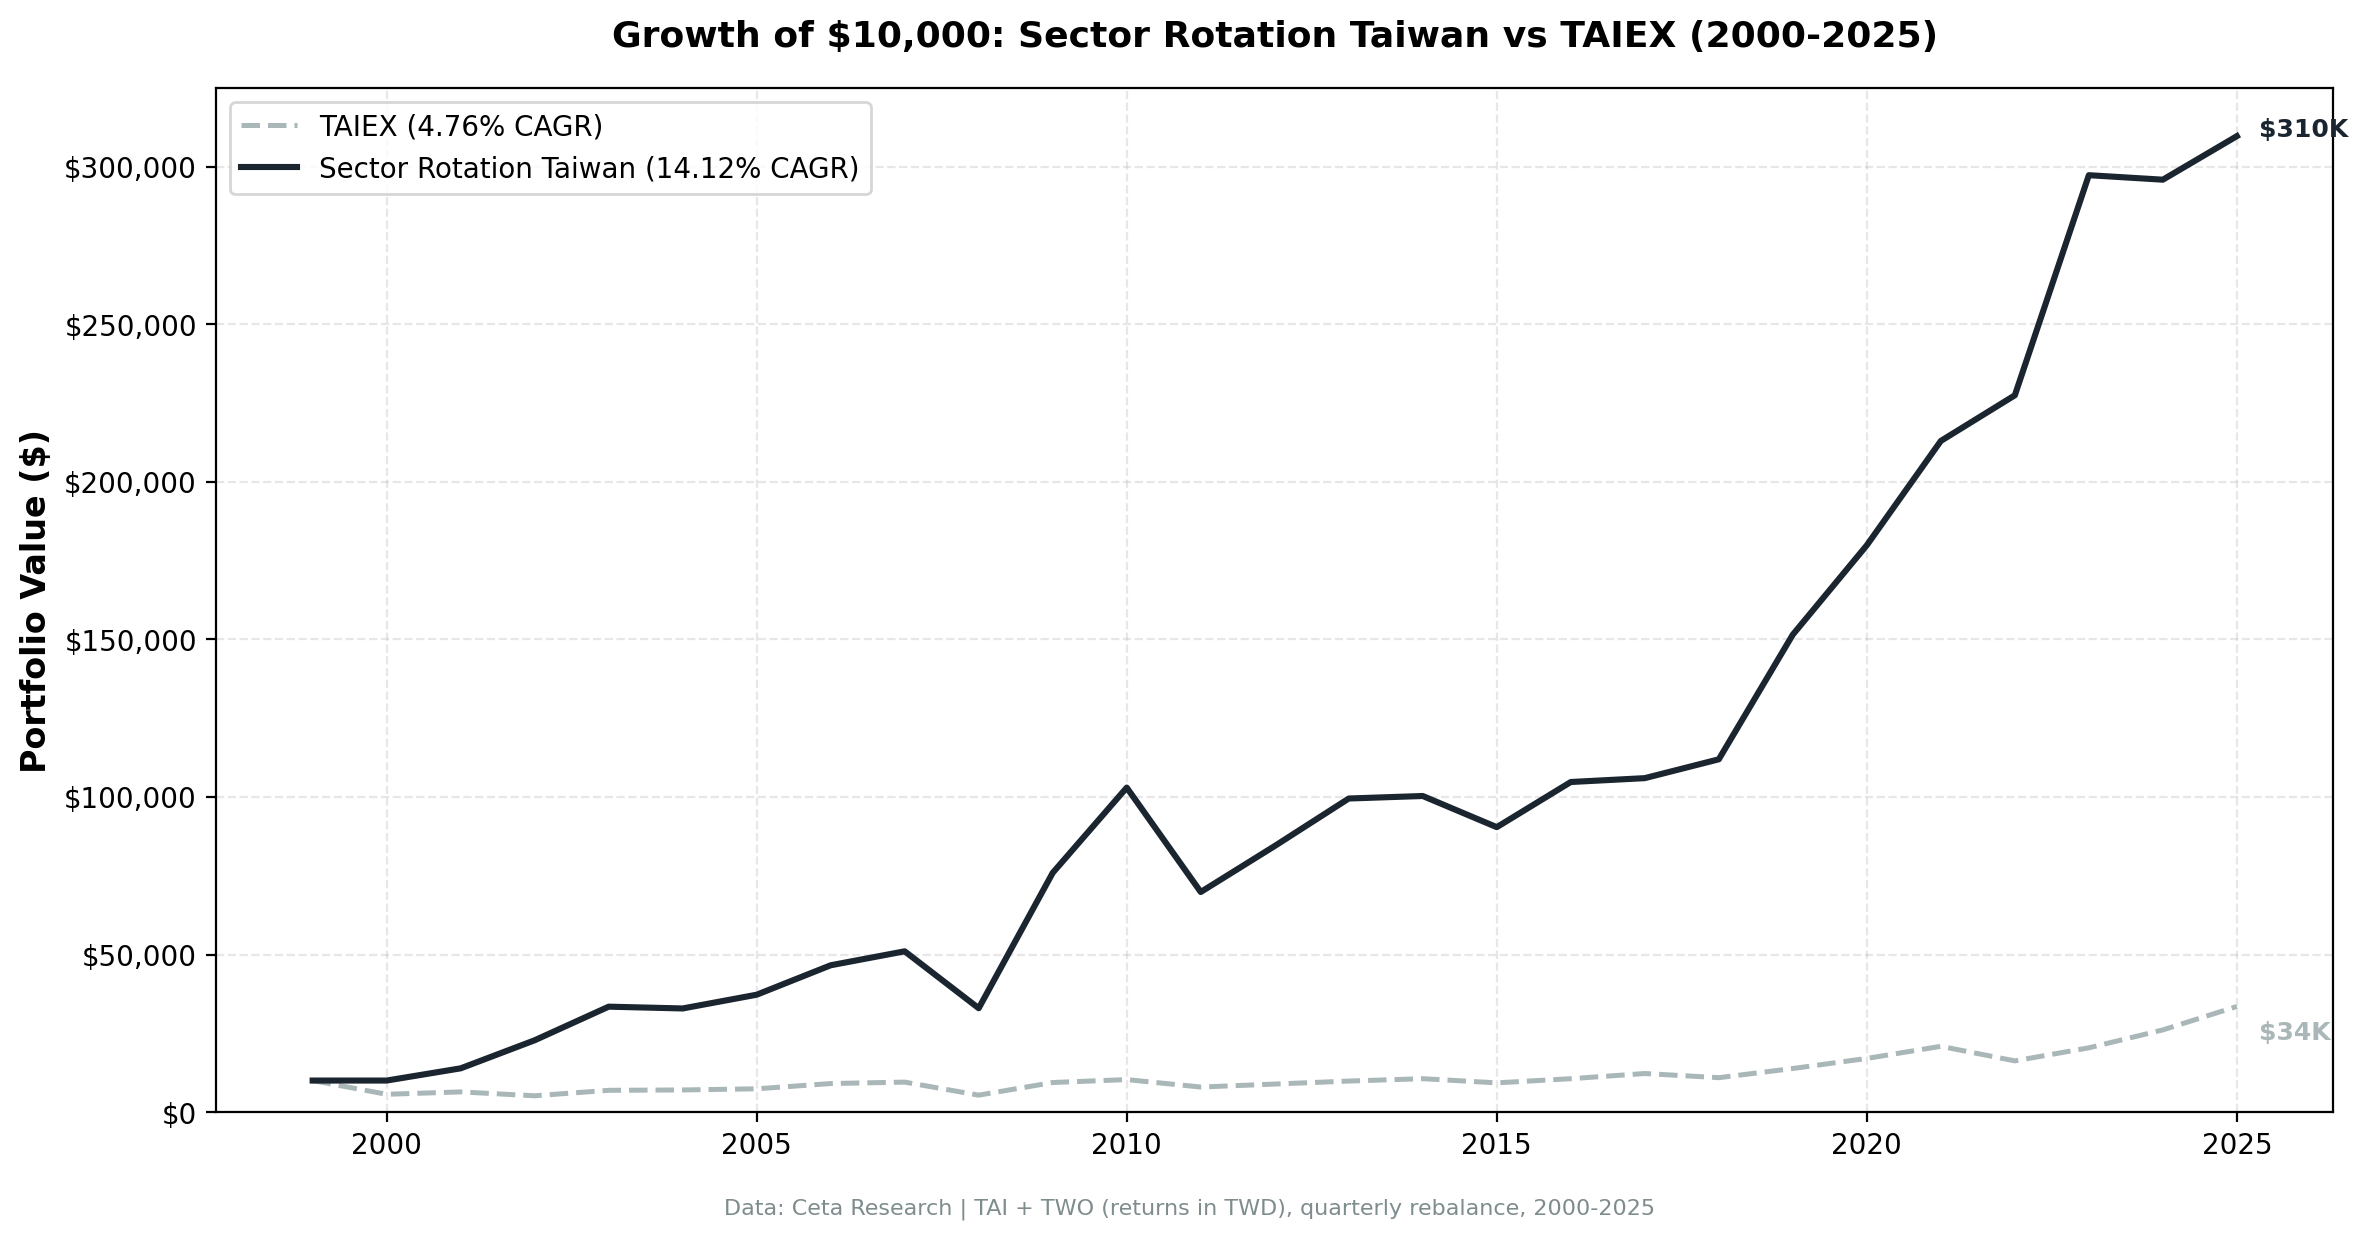
Taiwan's sector rotation strategy returned 14.12% annually from 2000 to 2025, in TWD, while the TAIEX returned 4.76%. The excess CAGR of +9.35% is the widest gap in the study. What makes Taiwan stand out isn't the top-line number. It produced the highest Sharpe ratio (0.485) of every exchange we tested, with a down capture of 52.88%, also the best of the 13.
Contents
- Method
- What We Found
- Most Frequently Selected Sectors
- Notable Years
- Full Annual Returns
- Backtest Methodology
- Limitations
- Takeaway
- Part of a Series
- References
We tested sector mean reversion on 13 exchanges. Taiwan finished at the top on risk-adjusted terms.
Data: FMP financial data warehouse, 2000-2025. Updated August 2026.
Method
Data source: Ceta Research (FMP financial data warehouse) Universe: TAI + TWO (Taiwan Stock Exchange + Taipei Exchange), market cap > TWD 3B (~$95M USD) Period: 2000-2025 (26 years, 104 quarterly rebalance periods) Rebalancing: Quarterly (January, April, July, October) Signal: Buy all stocks in the bottom 2 sectors by 12-month trailing equal-weighted return Benchmark: TAIEX (Taiwan Capitalization Weighted Stock Index) Cash rule: Hold cash if fewer than 5 sectors qualify, or fewer than 10 stocks pass the filters Transaction costs: Size-tiered model
This is a pure price signal. No fundamental data enters it, and entry is at the next available close after the signal date. Full methodology: backtests/METHODOLOGY.md
What We Found
The core finding is consistent outperformance against a weak local benchmark. The TAIEX returned only 4.76% annually over this period, which makes the +9.35% excess CAGR easier to understand in context: Taiwan's market has had long stretches of flat or negative performance, and the mean reversion strategy navigated those stretches by rotating into beaten-down sectors that recovered.
The risk side is what earns the 0.485 Sharpe. A beta of 0.872 and a down capture of 52.88% mean the portfolio took roughly half the index's downside while keeping 110.19% of its upside, and the Jensen alpha of +9.84% says the excess return isn't market exposure in disguise. Max drawdown of -49.54% is 15.7 points shallower than the TAIEX's own -65.25%.
| Metric | Portfolio | TAIEX |
|---|---|---|
| CAGR | 14.12% | 4.76% |
| Excess CAGR vs TAIEX | +9.35% | |
| Total Return | 2997.64% | 235.18% |
| Max Drawdown | -49.54% | -65.25% |
| Annualized Volatility | 27.03% | 24.43% |
| Sharpe Ratio | 0.485 | 0.154 |
| Beta | 0.872 | |
| Jensen Alpha | +9.84% | |
| Up Capture | 110.19% | |
| Down Capture | 52.88% | |
| Win Rate vs TAIEX (quarters) | 51.92% | |
| Avg Stocks per Period | 100.2 | |
| Cash Periods | 4 of 104 |
TWD 10,000 invested in January 2000 grew to TWD 309,764 by end of 2025 under this strategy. The same money in the TAIEX reached TWD 33,518.
Most Frequently Selected Sectors
Over 104 quarters, these were the sectors that appeared most often as the bottom two by trailing return:
| Sector | Quarters Selected |
|---|---|
| Basic Materials | 36 (34%) |
| Financial Services | 34 (32%) |
| Real Estate | 33 (31%) |
Basic Materials, Financial Services, and Real Estate dominate, with Technology next at 26 quarters. Taiwan's economy is export-driven and heavily cyclical, so these sectors cycle through periods of underperformance that the mean reversion signal captures well.
Notable Years
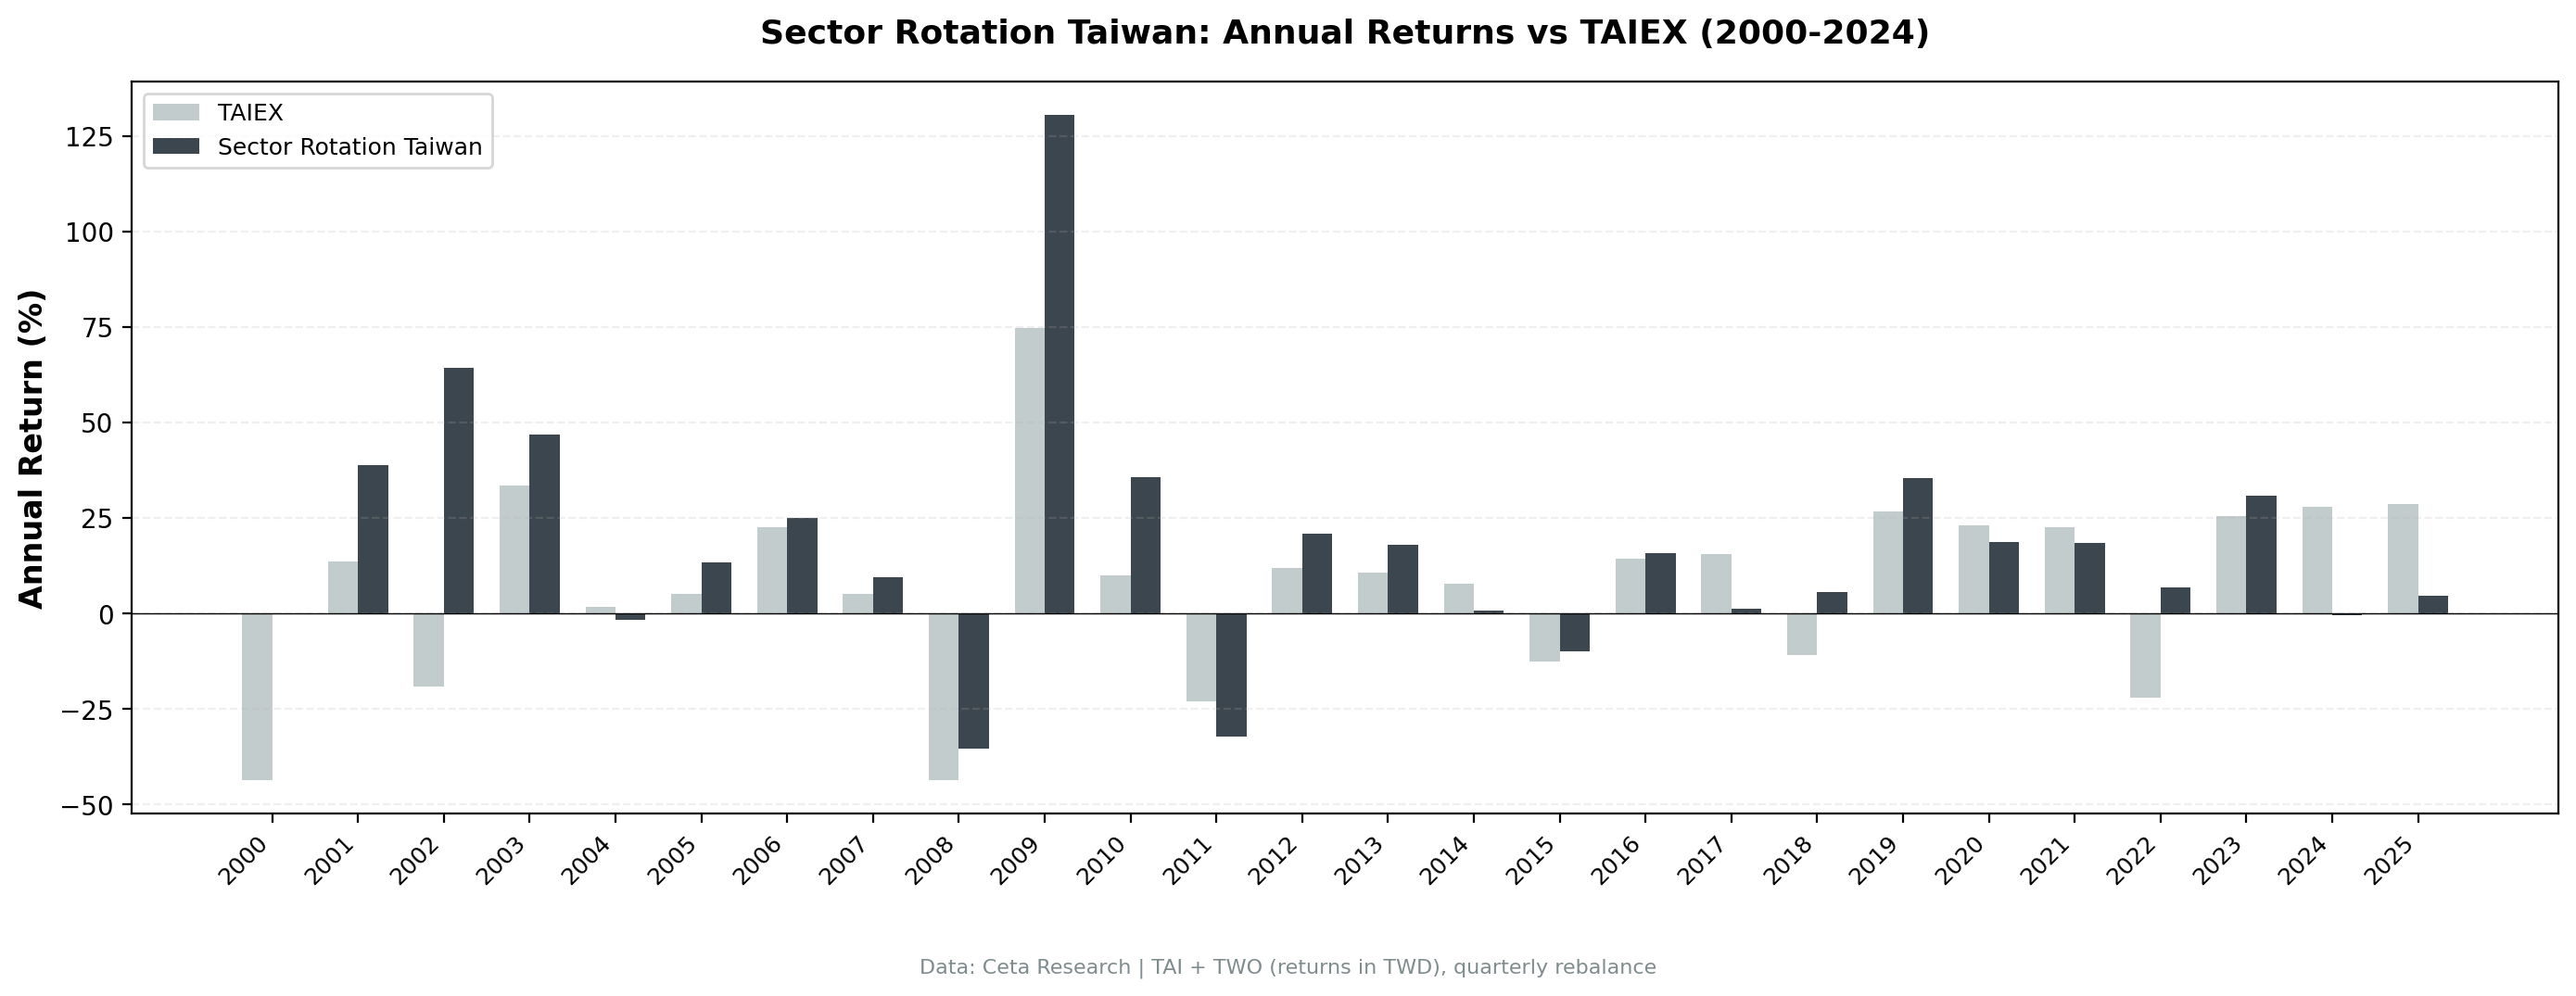
2001-2002: +38.75% and +64.19%. The dot-com collapse hit Taiwan's technology sector hard. TSMC, MediaTek, and the broader semiconductor supply chain fell sharply as global demand evaporated. The strategy rotated into beaten-down Financial Services and Basic Materials. 2002's +83.39pp excess, a +64.19% return against a TAIEX that fell 19.20%, is the widest single-year gap of any market in the study.
2008: -35.41% vs TAIEX -43.55%. The strategy held up better during the financial crisis and this was still its worst absolute year. Selecting underperforming sectors meant holding cyclical companies at low valuations, which provided a partial cushion. The max drawdown of -49.54% shows the strategy is not crash-proof, but the 2008 comparison is favorable.
2009: +130.44%. Taiwan's best year in the backtest. The financial and materials sectors had been crushed in 2008 and the reversion was violent: +130.44% against TAIEX's +74.70%, a +55.75pp excess, reflects how deeply the selected sectors had fallen and how quickly they snapped back.
2022: +6.80% vs TAIEX -22.15%. The down capture advantage is most visible here. The TAIEX fell over 22% in a rate-tightening year. Taiwan's sector rotation held its ground and delivered a positive return, worth +28.94pp.
2011: -32.18%. The worst year outside the 2008 crisis. Taiwan equities fell broadly as European debt fears and yen strengthening disrupted the region. Even beaten-down sectors couldn't escape the macro pressure. This is the honest side of the high-volatility profile. With 27.03% annualized volatility, years like 2011 are part of the deal.
2024-2025: -0.48% and +4.67%. The TAIEX surged in both years (+27.88% and +28.55%), driven by the AI and semiconductor boom concentrated in Taiwan's largest stocks. The strategy lagged badly (-28.36pp and -23.87pp excess), the two worst years in its record. This mirrors what happened to Korea in 2025: when market leadership concentrates in sectors not captured by the mean reversion signal, the strategy underperforms sharply.
Full Annual Returns
| Year | Portfolio | TAIEX | Excess |
|---|---|---|---|
| 2000 | 0.00% (cash) | -43.64% | +43.64% |
| 2001 | +38.75% | +13.47% | +25.28% |
| 2002 | +64.19% | -19.20% | +83.39% |
| 2003 | +46.82% | +33.52% | +13.30% |
| 2004 | -1.70% | +1.68% | -3.38% |
| 2005 | +13.27% | +5.19% | +8.08% |
| 2006 | +25.09% | +22.57% | +2.52% |
| 2007 | +9.51% | +5.08% | +4.43% |
| 2008 | -35.41% | -43.55% | +8.14% |
| 2009 | +130.44% | +74.70% | +55.75% |
| 2010 | +35.61% | +9.96% | +25.65% |
| 2011 | -32.18% | -22.97% | -9.21% |
| 2012 | +20.92% | +11.90% | +9.03% |
| 2013 | +17.84% | +10.71% | +7.12% |
| 2014 | +0.80% | +7.68% | -6.89% |
| 2015 | -9.86% | -12.51% | +2.65% |
| 2016 | +15.85% | +14.28% | +1.57% |
| 2017 | +1.17% | +15.51% | -14.33% |
| 2018 | +5.64% | -10.80% | +16.43% |
| 2019 | +35.35% | +26.65% | +8.69% |
| 2020 | +18.72% | +23.15% | -4.43% |
| 2021 | +18.40% | +22.60% | -4.21% |
| 2022 | +6.80% | -22.15% | +28.94% |
| 2023 | +30.71% | +25.52% | +5.19% |
| 2024 | -0.48% | +27.88% | -28.36% |
| 2025 | +4.67% | +28.55% | -23.87% |
The win rate versus TAIEX is 51.92% of the 104 quarters, barely above half, though on a calendar-year basis it's 18 of 26 (69.2%). The strategy builds its +9.35% excess CAGR through large wins in down markets (2002, 2009, 2022) and by avoiding the worst of the drawdowns (2008). The 2024 and 2025 underperformance reflects the concentration of TAIEX gains in the semiconductor and AI-related names that the mean reversion signal avoids by construction.
Backtest Methodology
| Parameter | Value |
|---|---|
| Strategy | Sector Mean Reversion |
| Signal | Bottom 2 sectors by 12-month trailing EW return |
| Rebalancing | Quarterly (Jan, Apr, Jul, Oct) |
| Weighting | Equal weight within selected sectors |
| Universe | TAI + TWO, market cap > TWD 3B (~$95M) |
| Period | 2000-2025 (26 years, 104 quarters) |
| Benchmark | TAIEX (Taiwan Capitalization Weighted Stock Index) |
| Cash rule | Hold cash if fewer than 5 sectors qualify or fewer than 10 stocks pass filters |
| Transaction costs | Size-tiered model |
| Execution | Entry at the next available close after the signal date |
| Academic basis | Moskowitz & Grinblatt (1999) |
Limitations
Currency. All returns are in TWD. A foreign investor running this strategy would face TWD/USD exchange rate exposure. The TWD has been relatively stable against the dollar over the 26-year period, but currency effects can materially change realized returns in any given year.
Volatility. The 27.03% annualized volatility is high. The Sharpe ratio of 0.485 is the best in the study, but the absolute swings are large. Years like 2011 (-32.18%) and 2009 (+130.44%) reflect a portfolio that moves hard in both directions. The max drawdown of -49.54% is comparable to major market index drawdowns, even if it's shallower than the TAIEX's -65.25%.
100 stocks per period. The average holding is large for a concentrated strategy. Buying the bottom 2 sectors in Taiwan typically means buying a wide cross-section of the exchange. This is a diversified sector tilt, not stock picking.
Costs are modelled, frictions aren't. A size-tiered transaction cost model is applied to every position, but bid-ask spread and market impact are not. Rebalancing 100 Taiwanese small and mid-caps four times a year would meet both.
Win rate of 51.92% of quarters. The strategy beats the TAIEX in barely more quarters than it trails, and returns compound through the magnitude of wins versus losses. The 2024 and 2025 losses (-28.36pp and -23.87pp excess) are a reminder that the strategy can lag badly when the benchmark is driven by concentrated sector leadership.
Concentration in cyclicals. Basic Materials, Financial Services, and Real Estate together account for the majority of quarters. These sectors are sensitive to global commodity cycles, interest rates, and regional property conditions. A sustained structural shift in any of these areas would change the strategy's behavior.
Takeaway
Taiwan's sector mean reversion produced 14.12% CAGR against the TAIEX's 4.76% over 26 years, a +9.35% annual excess and the widest gap in the study. The Sharpe ratio of 0.485 and the 52.88% down capture are both the best of the 13 exchanges tested. The 2009 recovery (+130.44%) shows how aggressively the strategy can compound from a trough.
The tradeoff is real. High absolute volatility, a 51.92% quarterly win rate, and a max drawdown of -49.54% mean this is not a low-risk strategy. The 2024 and 2025 underperformance reflects its structural aversion to momentum-driven market leadership. The risk-adjusted profile is strong over the full period, but investors need the tolerance for large swings and extended underperformance stretches to realize it.
Part of a Series
We tested this strategy across 13 exchanges. Other analyses in the series:
- US (NYSE + NASDAQ + AMEX) →
- India (NSE) →
- Korea (KSC) →
- Sweden (STO) →
- Global comparison →: all 13 exchanges ranked by Sharpe, CAGR, and down capture
References
Moskowitz, T. J., & Grinblatt, M. (1999). Do industries explain momentum? Journal of Finance, 54(4), 1249-1290.
Data: Ceta Research (FMP financial data warehouse), 2000-2025. Universe: TAI + TWO. Market cap > TWD 3B (~$95M). Returns in TWD. Benchmark: TAIEX. Full methodology: METHODOLOGY.md. Past performance does not guarantee future results.
Past performance does not guarantee future results. This is educational content, not investment advice.

