
Sector Mean Reversion on UK Stocks (LSE): 6.51% CAGR, +4.96% vs FTSE 100
Sector mean reversion on LSE large caps from 2000 to 2025: 6.51% CAGR in GBP vs 1.55% for the price-only FTSE 100, a +4.96% annual edge. Energy is the most-selected sector at 31% of quarters. Against SPY (8.02%) the strategy trails by -1.51% a year.

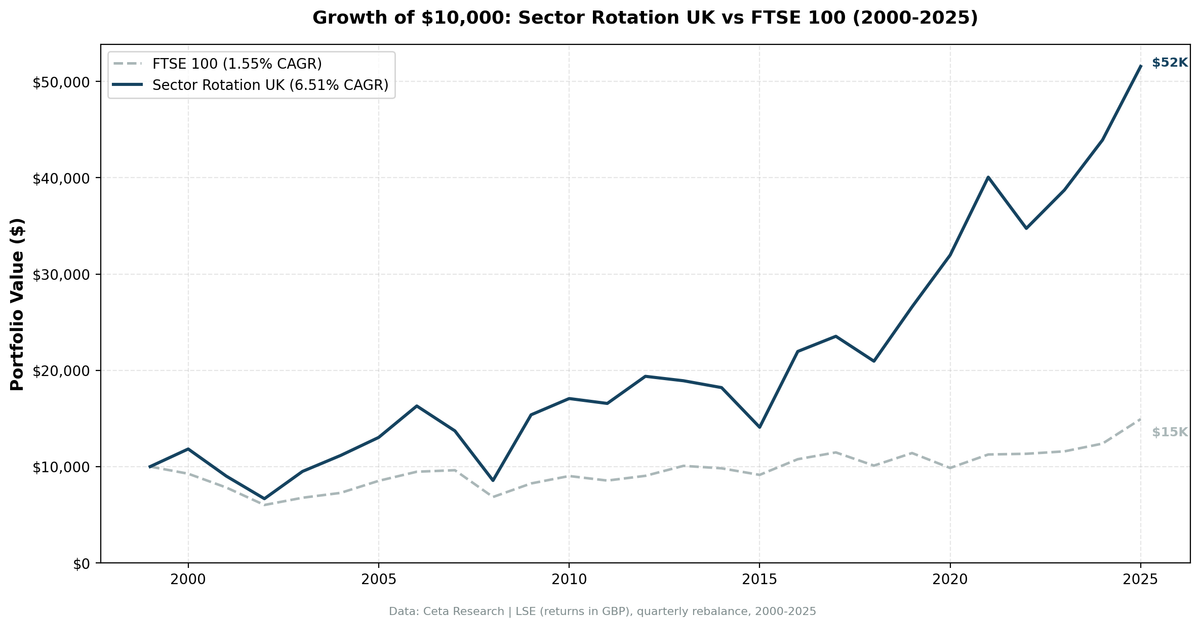
We ran a sector mean reversion strategy on London Stock Exchange large-cap stocks from 2000 to 2025. The result was 6.51% annualized in GBP, beating the FTSE 100 by +4.96% per year. The strategy was invested in all 104 quarters, averaged 106 stocks per period, and compounded a £10,000 starting position to £51,566 by end of 2025.
Contents
- Method
- What is Sector Mean Reversion?
- The Screen
- What We Found
- 26 years. +4.96% annual excess vs the FTSE 100.
- Year-by-year returns
- 2000-2004: A strong start, then two bad years
- 2009: The best year
- 2007: The single worst year
- 2013-2015: The worst stretch
- 2016: Post-Brexit recovery
- 2020 and beyond: Continued outperformance
- Backtest Methodology
- Limitations
- Takeaway
- Part of a Series
- References
- Run This Screen Yourself
That headline deserves unpacking. The FTSE 100 returned 1.55% annually over 26 years as a price index. It excludes dividends. If you add UK dividend yields (historically around 3-4% annually), a total-return FTSE benchmark would be meaningfully higher, which would erase most of the strategy's excess return. Against SPY on a total-return basis, the UK strategy at 6.51% CAGR trails the S&P 500 (8.02%) by -1.51% annually. The local edge is real, but its size is mostly a function of how poorly the price-only FTSE 100 has done.
Data: FMP financial data warehouse, 2000-2025. Updated August 2026.
Method
| Parameter | Value |
|---|---|
| Data source | Ceta Research (FMP financial data warehouse) |
| Universe | LSE, market cap > £500M |
| Period | 2000-2025 (26 years, 104 quarterly periods) |
| Rebalancing | Quarterly (January, April, July, October), equal weight all qualifying stocks in selected sectors |
| Execution | Entry at the next available close after the signal date |
| Benchmark | FTSE 100 (^FTSE) |
| Cash rule | Hold cash if fewer than 5 sectors qualify, or fewer than 10 stocks pass the filters |
| Transaction costs | Size-tiered model, applied to every position |
What is Sector Mean Reversion?
At each quarterly rebalance, we rank all sectors by their equal-weighted 12-month trailing return. We buy every large-cap stock in the bottom 2 sectors. Next quarter, we re-rank and rotate. No discretion, no filters on fundamentals. This is a pure price signal.
Moskowitz and Grinblatt (1999) established the part this strategy leans on: much of the momentum anomaly is explained by industry-level patterns, so sector membership is where the signal lives. What they documented at a 12-month horizon was continuation, not reversal, so this strategy runs against their result rather than following from it. The contrarian premise is a separate claim: sectors that underperform for a full year carry depressed valuations and low sentiment, and both tend to normalize.
On LSE, that normalization happens at a rate that beats the local index by a wide margin. The FTSE 100 is a slow-moving, commodity and finance-heavy index that has delivered almost nothing in price appreciation over 26 years. The strategy's Energy and Consumer Cyclical rotations capture violent recoveries that the buy-and-hold FTSE investor never holds through consistently.
The sectors that show up most often in the UK bottom 2 are:
| Sector | Quarters Selected (of 104) |
|---|---|
| Energy | 33 (31%) |
| Communication Services | 25 (24%) |
| Real Estate | 24 (23%) |
| Utilities | 23 (22%) |
| Consumer Cyclical | 23 (22%) |
| Basic Materials | 19 (18%) |
| Consumer Defensive | 17 (16%) |
| Technology | 16 (15%) |
| Healthcare | 11 (10%) |
| Financial Services | 11 (10%) |
| Industrials | 6 (5%) |
Energy leads at 33 quarters. The LSE has a high concentration of FTSE-listed oil majors and commodity producers. When oil falls, Energy drags. The strategy buys in. Sometimes oil recovers quickly (2009, 2016). Sometimes it doesn't (2015). Over 26 years, the recoveries have outweighed the failed reversions.
The Screen
The screen below ranks LSE large-cap sectors by their current 12-month equal-weighted return. The bottom rows are what the strategy would buy today.
WITH prices AS (
    SELECT e.symbol, e.adjClose, CAST(e.date AS DATE) AS trade_date
    FROM stock_eod e
    JOIN profile p ON e.symbol = p.symbol
    WHERE p.sector IS NOT NULL AND p.sector != ''
      AND p.marketCap > 500000000
      AND p.exchange IN ('LSE')
      AND CAST(e.date AS DATE) >= CURRENT_DATE - INTERVAL '400' DAY
      AND e.adjClose IS NOT NULL AND e.adjClose > 0
),
recent AS (
    SELECT symbol, adjClose AS recent_price
    FROM prices
    QUALIFY ROW_NUMBER() OVER (PARTITION BY symbol ORDER BY trade_date DESC) = 1
),
year_ago AS (
    SELECT symbol, adjClose AS old_price
    FROM prices
    WHERE trade_date <= CURRENT_DATE - INTERVAL '252' DAY
    QUALIFY ROW_NUMBER() OVER (PARTITION BY symbol ORDER BY trade_date DESC) = 1
),
stock_returns AS (
    SELECT r.symbol, pr.sector, (r.recent_price / ya.old_price - 1) * 100 AS return_12m
    FROM recent r
    JOIN year_ago ya ON r.symbol = ya.symbol
    JOIN profile pr ON r.symbol = pr.symbol
    WHERE ya.old_price > 0 AND r.recent_price > 0
      AND (r.recent_price / ya.old_price - 1) BETWEEN -0.99 AND 5.0
)
SELECT pr.sector,
    ROUND(AVG(sr.return_12m), 2) AS avg_return_12m_pct,
    COUNT(DISTINCT sr.symbol) AS n_stocks,
    ROW_NUMBER() OVER (ORDER BY AVG(sr.return_12m) ASC) AS rank_worst
FROM stock_returns sr
JOIN profile pr ON sr.symbol = pr.symbol
GROUP BY pr.sector
HAVING COUNT(DISTINCT sr.symbol) >= 5
ORDER BY avg_return_12m_pct ASC
What We Found
The strategy stayed invested through all 26 years, with zero cash periods across 104 quarters. The up capture of 159.83% and down capture of 106.02% tell the core story, and it isn't the flattering one: the strategy amplifies FTSE gains and also amplifies FTSE losses. All of the edge comes from the upside.
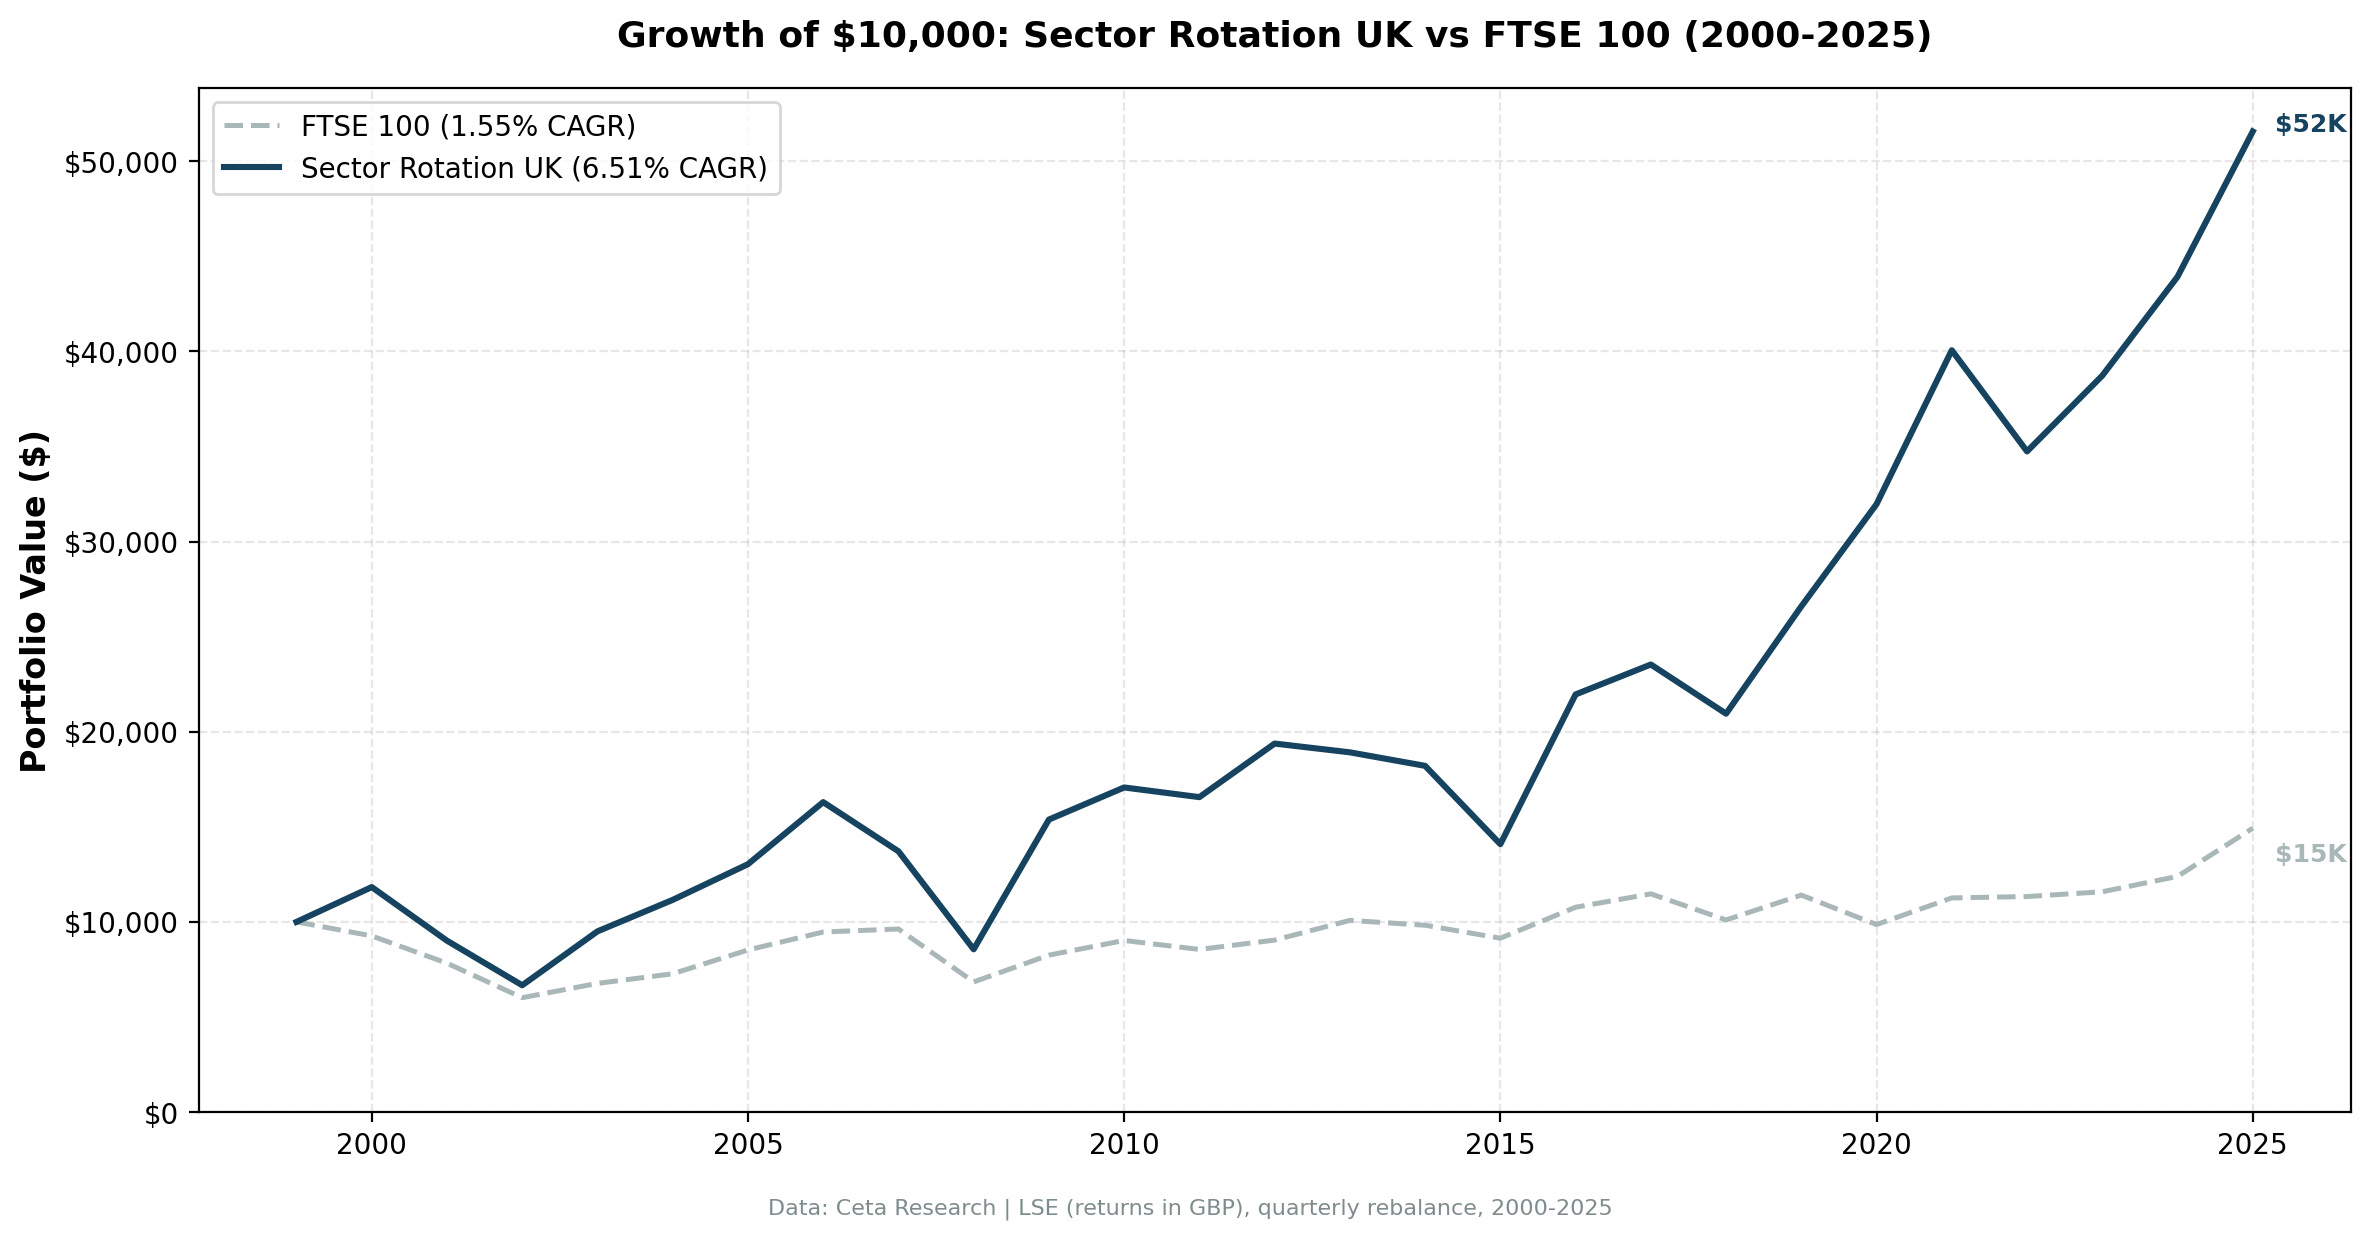
26 years. +4.96% annual excess vs the FTSE 100.
| Metric | Strategy | FTSE 100 |
|---|---|---|
| CAGR | 6.51% | 1.55% |
| Excess vs FTSE 100 | +4.96% | |
| Total Return | 415.66% | 49.29% |
| Volatility | 23.83% | 14.19% |
| Max Drawdown | -50.70% | -43.69% |
| Sharpe Ratio | 0.126 | -0.137 |
| Sortino Ratio | 0.194 | -0.173 |
| Calmar Ratio | 0.128 | 0.036 |
| Up Capture | 159.83% | |
| Down Capture | 106.02% | |
| Beta | 1.147 | |
| Alpha (Jensen) | 5.24% | |
| Win Rate vs FTSE 100 (quarters) | 60.58% | |
| Avg Stocks per Period | 106.2 | |
| Cash Periods | 0 of 104 |
Important caveat on the benchmark: The FTSE 100 is a price return index. It doesn't include dividends. UK dividend yields have historically run around 3-4% annually. Adding dividends would push a total-return FTSE benchmark 3-4% higher annually, which would consume most of the strategy's +4.96% excess return. Against SPY (which is total return), the UK strategy at 6.51% CAGR trails the S&P 500's 8.02% by -1.51% annually. That's the more honest global comparison, and it's negative.
The up capture of 159.83% is the standout number. The strategy doesn't just keep pace with FTSE gains, it amplifies them by more than half again. That reflects the strategy's rotational edge: buying beaten-down Energy, Consumer Cyclical, and Utilities that recover sharply when their cycle turns. But the down capture of 106.02% is above 100, so the portfolio falls slightly harder than the FTSE 100 in bad years. There's no downside protection here. The strategy wins by taking more risk in both directions and being paid for it on net, which is also visible in the beta of 1.147 and a volatility of 23.83% against the index's 14.19%.
Year-by-year returns
| Year | Strategy | FTSE 100 | Excess |
|---|---|---|---|
| 2000 | +18.30% | -7.37% | +25.67% |
| 2001 | -23.82% | -15.49% | -8.33% |
| 2002 | -26.02% | -23.16% | -2.86% |
| 2003 | +42.52% | +12.49% | +30.04% |
| 2004 | +17.43% | +7.47% | +9.96% |
| 2005 | +16.81% | +17.22% | -0.41% |
| 2006 | +25.05% | +11.08% | +13.97% |
| 2007 | -15.86% | +1.68% | -17.54% |
| 2008 | -37.59% | -28.91% | -8.68% |
| 2009 | +79.71% | +20.57% | +59.14% |
| 2010 | +10.98% | +9.34% | +1.65% |
| 2011 | -2.98% | -5.22% | +2.24% |
| 2012 | +17.01% | +5.74% | +11.27% |
| 2013 | -2.38% | +11.46% | -13.83% |
| 2014 | -3.76% | -2.53% | -1.23% |
| 2015 | -22.62% | -6.94% | -15.68% |
| 2016 | +55.89% | +17.80% | +38.10% |
| 2017 | +7.17% | +6.55% | +0.62% |
| 2018 | -10.99% | -11.95% | +0.96% |
| 2019 | +26.94% | +12.92% | +14.02% |
| 2020 | +20.22% | -13.58% | +33.80% |
| 2021 | +25.31% | +14.20% | +11.11% |
| 2022 | -13.28% | +0.65% | -13.94% |
| 2023 | +11.47% | +2.22% | +9.25% |
| 2024 | +13.43% | +6.97% | +6.46% |
| 2025 | +17.39% | +20.47% | -3.08% |
2000-2004: A strong start, then two bad years
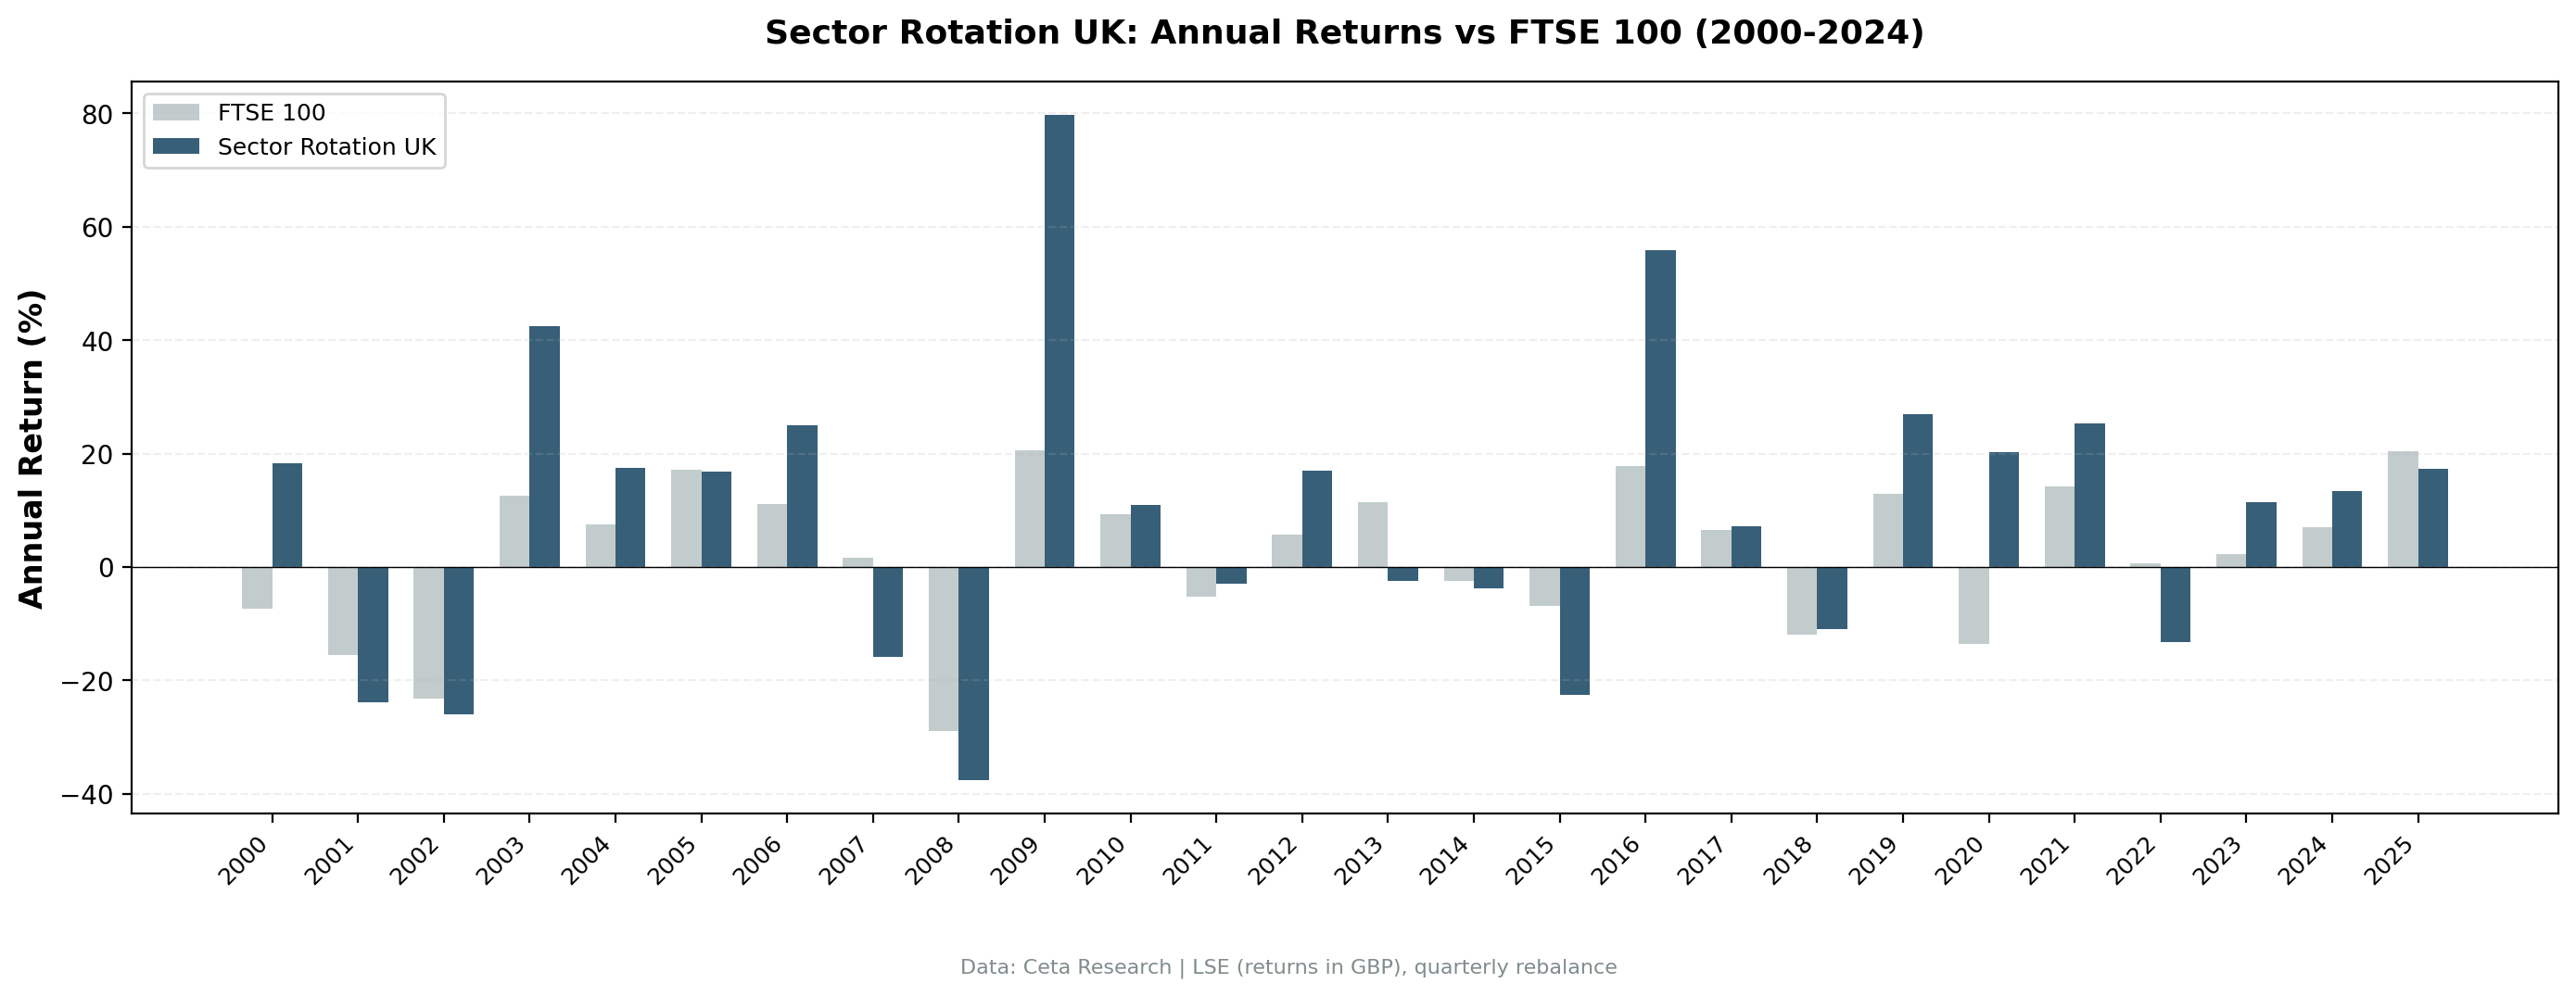
The strategy opened well. In 2000, the FTSE 100 fell -7.37% while the strategy returned +18.30%, a +25.67% excess. The dot-com bust hammered tech and telecom stocks globally, and the LSE's rotation into beaten-down defensives and commodity sectors sidestepped most of it.
Then the bear market caught up with it. 2001 was -23.82% against a FTSE that fell -15.49%. 2002 was -26.02% against -23.16%. Two consecutive years of losing more than an index that was itself falling hard. Buying whatever had underperformed over the previous 12 months, in a market where everything kept underperforming, produced no protection at all.
2003-2004 got it back: +42.52% and +17.43% against a recovering FTSE, for +30.04% and +9.96% of excess. Energy and Basic Materials, left for dead in 2001-2002, drove both years.
2009: The best year
2009 produced +79.71% vs FTSE 100 +20.57%. That's a 59-point gap, the largest in the record. After the financial crisis, Financial Services and Real Estate were two of the most battered sectors on the LSE. The UK had deep exposure to global banking through Barclays, HSBC, and Lloyds. When those sectors recovered in 2009, they recovered hard. The strategy had rotated in at the bottom.
2007: The single worst year
2007 was -15.86% while the FTSE 100 gained 1.68%, a -17.54% excess and the worst single year in the record. The index held up through the first cracks in the credit cycle. The strategy did not. This is the failure mode of a backward-looking signal at a cycle top: what looked cheap in 2006 was cheap for a reason that only became visible later.
2013-2015: The worst stretch
The 2013-2015 period is the most damaging run of consecutive years:
- 2013: -2.38% portfolio vs +11.46% FTSE, -13.83% excess
- 2014: -3.76% portfolio vs -2.53% FTSE, -1.23% excess
- 2015: -22.62% portfolio vs -6.94% FTSE, -15.68% excess
What happened. Oil fell roughly 60% from mid-2014 to early 2016. Iron ore and copper fell sharply too. The strategy kept reloading into Energy and Basic Materials, exactly what the signal required, and both kept declining. These are the years where mean reversion became a value trap. The sectors were cheap because the structural headwind was real, not temporary.
2016: Post-Brexit recovery
2016 returned +55.89% vs FTSE 100 +17.80%, a +38.10% excess and the second-best year in the record. The Brexit vote in June 2016 hammered sterling and initially hurt UK equities in GBP terms. But the devaluation of sterling was a tailwind for FTSE-listed multinationals that earn in USD. Energy majors like BP and Shell, which report and pay dividends in USD, saw GBP-translated earnings jump. The strategy was well-positioned in Energy going into the year, and commodity prices bottomed in early 2016 and recovered sharply.
2020 and beyond: Continued outperformance
2020 was +20.22% for the strategy while the FTSE 100 dropped -13.58%, a +33.80% excess. The COVID crash hit the FTSE hard given its weight in banks, travel, and energy. The strategy's rotation avoided the worst of it and captured the recovery. From 2019 to 2024, the strategy beat the FTSE 100 in 5 of 6 years, the exception being 2022 at -13.94% excess.
Backtest Methodology
| Parameter | Choice |
|---|---|
| Universe | LSE, Market Cap > £500M |
| Signal | Bottom 2 sectors by equal-weighted 12-month trailing return |
| Portfolio | All qualifying stocks in selected sectors, equal weight |
| Rebalancing | Quarterly (January, April, July, October) |
| Cash rule | Hold cash if < 5 sectors qualify or < 10 stocks pass filters |
| Execution | Next available close after the signal date |
| Transaction costs | Size-tiered model |
| Benchmark | FTSE 100 (^FTSE) |
| Period | 2000-2025 (26 years, 104 quarters) |
| Data | Ceta Research (FMP financial data warehouse) |
Limitations
FTSE 100 is price-only. The benchmark used here is the FTSE 100 price return index, which excludes dividends. UK stocks have historically paid 3-4% annual dividend yields. A total-return FTSE 100 benchmark would be meaningfully higher, which would consume most of the strategy's stated excess of +4.96%. The more honest global comparison is against SPY (total return): UK strategy at 6.51% vs SPY at 8.02%, a -1.51% annual shortfall over 26 years.
Currency mismatch vs SPY. Returns are in GBP. When sterling weakens against the dollar (as it did sharply after Brexit), a GBP-denominated 6.51% CAGR looks weaker still to a USD-based investor.
No downside protection. Down capture is 106.02%, above 100. The strategy falls harder than the FTSE 100 in bad years and the max drawdown is deeper (-50.70% vs -43.69%). Every point of excess return comes from the up capture of 159.83%, which is another way of saying it comes from carrying more risk.
Energy concentration. Energy was selected in 33 of 104 quarters. This makes the strategy's performance heavily dependent on oil and commodity cycles. A strategy with 31% Energy exposure over 26 years isn't sector-diversified in any meaningful sense. When Energy recovers (2009, 2016), the portfolio wins. When it doesn't (2013-2015), losses compound.
LSE sector structure. The London Stock Exchange is disproportionately weighted toward Financials, Energy, Mining, and Pharmaceuticals. Tech is underrepresented. A sector rotation approach built on 12-month trailing returns on LSE is effectively rotating between commodity, financial, and real estate cycles. The low FTSE 100 baseline (1.55% CAGR price-only) makes outperformance easier to achieve than against a global total-return benchmark.
Brexit as a structural break. The 2016 Brexit vote changed UK market dynamics. Sterling devaluation helped multinationals in 2016 but created prolonged uncertainty for domestic-oriented UK stocks. A 26-year backtest spans two regulatory and currency regimes.
Survivorship bias. Exchange membership uses current profiles, not historical. Delisted companies, including failures, aren't tracked over time.
Costs are modelled, not measured. A size-tiered cost model is applied to every position, but bid-ask spread and market impact aren't. With 106 stocks and quarterly rebalancing, turnover is meaningful and real execution would reduce net returns.
Takeaway
Sector mean reversion on LSE large caps delivers 6.51% CAGR over 26 years, beating the FTSE 100 by +4.96% annually. The strategy beat the index in 63 of 104 quarters (60.58%) and in 16 of 26 calendar years.
The honest framing has two parts, and they point in opposite directions. Against the FTSE 100 price index (1.55% CAGR), the strategy looks strong. Against SPY (8.02%), it loses by -1.51% annually. Add dividends back to the FTSE and most of the local edge goes with them. A UK investor who wanted equity exposure over these 26 years was better served by a global tracker than by this rotation.
The core driver is the LSE's structural tilt toward commodity cycles and Financials. When those sectors fall (Energy in 2014-2015, Financials in 2008), the strategy loads up at depressed prices. When they recover (2009, 2016), the returns are large. Two years do a lot of the work: 2009 and 2016 supply 97 of the 183 points of cumulative annual excess, better than half of it from 8% of the sample. What you're buying for the rest of the time is a -50.70% drawdown and a Sharpe of 0.126.
Part of a Series
This analysis is part of our Sector Mean Reversion global exchange comparison. We tested the same strategy across multiple exchanges: - Sector Mean Reversion on US Stocks (NYSE + NASDAQ + AMEX) - Sector Mean Reversion on Indian Stocks (NSE) - Sector Mean Reversion on Korean Stocks (KSC) - Sector Mean Reversion on Taiwanese Stocks (TAI + TWO) - Sector Mean Reversion on Swedish Stocks (STO) - Sector Mean Reversion: Global Exchange Comparison
References
- Moskowitz, T. & Grinblatt, M. (1999). "Do Industries Explain Momentum?" Journal of Finance, 54(4), 1249-1290.
Run This Screen Yourself
Via Python:
import requests, time

API_KEY = "your_api_key"  # get one at cetaresearch.com
BASE = "https://tradingstudio.finance/api/v1"

query = """
WITH prices AS (
    SELECT e.symbol, e.adjClose, CAST(e.date AS DATE) AS trade_date
    FROM stock_eod e
    JOIN profile p ON e.symbol = p.symbol
    WHERE p.sector IS NOT NULL AND p.sector != ''
      AND p.marketCap > 500000000
      AND p.exchange IN ('LSE')
      AND CAST(e.date AS DATE) >= CURRENT_DATE - INTERVAL '400' DAY
      AND e.adjClose IS NOT NULL AND e.adjClose > 0
),
recent AS (
    SELECT symbol, adjClose AS recent_price
    FROM prices
    QUALIFY ROW_NUMBER() OVER (PARTITION BY symbol ORDER BY trade_date DESC) = 1
),
year_ago AS (
    SELECT symbol, adjClose AS old_price
    FROM prices
    WHERE trade_date <= CURRENT_DATE - INTERVAL '252' DAY
    QUALIFY ROW_NUMBER() OVER (PARTITION BY symbol ORDER BY trade_date DESC) = 1
),
stock_returns AS (
    SELECT r.symbol, pr.sector,
        (r.recent_price / ya.old_price - 1) * 100 AS return_12m
    FROM recent r
    JOIN year_ago ya ON r.symbol = ya.symbol
    JOIN profile pr ON r.symbol = pr.symbol
    WHERE ya.old_price > 0 AND r.recent_price > 0
      AND (r.recent_price / ya.old_price - 1) BETWEEN -0.99 AND 5.0
)
SELECT pr.sector,
    ROUND(AVG(sr.return_12m), 2) AS avg_return_12m_pct,
    COUNT(DISTINCT sr.symbol) AS n_stocks,
    ROW_NUMBER() OVER (ORDER BY AVG(sr.return_12m) ASC) AS rank_worst
FROM stock_returns sr
JOIN profile pr ON sr.symbol = pr.symbol
GROUP BY pr.sector
HAVING COUNT(DISTINCT sr.symbol) >= 5
ORDER BY avg_return_12m_pct ASC
"""

resp = requests.post(f"{BASE}/data-explorer/execute", headers={
    "X-API-Key": API_KEY, "Content-Type": "application/json"
}, json={
    "query": query,
    "options": {"format": "json", "limit": 100},
    "resources": {"memoryMb": 16384, "threads": 6}
})
task_id = resp.json()["taskId"]

while True:
    result = requests.get(f"{BASE}/tasks/data-query/{task_id}",
                          headers={"X-API-Key": API_KEY}).json()
    if result["status"] in ("completed", "failed"):
        break
    time.sleep(2)

print("LSE sector rankings (worst to best, 12-month return):")
for r in result["result"]["rows"]:
    flag = " <-- BUY" if r["rank_worst"] <= 2 else ""
    print(f"#{r['rank_worst']} {r['sector']:30s} {r['avg_return_12m_pct']:+.1f}%  ({r['n_stocks']} stocks){flag}")
Get your API key at cetaresearch.com. The full backtest code (Python + DuckDB) is on GitHub.
Data: Ceta Research, FMP financial data warehouse. Universe: LSE, market cap > £500M. Quarterly rebalance, equal weight, 2000-2025. Returns in GBP. Benchmark: FTSE 100 (^FTSE, price return). Past performance does not guarantee future results.
Past performance does not guarantee future results. This is educational content, not investment advice.

