
Small-Cap Growth in China: +7.03% Over the SSE Composite
Chinese small-cap growth beat the SSE Composite by 7.03 points a year, the largest local excess in our 14-market study. It also drew down 72% and the benchmark it beat returned 2.43%.

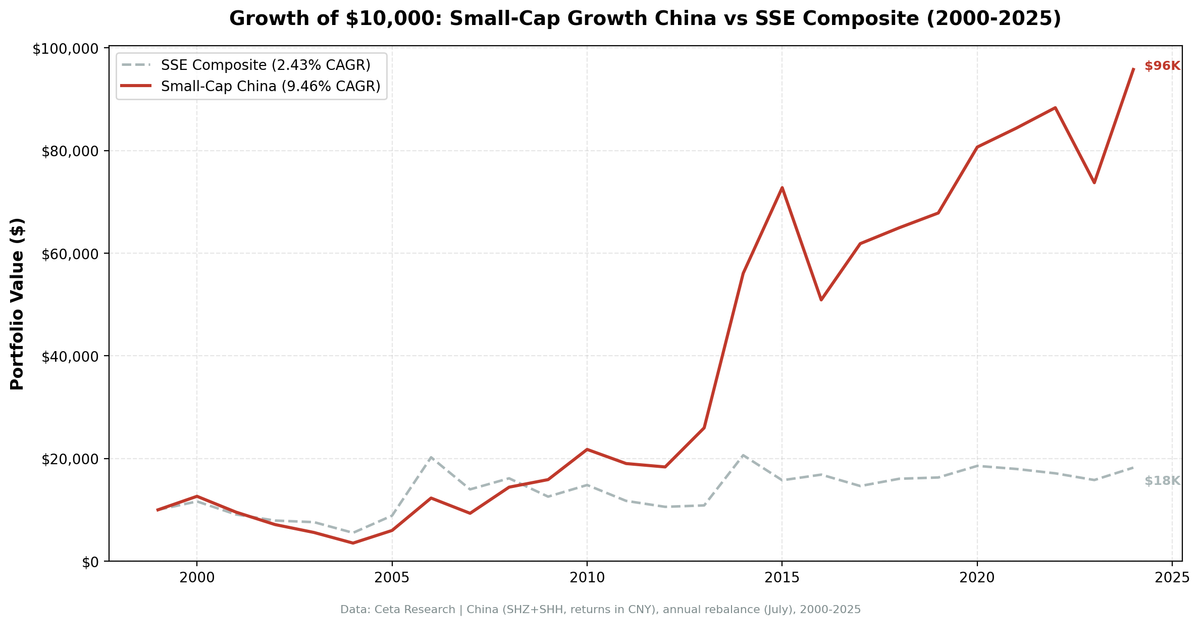
China produced the largest local excess return of any market we tested. $10,000 invested in Chinese small-cap growth stocks in 2000 became $95,810 by end of 2024. That's 9.46% CAGR against an SSE Composite that managed 2.43%, a gap of +7.03 percentage points a year sustained across a quarter century.
Contents
- What We Tested
- What We Found
- The Low Down Capture
- Annual Returns: 25 Years
- The Drawdown Reality
- Why the Premium Exists
- Limitations
- Takeaway
- References
Before you build a portfolio around that number, read this carefully. The maximum drawdown is -72.15%, two of the twenty-five years supplied a disproportionate share of the return, and the benchmark it beat was one of the weakest major indices in the world.
Data: FMP financial data warehouse, 2000-2025. Updated August 2026.
What We Tested
The strategy selects small-cap A-share stocks across SHZ (Shenzhen) and SHH (Shanghai) with revenue momentum:
- Market cap: 5%-200% of the exchange threshold (small-cap range)
- Revenue growth: >15% year-over-year (fiscal year)
- Profitability: Net income > 0
- Leverage: Debt-to-equity < 2.0
- Selection: Top 30 by revenue growth, equal-weighted
- Rebalancing: Annual in July, 45-day filing lag, entry at the next-day close
- Benchmark: SSE Composite, in renminbi
Data from the FMP financial data warehouse, 2000-2025. Average portfolio size 19.9 stocks, fully invested in all 25 years. Full methodology: METHODOLOGY.md.
What We Found
The consistency is better than the volatility suggests. A 68% win rate, 17 of 25 years, is the highest in the study. Up capture of 127% against down capture of 47% is a genuinely good asymmetry, and the Jensen's alpha of +7.02% on a beta of 0.92 says the excess isn't just leverage.
The benchmark is the reason the excess is so large. The SSE Composite returned 2.43% a year over 25 years with a Sharpe ratio of -0.002. China's A-share market has had extreme cycles without sustained compounding, largely because the index is dominated by state-owned large caps. The small-cap growth strategy did meaningfully better than that, which is a real finding about Chinese equities and a modest one about the size premium.
The middle decade carried it. From 2010 to 2017 the strategy won 7 of 8 years by an average of 18.7 percentage points. The 2000s were nearly flat in relative terms (5 wins in 10, averaging +3.3 points) and included four consecutive losing years. Since 2018 the average excess has been +3.8 points.
2014: +115.90%. An A-share mania driven by margin lending expansion, government signals of support, and retail speculation. The rally began in Q3 2014 and went vertical by year-end, with small-cap growth stocks at the centre of it. The SSE Composite itself rose 89.99% that year, so the excess was +25.91%.
2006: +105.59%, and a rare loss. The Shanghai Composite rose 128.14% that year, more than the portfolio, producing a -22.55% excess. When the state-owned large caps rally hardest, this strategy underperforms.
These aren't data artifacts. They happened. But they represent the kind of extreme event that's hard to systematically exploit. Position sizing, liquidity and emotional discipline all become acute problems when a market doubles in a year.
The Low Down Capture
Down capture of 46.7% means the portfolio averaged less than half the losses in years when the SSE Composite fell. In the 13 benchmark-down years, the index averaged -15.55% while the portfolio averaged -7.27%.
2008 is the clearest example: +54.66% for this portfolio while the SSE Composite gained 15.41%. The global financial crisis was in full swing and US markets were in freefall, but Chinese A-shares rallied on a four trillion yuan government stimulus package injected into domestic infrastructure and consumption. Foreign investors couldn't easily access A-shares at scale in 2008, so the market moved on domestic flows.
This decorrelation isn't unique to 2008. Chinese monetary and fiscal policy doesn't coordinate with the US cycle. It cuts both ways: China sold off hard in 2001-2004 while the rest of the world was recovering, with four consecutive losses of 24.40%, 25.34%, 21.65% and 37.03%.
Annual Returns: 25 Years
| Year | Strategy | SSE Composite | Excess |
|---|---|---|---|
| 2000 | +26.4% | +16.4% | +10.0% |
| 2001 | -24.4% | -21.8% | -2.6% |
| 2002 | -25.3% | -13.1% | -12.3% |
| 2003 | -21.7% | -3.9% | -17.8% |
| 2004 | -37.0% | -27.3% | -9.7% |
| 2005 | +70.0% | +60.6% | +9.4% |
| 2006 | +105.6% | +128.1% | -22.6% |
| 2007 | -24.2% | -30.9% | +6.7% |
| 2008 | +54.7% | +15.4% | +39.3% |
| 2009 | +10.2% | -22.1% | +32.3% |
| 2010 | +37.0% | +18.0% | +19.0% |
| 2011 | -12.7% | -20.9% | +8.2% |
| 2012 | -3.5% | -9.9% | +6.4% |
| 2013 | +41.5% | +2.6% | +38.9% |
| 2014 | +115.9% | +90.0% | +25.9% |
| 2015 | +29.8% | -23.6% | +53.4% |
| 2016 | -30.1% | +6.9% | -37.0% |
| 2017 | +21.5% | -13.2% | +34.7% |
| 2018 | +5.0% | +9.7% | -4.7% |
| 2019 | +4.4% | +1.5% | +2.9% |
| 2020 | +18.9% | +13.9% | +5.1% |
| 2021 | +4.6% | -3.2% | +7.8% |
| 2022 | +4.7% | -4.7% | +9.5% |
| 2023 | -16.5% | -7.6% | -8.9% |
| 2024 | +29.9% | +15.3% | +14.6% |
Return years run July to July, matching the rebalance date. Best year: 2014 (+115.90%). Worst year: 2004 (-37.03%). Best excess: 2015 (+53.38%). Worst excess: 2016 (-36.98%).
The 2001-2004 stretch is four consecutive years of significant losses. Staying invested through that would have tested any investor.
The Drawdown Reality
-72.15% maximum drawdown. This is the number that should anchor your position sizing.
It compounded across multiple years of losses, mostly the 2001-2004 period. Peak to trough, the portfolio lost nearly three-quarters of its value before recovering, and the recovery required 2005 (+69.98%) and 2006 (+105.59%) to arrive, which you had no way of knowing at the trough.
For comparison, the SSE Composite's own worst drawdown over the same period was -52.53%, and the S&P 500's was -38.01%. The strategy's additional 20 points against its own benchmark reflect the leverage effect of holding smaller companies.
A 5-10% allocation within a global portfolio is supportable if you understand that profile. A concentrated position is not, for most investors.
Why the Premium Exists
China's A-share market has structural features that preserve inefficiency:
Limited foreign access. Foreign investors historically had restricted access to A-shares through QFII quotas, which limited the arbitrage capital available to price away obvious inefficiencies.
Retail dominance. Chinese equity markets have a high proportion of retail investors. That amplifies momentum, creates bubble dynamics, and generates the mispricings a systematic strategy can exploit.
Thin coverage at the small-cap end. Even large domestic sell-side firms concentrate coverage on large caps and state-owned enterprises. The small-cap growth universe is followed lightly.
A weak index to beat. The SSE Composite is heavily weighted toward state-owned enterprises whose earnings growth has lagged the broader economy for two decades. A portfolio of profitable, growing private companies outperforming that index is close to a structural feature of the market rather than an anomaly.
The same retail dominance that drives 100% rally years drives 30% crash years on sentiment shifts.
Limitations
- A-share access: Foreign investors historically faced restrictions on A-share investment. Realising these returns as an international investor would not have been straightforward.
- Currency: Returns are in renminbi. USD investors face exchange rate exposure on top.
- Two years carry a lot: Remove 2014 and 2006 and the return profile weakens substantially.
- Liquidity: Chinese small-caps can trade with wide spreads. Annual rebalancing of a 20-stock portfolio faces meaningful transaction costs beyond the size-tiered ones modelled here.
- Regulatory risk: Chinese securities regulation can change rapidly. The 2021 crackdowns on education and technology show that risk is real and material.
- Fund contamination: Excluding closed-end funds and ETFs moves the Chinese result by +0.04pp of CAGR. China is one of the cleanest markets on this measure. See the US post, where the effect is 3.6 points.
Takeaway
The Chinese small-cap growth premium is the largest local excess in this study: +7.03% a year over 25 years, a 68% win rate, and a 127/47 up-down capture split. Those numbers are not noise.
They are also measured against an index that returned 2.43% a year with a negative Sharpe ratio. The honest framing is that profitable, growing Chinese private companies substantially outperformed an index dominated by state-owned large caps, consistently, for 25 years. That's a real and useful finding. It's a claim about the composition of the SSE Composite as much as about the size premium.
In absolute terms, 9.46% a year is a good result, third-best in our study. It came with a -72% drawdown and four consecutive losing years at the start. Size it for the drawdown, not for the headline excess.
References
- Banz, R. (1981). "The Relationship Between Return and Market Value of Common Stocks." Journal of Financial Economics, 9(1), 3-18.
- Fama, E. & French, K. (1992). "The Cross-Section of Expected Stock Returns." Journal of Finance, 47(2), 427-465.
- Fama, E. & French, K. (1993). "Common Risk Factors in the Returns on Stocks and Bonds." Journal of Financial Economics, 33(1), 3-56.
- Van Dijk, M. (2011). "Is size dead? A review of the size effect in equity returns." Journal of Banking & Finance, 35(12), 3263-3274.
Data: Ceta Research (FMP financial data warehouse), 2000-2025. Full methodology: METHODOLOGY.md. Past performance does not guarantee future results. This is educational content, not investment advice.

