
Small-Cap Growth Backtest US: 25 Years to Match the Index
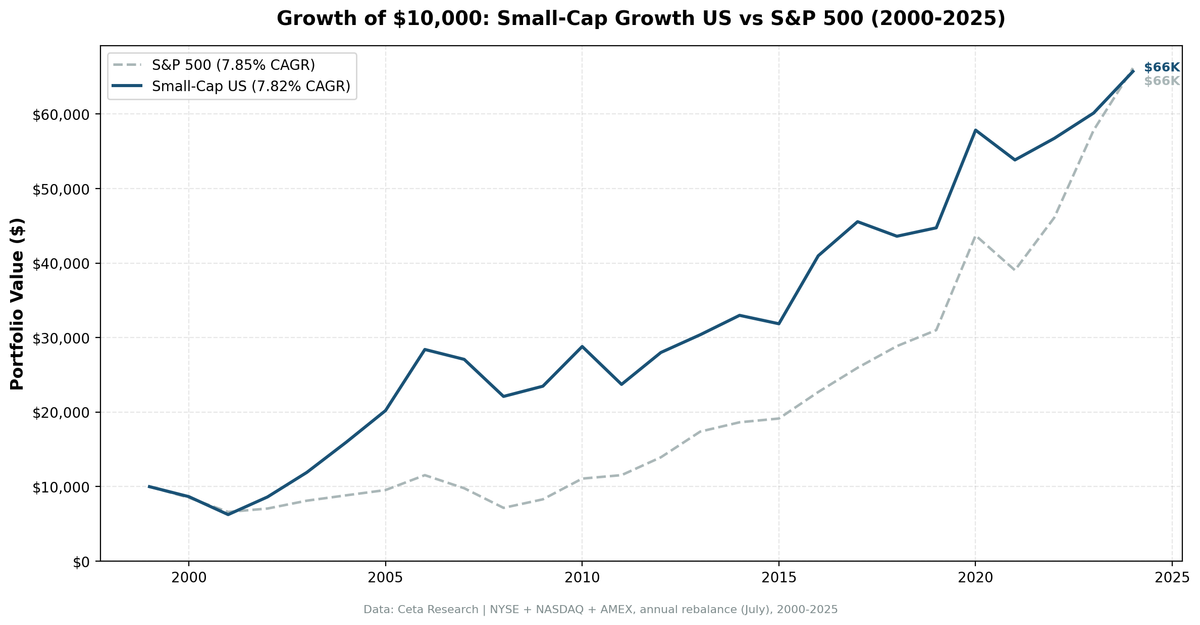
25 years of screening turned $10,000 into $65,721. The S&P 500 turned it into $66,167. And a third of the portfolio slots went to closed-end funds the screen mistook for growth companies.

The academic case for small-cap stocks is one of the most cited findings in finance. Banz (1981) documented it. Fama and French (1993) built it into their three-factor model. Decades of textbooks told investors that smaller companies deliver higher returns because they carry more risk and receive less analyst attention.
Contents
- What We Tested
- What We Found
- The Caveat That Matters Most
- Annual Returns: 25 Years
- When It Works, When It Fails
- Why the Premium Disappeared
- Comparison to Other Markets
- Limitations
- Run It Yourself
- Takeaway
- References
We ran 25 years of data on the US market to see if that's still true. The answer is more interesting than a simple yes or no.
$10,000 invested in 2000 using this strategy became $65,721 by end of 2024. The S&P 500 turned the same $10,000 into $66,167. After a quarter century of screening, rebalancing, and paying transaction costs, the strategy landed $446 behind a buy-and-hold index fund. That's -0.03% a year.
The premium didn't vanish evenly. It was large and consistent from 2002 through 2008, then disappeared. Here's the evidence.
Data: FMP financial data warehouse, 2000-2025. Updated August 2026.
What We Tested
The strategy screens for small-cap US stocks showing genuine revenue momentum:
- Market cap: $50M to $2B (small-cap range, 5%-200% of the exchange threshold)
- Revenue growth: >15% year-over-year (fiscal year)
- Profitability: Net income > 0 (no money-losers)
- Leverage: Debt-to-equity < 2.0 (avoiding overleveraged names)
- Selection: Top 30 by revenue growth, equal-weighted
- Rebalancing: Annual in July, with a 45-day filing lag to avoid look-ahead bias
- Execution: Next-day close after each rebalance date, so the screen can't trade on a price it hasn't seen
The signal blends the size factor (Fama & French, 1993) with a growth quality filter. We're not just buying small companies, we're buying small companies that are actually growing profitably without excessive debt.
Universe covers NYSE, NASDAQ, and AMEX. Data from the FMP financial data warehouse, 2000-2025. Backtests run on the Ceta Research platform. Full methodology at METHODOLOGY.md.
You can run the exact stock selection query here: cetaresearch.com/data-explorer?q=EbJ5tom816
What We Found
The headline number is -0.03%/yr excess return over 25 years. A rounding error either way. But the shape of the returns matters more than the average.
The strategy took less risk to get there. Beta against the S&P 500 was 0.78. Up capture was 96.6%, down capture 79.1%. The portfolio kept nearly all of the index's gains while absorbing about four-fifths of its losses, and its maximum drawdown of -37.50% was slightly shallower than the index's -38.01%. On a CAPM basis that produces a positive Jensen's alpha of +1.28%/yr.
But you paid for it in volatility and consistency. Annualized volatility was 19.20% against the index's 16.63%, so the Sharpe ratio came in lower at 0.303 versus 0.352. The win rate was 44%: the strategy beat the S&P 500 in 11 of 25 years. The Sortino ratios are effectively tied, 0.632 against 0.628.
The worst excess year was 2011 (-21.8% relative to the index), when the portfolio fell 17.7% while the S&P 500 gained 4.2%. The best was 2002 (+31.0% excess), when the portfolio gained 37.9% into the teeth of a bear market that took the index up only 6.9% from the July 2002 rebalance.
The early vs late split is the real finding. From 2002 through 2008, the strategy beat the index seven years running, by an average of more than 19 percentage points. From 2009 through 2024, it beat the index in 3 of 16 years. This pattern fits what we'd expect from a premium that gets discovered and arbitraged away. Small-cap ETFs, factor funds, and quant strategies now systematically target these stocks. The inefficiency that created the premium no longer exists at the scale it once did.
The Caveat That Matters Most
There's a problem with the US universe that we need to put in front of you rather than in a footnote.
The screen runs over every company with a filing in the database, and closed-end funds and exchange-traded funds file too. A closed-end fund books its investment income as revenue, so when its holdings mark up, it looks like a company that grew revenue 40% and turned a profit. Nothing in a market-cap, revenue-growth, net-income and debt-to-equity screen excludes it.
They were a rounding error early on and then they took over. Funds and ETFs were 0% of the portfolio from 2000 to 2004, under 12% through 2012, then 33% in 2013, 70% in 2018, and 84% in 2020. Across the full 25 years they filled 32% of all portfolio slots. For the last decade, this is not a small-cap growth stock portfolio. It's mostly a basket of funds.
Rerunning with funds and ETFs excluded gives 4.22% CAGR, -3.63%/yr against the S&P 500, and a Sharpe of 0.087 instead of 0.303. The funds didn't earn more (6.6% average annual return against 8.8% for the operating companies), they cushioned. In 2015 the operating companies lost 18.1% while the funds gained 16.1%. In 2018 the companies lost 20.8% while the funds gained 2.7%. Damping the bad years lifts the compounded return even when it lowers the average one.
We report the unfiltered number as the headline because it's the same universe definition used across all 14 markets in this study, and changing it for one market would break the comparison. But read the headline correctly: US small-cap growth stocks did not match the index. US small-cap growth stocks plus an accidental allocation to closed-end funds did. The live screen linked above excludes funds, so it shows what the strategy is actually supposed to buy.
Annual Returns: 25 Years
| Year | Strategy | S&P 500 | Excess |
|---|---|---|---|
| 2000 | -13.4% | -14.8% | +1.4% |
| 2001 | -27.8% | -22.5% | -5.4% |
| 2002 | +37.9% | +6.9% | +31.0% |
| 2003 | +38.3% | +14.9% | +23.3% |
| 2004 | +33.9% | +8.9% | +25.1% |
| 2005 | +26.6% | +8.0% | +18.7% |
| 2006 | +40.6% | +21.0% | +19.6% |
| 2007 | -4.7% | -15.2% | +10.5% |
| 2008 | -18.4% | -26.9% | +8.5% |
| 2009 | +6.2% | +16.0% | -9.8% |
| 2010 | +22.7% | +33.6% | -10.9% |
| 2011 | -17.7% | +4.2% | -21.8% |
| 2012 | +18.1% | +20.7% | -2.7% |
| 2013 | +8.5% | +24.7% | -16.2% |
| 2014 | +8.6% | +7.2% | +1.4% |
| 2015 | -3.4% | +2.7% | -6.1% |
| 2016 | +28.6% | +18.6% | +10.1% |
| 2017 | +11.2% | +14.3% | -3.2% |
| 2018 | -4.3% | +11.2% | -15.5% |
| 2019 | +2.6% | +7.4% | -4.9% |
| 2020 | +29.3% | +41.0% | -11.7% |
| 2021 | -6.9% | -10.7% | +3.8% |
| 2022 | +5.4% | +18.1% | -12.7% |
| 2023 | +6.0% | +25.4% | -19.5% |
| 2024 | +9.3% | +14.4% | -5.1% |
Return years run July to July, matching the rebalance date, so a "2008" row covers July 2008 to July 2009.
The 2002-2008 stretch is the entire case for the strategy. Seven consecutive years of outperformance, none smaller than 8.5 percentage points. That was before small-cap factor investing became a crowded trade. After 2008, only 2014, 2016, and 2021 beat the index.
When It Works, When It Fails
The strategy's strongest stretch was 2002-2008, and it held up well in the 2007-2008 crash: -4.7% and -18.4% against the index's -15.2% and -26.9%. That's the low-beta profile doing its job. It also had a solid 2016 and a decent 2021.
It fails persistently in the era of mega-cap dominance. 2010, 2013, 2018, 2020, 2022, and 2023 all saw large-cap growth pull the index higher while small-caps struggled to keep up. The 2011 result (-17.7% against the index's +4.2%) shows how fast a small-cap portfolio can decouple from a rising index.
The pattern is consistent: this strategy earns its keep when the index is falling or flat and gives it back when mega-caps lead.
Why the Premium Disappeared
Van Dijk (2011) posed the question directly: "Is size dead?" His review found the size premium had weakened substantially since the 1980s. There are a few plausible reasons:
Capacity crowding. Small-cap factor funds, ETFs like IWM, and systematic quant strategies now hold large portions of the small-cap universe. When capital floods into an inefficiency, the inefficiency shrinks.
Reporting improvements. The original size premium partly reflected information asymmetry. Analyst coverage was thin for small companies. Now, data is cheap, screens are commoditized, and even retail investors run the same filters.
Survivorship in the premium. Early studies may have overstated returns through survivorship bias in databases. Modern replications with cleaner data show smaller effects.
The growth filter specifically. High-revenue-growth small-caps attract momentum traders. When momentum works, the strategy does well. When it doesn't (2011, 2013, 2023), the portfolio lags badly.
Comparison to Other Markets
The US isn't the whole story. Measured against each market's own index, the strategy beat the local benchmark in 8 of the 14 exchanges we tested. Only 5 of those 8 keep the edge once you allow for the dividends those price indices leave out.
China (SHZ/SHH): 9.46% CAGR, +7.03% against the SSE Composite. Switzerland (SIX): 7.45% CAGR, +5.71% against the SMI. Canada (TSX): 8.24% CAGR, +4.29% against the TSX Composite.
Read those with care. The local alpha is largest exactly where the local index was weakest: the SMI compounded at 1.74% over 25 years, the SSE Composite at 2.43%. Beating a flat benchmark isn't the same as making money. In absolute terms, only India, South Africa, China, Canada and the US cleared roughly 8% a year, and the US did it with the deepest, most liquid market of the group.
See our regional comparison post for the full cross-market breakdown.
Limitations
- Slippage and liquidity: Small-cap stocks can be illiquid. A 30-stock equal-weight portfolio rebalanced annually would face real transaction costs and market impact beyond the size-tiered costs modelled here.
- Filing lag: We apply a 45-day lag to avoid look-ahead bias, but some small-cap financials are filed later.
- Equal weighting: The strategy holds up to 30 stocks equally weighted, averaging 21.3 when invested. In practice, position sizing around liquidity constraints would reduce returns.
- Delisting bias: Stocks that were delisted are excluded from the universe in standard databases, which may slightly overstate returns.
- Closed-end funds in the universe: See the section above. Funds and ETFs filled 32% of portfolio slots over the full period and up to 84% in a single year. Excluding them takes the US result from 7.82% to 4.22% CAGR. This is the largest single caveat on the US number.
- Data revisions: FMP restates and backfills financial history. This run is 2.6pp of excess return above the same code run in March 2026, entirely from data revisions rather than a change in method. Backtests on vendor fundamentals are not fixed objects.
Run It Yourself
The stock selection query is publicly available: cetaresearch.com/data-explorer?q=EbJ5tom816
This runs against the live FMP financial data warehouse on the Ceta Research platform. You can modify the revenue growth threshold, leverage filter, or market cap bounds directly in SQL and re-run.
Takeaway
The US small-cap growth premium was real. It worked from roughly 1981 through 2008. Since then, systematic capital has priced it away, and a 25-year backtest now lands within a rounding error of the index.
Two things follow. First, even taken at face value, matching the index isn't a reason to run a screen: you can buy the index for three basis points. Three winning years out of the last 16 is not an encouraging record. Second, the face value is generous. Strip out the closed-end funds and ETFs that drifted into the portfolio and the strategy returns 4.22%, losing to the index by 3.63 percentage points a year.
If you're looking for the size premium against a local benchmark in 2025, look outside the US. Just check what that local benchmark actually returned, and what's actually in the portfolio, before you get excited about the excess.
References
- Banz, R. (1981). "The Relationship Between Return and Market Value of Common Stocks." Journal of Financial Economics, 9(1), 3-18.
- Fama, E. & French, K. (1992). "The Cross-Section of Expected Stock Returns." Journal of Finance, 47(2), 427-465.
- Fama, E. & French, K. (1993). "Common Risk Factors in the Returns on Stocks and Bonds." Journal of Financial Economics, 33(1), 3-56.
- Van Dijk, M. (2011). "Is size dead? A review of the size effect in equity returns." Journal of Banking & Finance, 35(12), 3263-3274.
Data: Ceta Research (FMP financial data warehouse), 2000-2025. Full methodology: METHODOLOGY.md. Past performance does not guarantee future results. This is educational content, not investment advice.

