
Yield Gap Strategy: 20-Market Backtest Results (2000-2025)
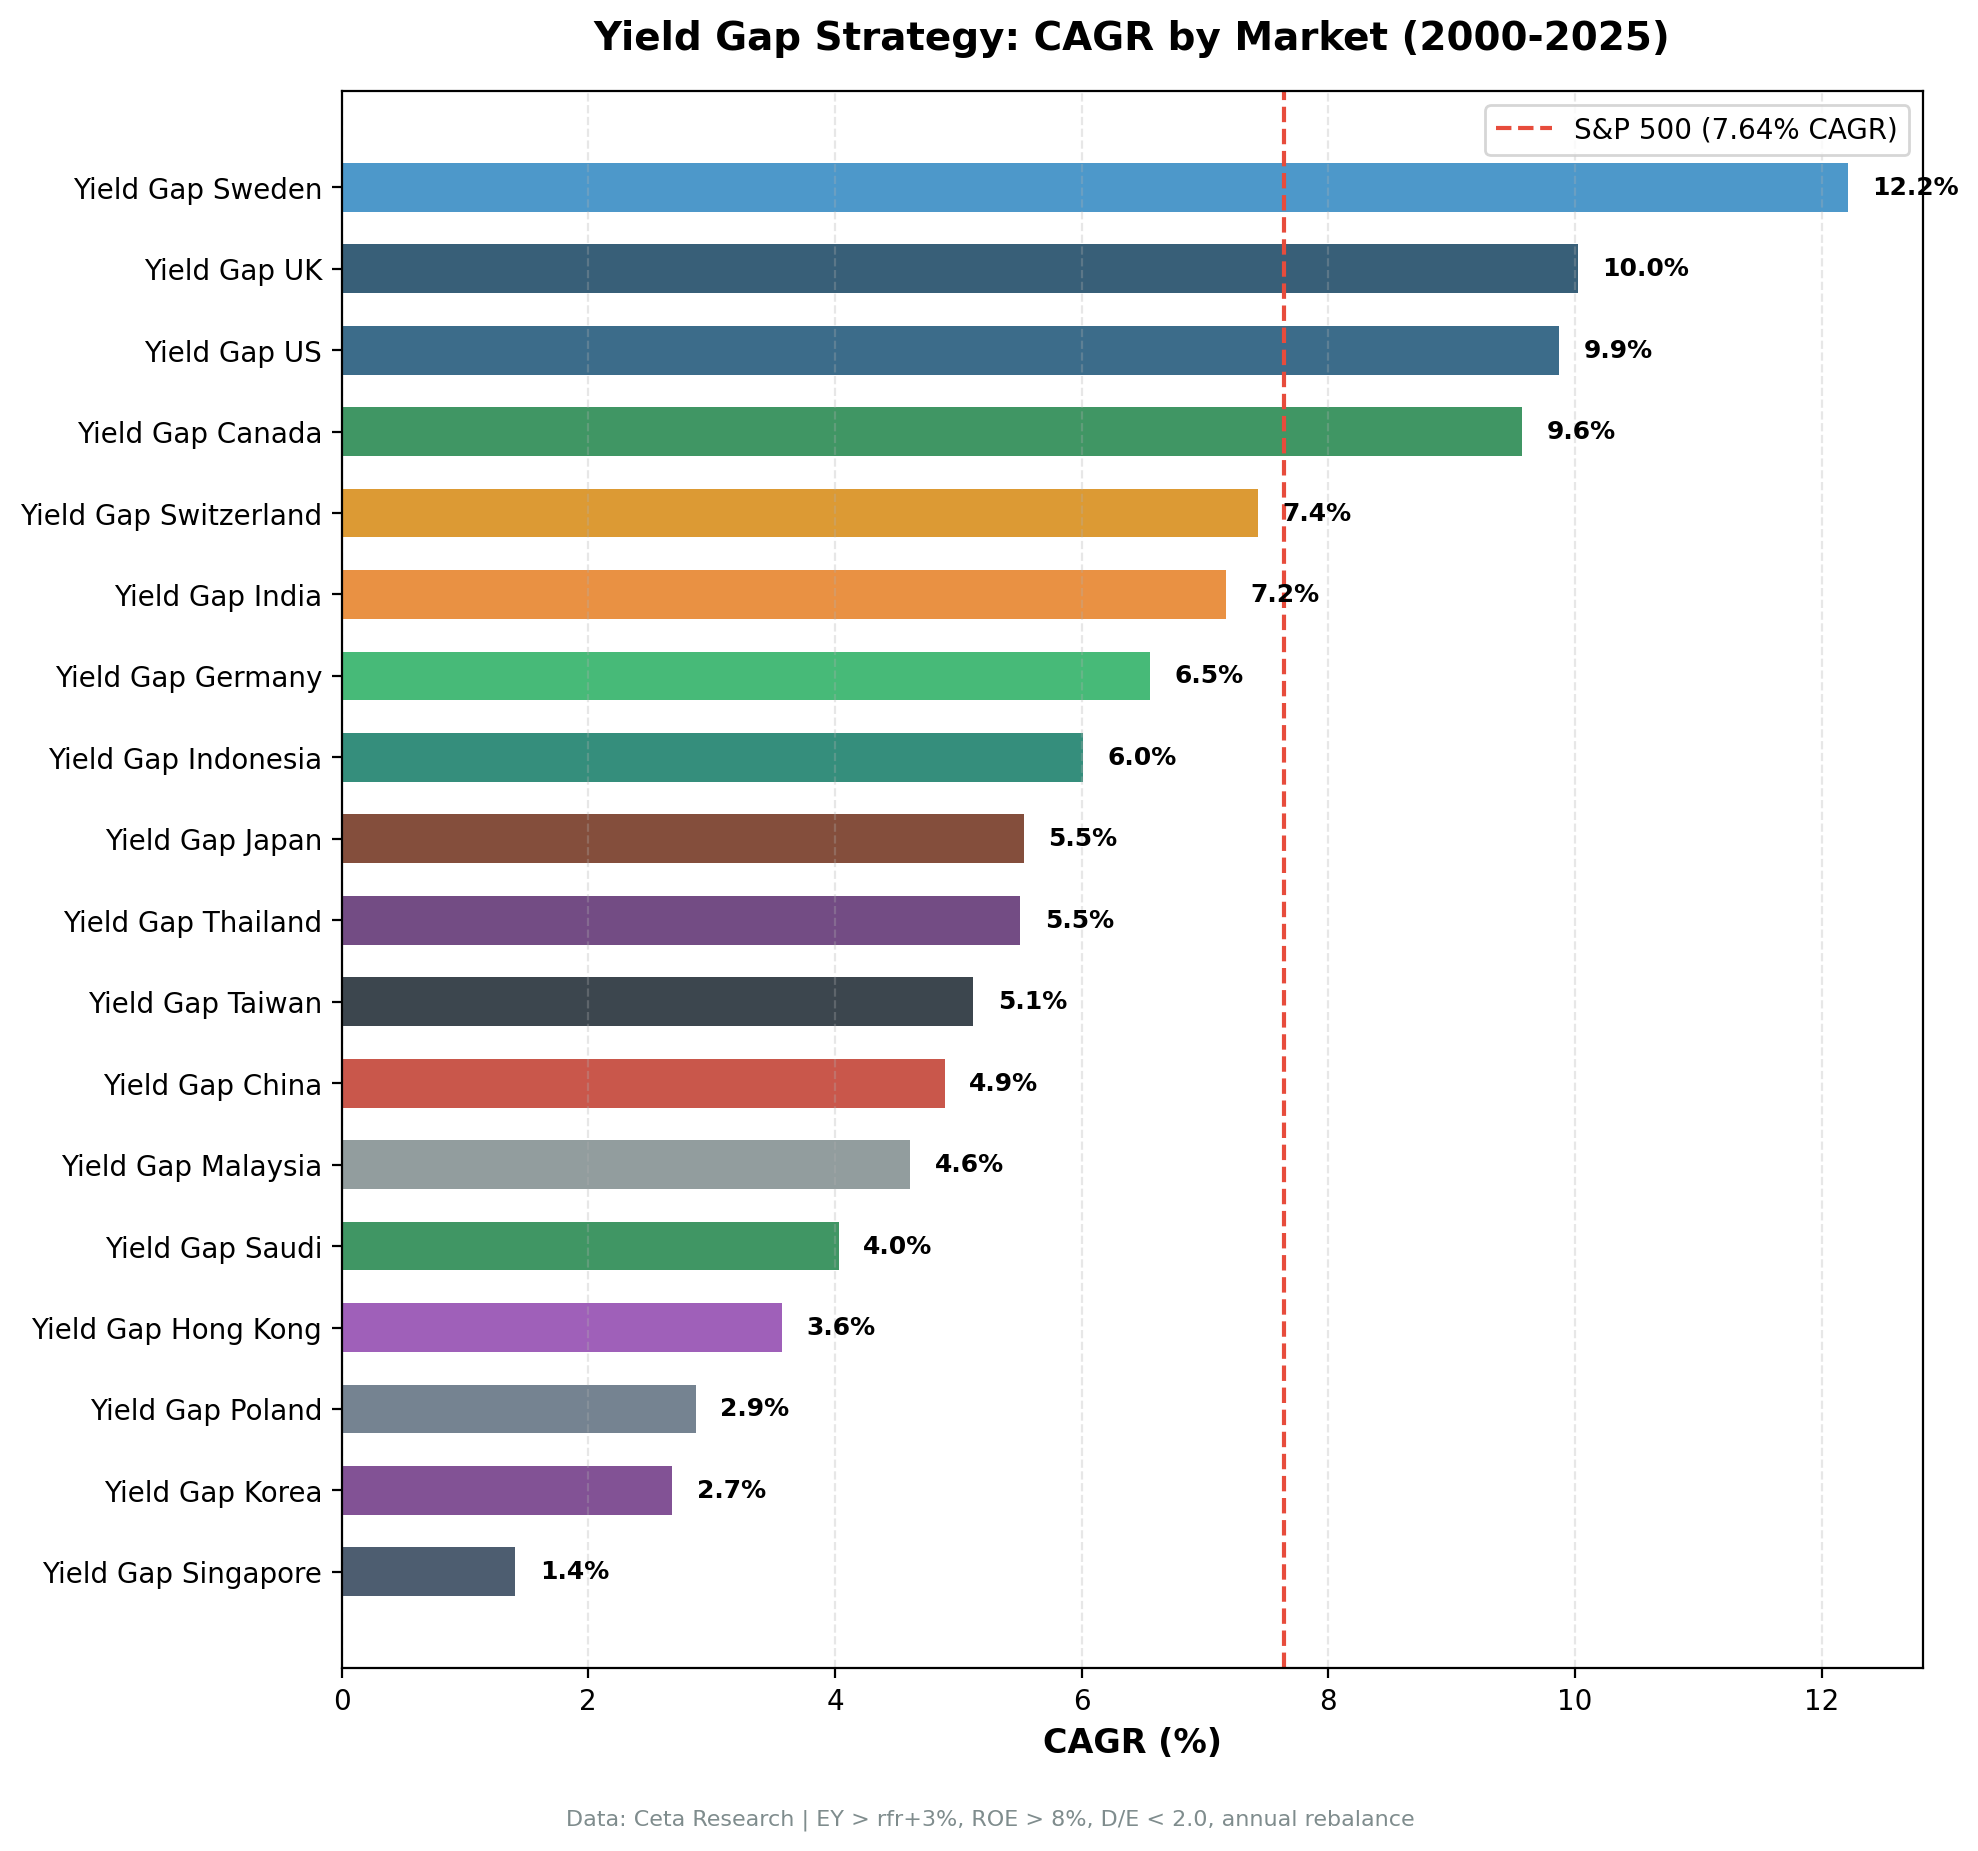
We ran the yield gap strategy across 20 equity markets from 2000 to 2025. Four full-window markets outperformed SPY: Sweden (+4.57%), UK (+2.38%), US (+2.23%), Canada (+1.93%). Against their own local indices the picture is better, 11 wins out of 14. Singapore was the weakest at -6.23% vs SPY.

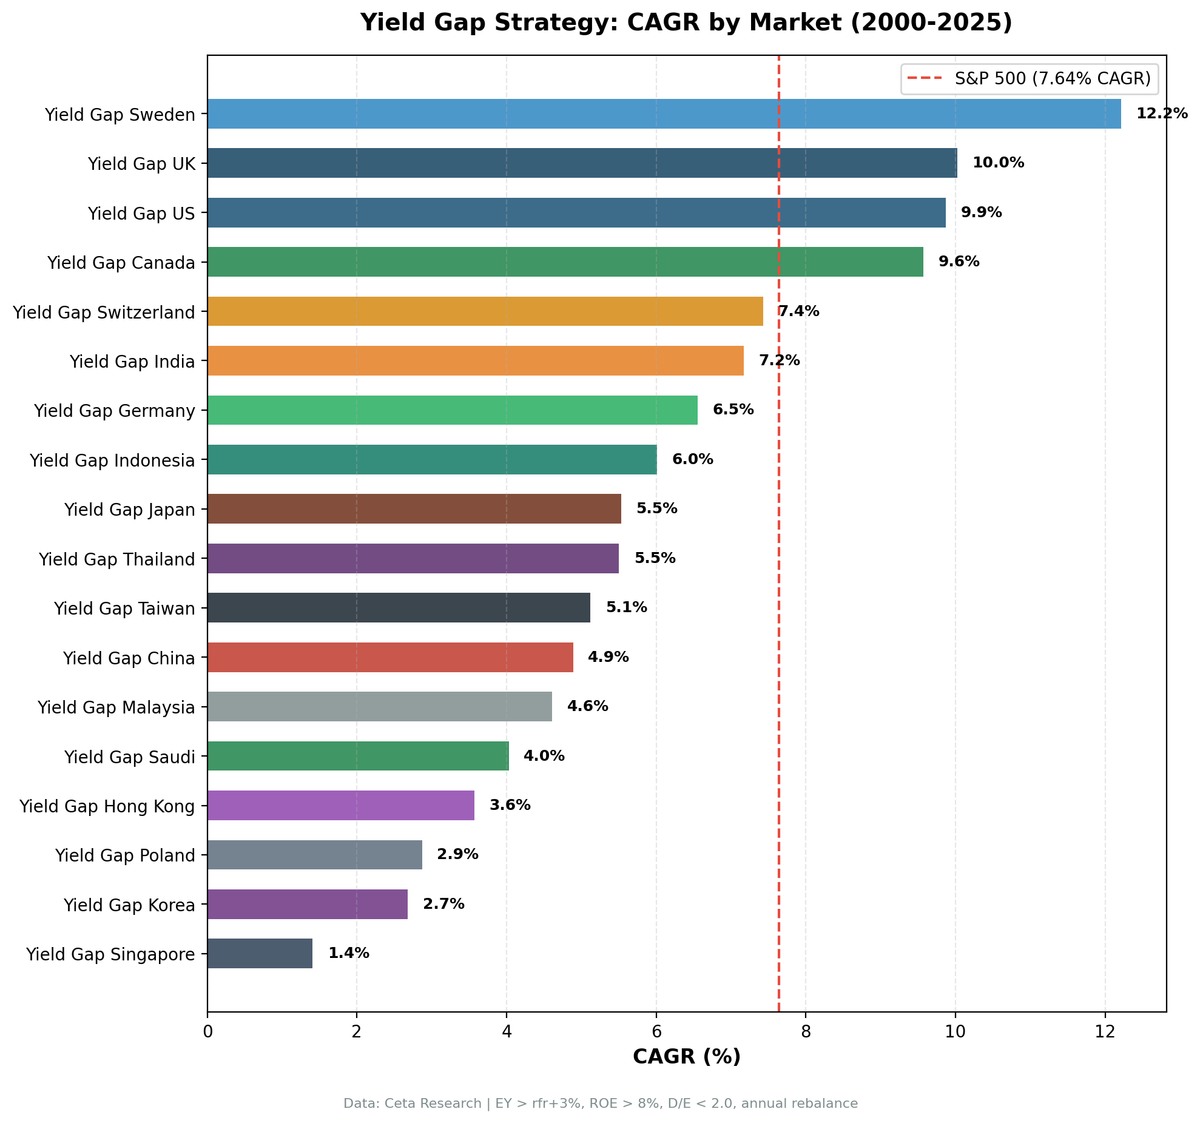
title: "Yield Gap Strategy: 20-Market Backtest Results (2000-2025)" slug: yield-gap-global-comparison publish_date: '2026-01-27' tags: [backtests, global-markets, value-investing, earnings-yield, equity-risk-premium, multi-market] post_access: public excerpt: "We ran the yield gap strategy across 20 equity markets from 2000 to 2025. Four full-window markets outperformed SPY: Sweden (+4.57%), UK (+2.38%), US (+2.23%), Canada (+1.93%). Against their own local indices the picture is better, 11 wins out of 14. Singapore was the weakest at -6.23% vs SPY." authors: [Swas] feature_image: 1_comparison_cagr.png feature_image_alt: "Yield Gap Strategy: CAGR by Market (2000-2025)"
Contents
- What We Tested
- Full Results Table
- The Pattern
- Notable Observations
- Run a Global Screen Yourself
- Limitations
Data: FMP financial data warehouse, 2000-2025. Updated September 2026.
The yield gap strategy buys stocks where earnings yields significantly exceed government bond rates, then filters for quality. It has an intuitive theoretical foundation: stocks offering a wide spread over risk-free rates should mean-revert toward fair value. We tested this across 20 equity markets to see where that theory holds, where it doesn't, and why.
The short answer depends entirely on what you benchmark against. Measured against SPY, only four markets with a full 25-year window beat it: Sweden, the UK, the US and Canada. Fifteen of the 20 came in below. Measured against each market's own local index, the strategy wins in 11 of the 14 markets that have one, including most of the Asian markets that look like failures on the SPY column. Both framings are in the table below, because they answer different questions.
What We Tested
Signal (per exchange): - Earnings yield > max(6%, regional_rfr + 3%), so the threshold adapts to each market's risk-free rate - Earnings yield < 50% (cap for distress/data errors) - ROE > 8% - D/E < 2.0
Effective thresholds by market: - US, Germany: 6.0% EY (rfr = 2%, floor binds) - Japan: 6.0% EY (rfr = 0.1%, floor binds by a wide margin) - UK: 6.5% EY (rfr = 3.5%) - Korea: 6.0% EY (rfr = 3%, floor binds) - India: 9.5% EY (rfr = 6.5%) - South Africa: 12.0% EY (rfr = 9%), excluded from content (92% cash)
Methodology: Annual rebalance, January. Top 30 stocks per exchange by highest earnings yield, equal weight. FY financial data with 45-day filing lag (point-in-time). Entry and exit both use the next available close after the rebalance date, not the signal-date close.
The 10-stock floor, and why it matters here. If fewer than 10 names can actually be bought at the rebalance date, the backtest holds cash for that year. The test is on names with a usable entry price, not on names the screen returned. Outside the US and Canada that distinction does real work: a screen can return a full 30 companies while only 7 or 8 of them have a tradeable price in the data, usually thinly traded foreign secondary listings. Averaging 8 stocks and calling it a diversified portfolio is how backtests flatter themselves. Every cash percentage in the table below reflects this stricter test, which is why several markets show cash years that earlier versions of this study did not.
Full details at github.com/ceta-research/backtests/blob/main/METHODOLOGY.md.
Full Results Table
| Exchange | EY Threshold | CAGR | SPY | Excess vs SPY | Sharpe | MaxDD | Cash% | Avg Stocks |
|---|---|---|---|---|---|---|---|---|
| STO (Sweden) | 6.0% | 12.21% | 7.64% | +4.57% | 0.424 | -43.49% | 16% | 24.1 |
| OSL (Norway)* | 6.0% | 10.74% | 7.64% | +3.10% | 0.774 | 0.00% | 60% | 15.2 |
| LSE (UK) | 6.5% | 10.02% | 7.64% | +2.38% | 0.344 | -31.85% | 8% | 14.3 |
| NYSE/NAS/AMEX (US) | 6.0% | 9.87% | 7.64% | +2.23% | 0.359 | -45.04% | 0% | 21.4 |
| TSX (Canada) | 6.0% | 9.57% | 7.64% | +1.93% | 0.354 | -45.39% | 0% | 21.9 |
| SIX (Switzerland) | 6.0% | 7.43% | 7.64% | -0.21% | 0.501 | -19.48% | 28% | 16.1 |
| NSE (India) | 9.5% | 7.17% | 7.64% | -0.47% | 0.020 | -62.58% | 28% | 26.1 |
| XETRA (Germany) | 6.0% | 6.55% | 7.64% | -1.09% | 0.255 | -47.01% | 12% | 18.8 |
| JKT (Indonesia) | 6.0% | 6.01% | 7.64% | -1.63% | 0.201 | -36.01% | 28% | 24.3 |
| JPX (Japan) | 6.0% | 5.53% | 7.64% | -2.11% | 0.267 | -52.42% | 16% | 27.6 |
| SET (Thailand) | 6.0% | 5.50% | 7.64% | -2.14% | 0.119 | -46.87% | 20% | 24.2 |
| TAI/TWO (Taiwan) | 6.0% | 5.12% | 7.64% | -2.52% | 0.159 | -44.58% | 24% | 27.7 |
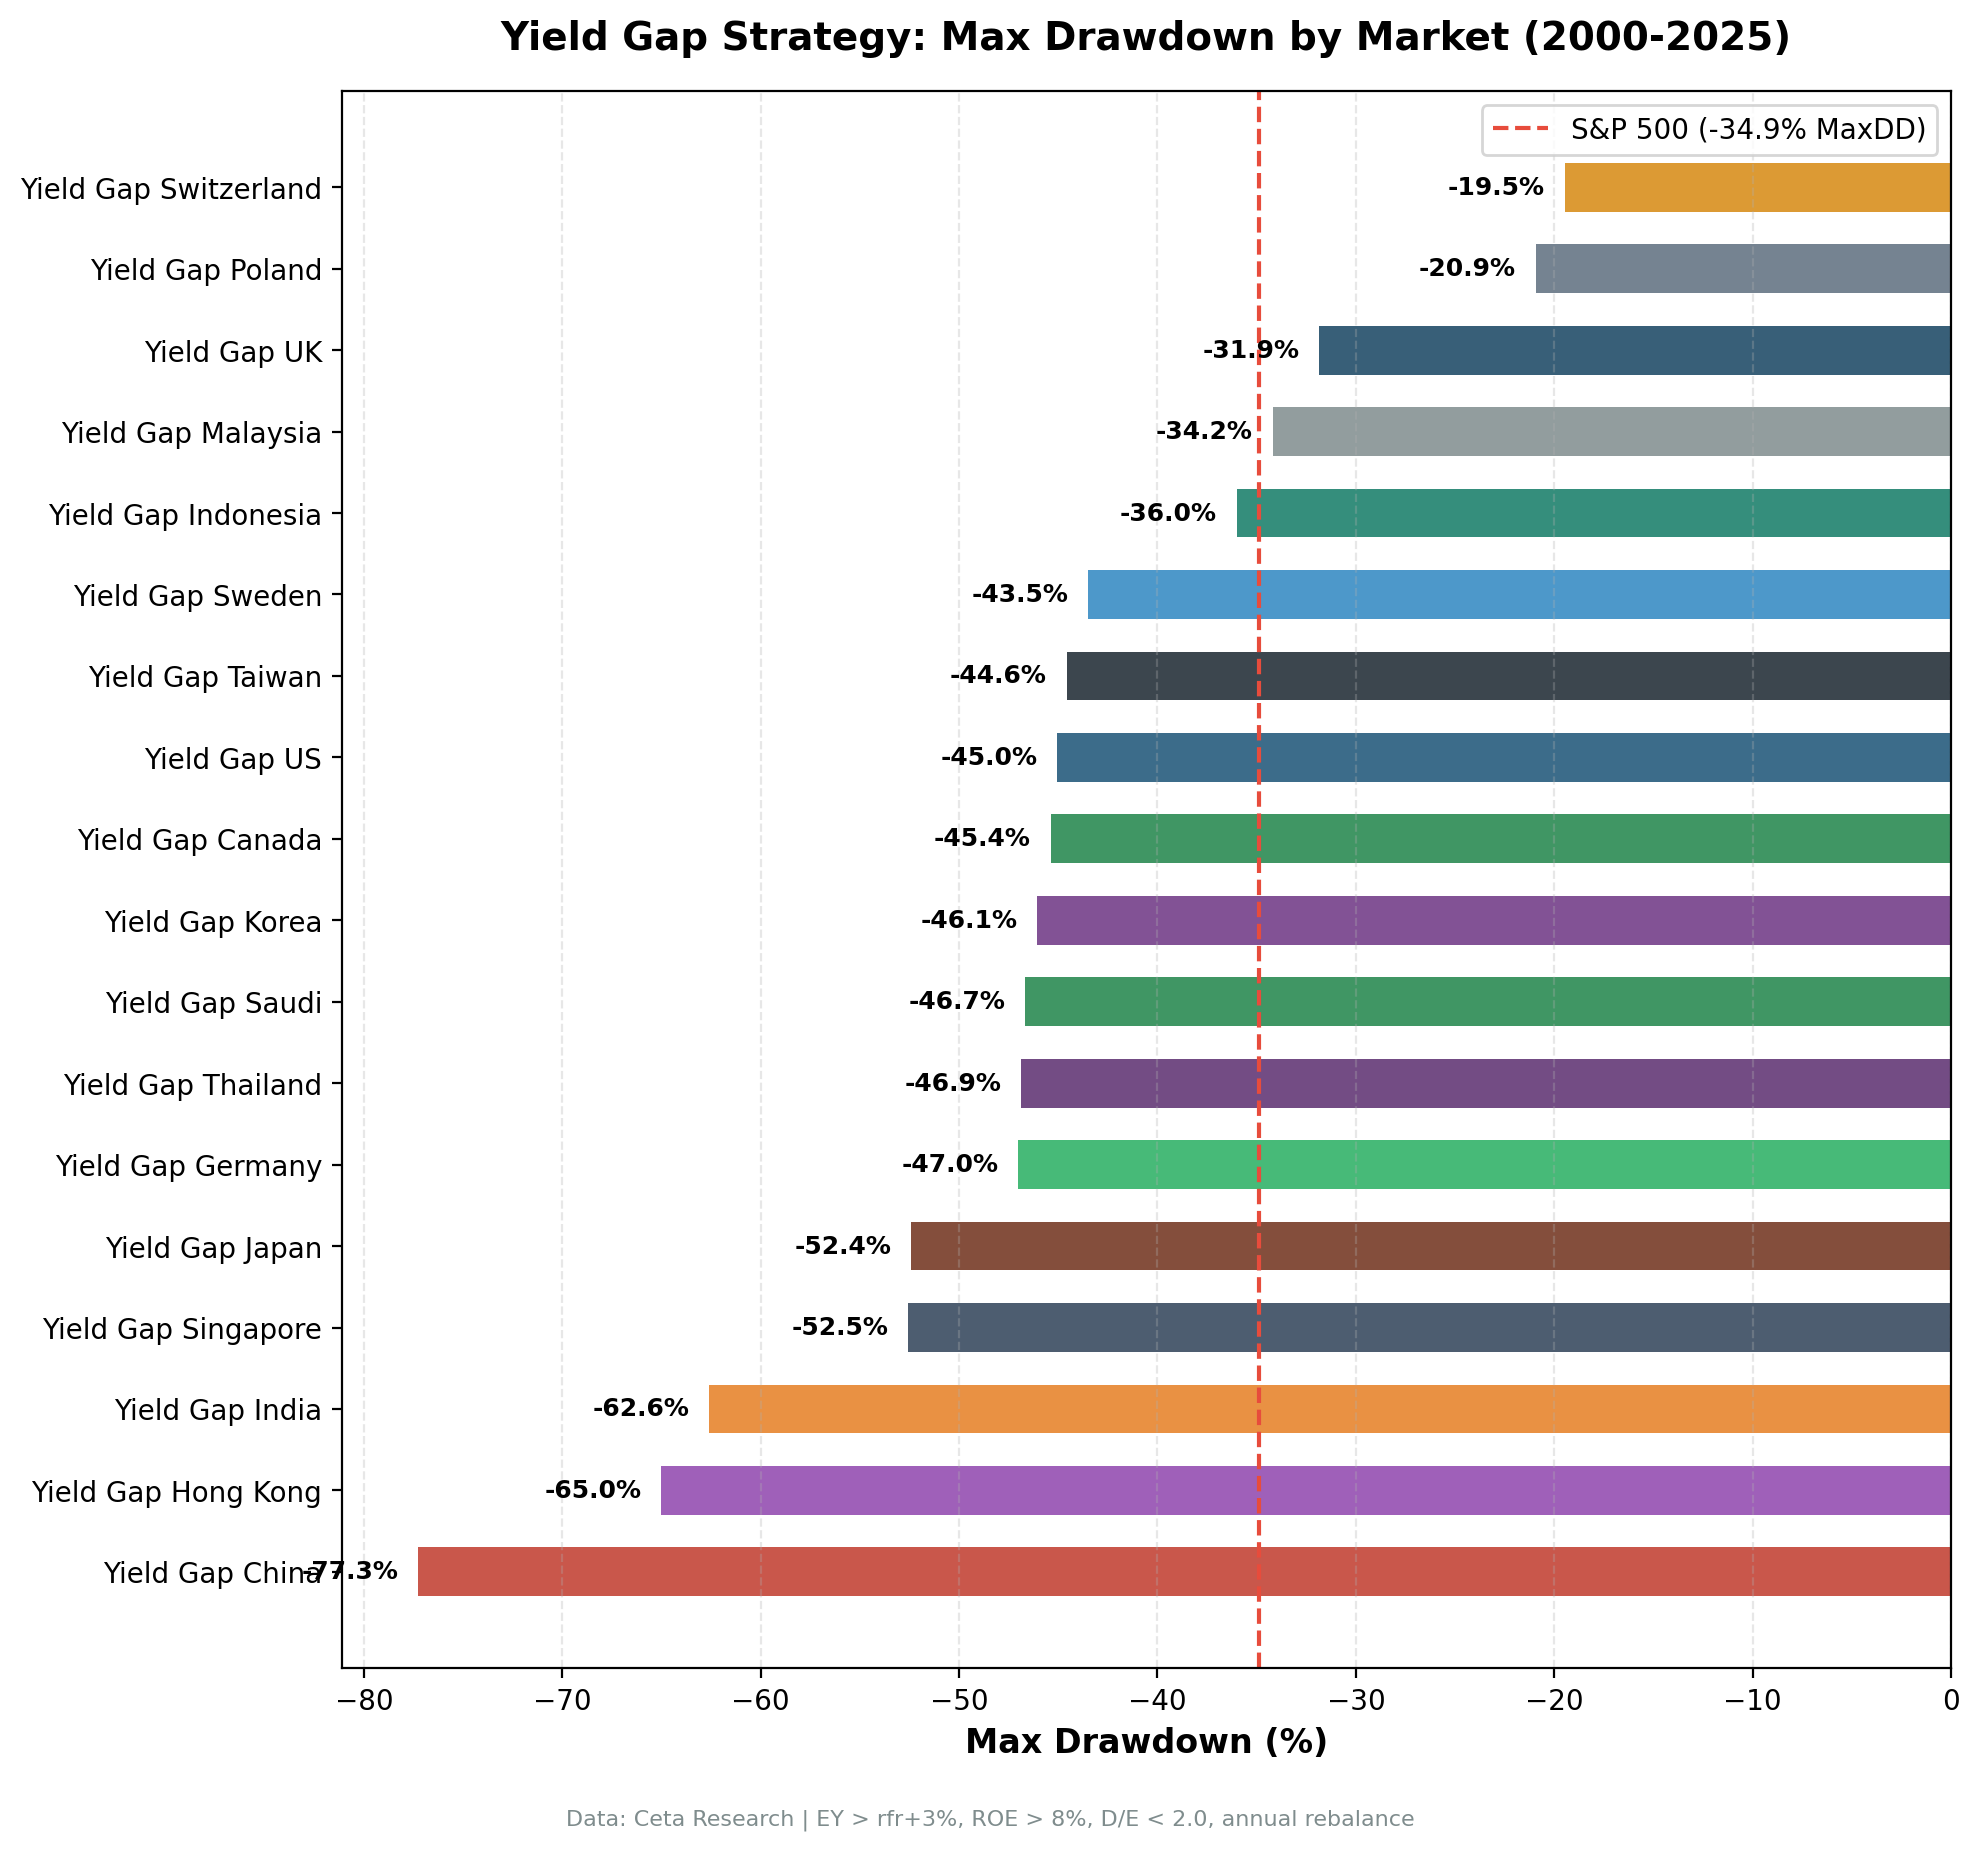
| SHZ/SHH (China) | 6.0% | 4.89% | 7.64% | -2.75% | 0.060 | -77.26% | 8% | 22.5 |
| KLS (Malaysia) | 6.0% | 4.61% | 7.64% | -3.03% | 0.157 | -34.19% | 28% | 21.9 |
| SAU (Saudi Arabia)* | 6.5% | 4.03% | 7.64% | -3.61% | 0.032 | -46.66% | 32% | 25.3 |
| HKSE (Hong Kong) | 6.0% | 3.57% | 7.64% | -4.07% | 0.021 | -65.01% | 4% | 20.6 |
| WSE (Poland)* | 8.0% | 2.87% | 7.64% | -4.77% | -0.168 | -20.94% | 44% | 16.9 |
| KSC (Korea) | 6.0% | 2.68% | 7.64% | -4.96% | -0.015 | -46.06% | 24% | 25.7 |
| SES (Singapore)† | 6.0% | 1.41% | 7.64% | -6.23% | -0.062 | -52.55% | 32% | 13.6 |
| JNB (S. Africa)‡ | 12.0% | 0.41% | 7.64% | -7.23% | -2.149 | -6.59% | 92% | 17.0 |
Local Benchmark Note: The table above uses SPY (7.64% CAGR) as a cross-market benchmark for comparability. Measured against their own local indices instead, the strategy wins in 11 of the 14 markets that have one: Sweden +9.26% vs OMX 30 (2.95%), UK +9.16% vs FTSE 100 (0.86%), Switzerland +5.53% vs SMI (1.90%), Canada +5.13% vs TSX Composite (4.44%), Hong Kong +3.09% vs Hang Seng (0.49%), Japan +2.58% vs Nikkei 225 (2.95%), Germany +2.11% vs DAX (4.45%), China +1.35% vs SSE Composite (3.54%), Thailand +1.34% vs SET Index (4.16%), Taiwan +1.21% vs TAIEX (3.91%), Norway +0.91% vs Oslo All Share (9.84%). It loses to India's Sensex (-4.23%), Korea's KOSPI (-0.65%) and Singapore's STI (-0.24%). Read the dividend caveat in Limitations before acting on any of those local figures. Full local comparisons in the individual regional blogs.
* Comparison only, high cash rates (WSE 44%, SAU 32%; on OSL read the note below rather than its 60%). Norway's figures cover 2014-2025 only: the Oslo All Share series we benchmark against has no prices before 2014, so 14 of the 25 rebalances cannot be scored at all. They are unmeasured, not uninvested, and the 60% in the Cash% column counts them as cash. Inside the 11 measured years the portfolio held cash in 3. The screen did run in some of the unmeasured years, and the returns it produced there are excluded along with everything else in that window. Its 10.74% CAGR and 0.774 Sharpe are computed over 11 periods against a different market regime than every other row, which is why it is excluded from the charts on this page. Do not rank it against the others. † Singapore: data quality caution, the sub-SGD 1 price filter may exclude a meaningful subset of smaller stocks. ‡ South Africa excluded from all content: 92% cash at a 12% EY threshold (rfr=9%+3%). Only 2 of 25 years invested. Not statistically meaningful. Its -6.59% max drawdown and 0.41% CAGR describe a cash account, not a strategy.
The Pattern
Western value markets outperformed. Sweden, the UK, the US and Canada all delivered positive excess returns against SPY, and all four beat their local indices too. Switzerland came in just below SPY (-0.21%) while beating its own SMI by 5.53%. These markets share common characteristics: corporate governance that emphasizes earnings quality, conservative accounting norms, and investor bases that have historically priced stocks on fundamental value metrics rather than growth optionality.
Asian markets underperformed SPY, but mostly beat their own indices. Japan, China, Taiwan, South Korea, Thailand, Singapore, Malaysia, Indonesia and Hong Kong all came in below SPY, from Japan at -2.11% to Singapore at -6.23%. Against local benchmarks the picture reverses for most of them: Hong Kong +3.09%, Japan +2.58%, China +1.35%, Thailand +1.34%, Taiwan +1.21%. Only Korea (-0.65%) and Singapore (-0.24%) lose on both measures. What failed in Asia was the market, not usually the screen.
Why the divergence? A few structural explanations:
- Value vs growth market cultures. Asian equity markets, particularly Taiwan, South Korea, and China, have historically attracted capital based on growth narratives: semiconductors, manufacturing, e-commerce. High-earnings-yield companies in these markets may be structurally cheap because capital flows to growth businesses, not because they're temporarily mispriced.
- Currency headwinds. All returns are in local currency. JPY, KRW, TWD, and THB have weakened against USD over the long run. A USD investor would experience additional drag that the local-currency backtest doesn't capture.
- Korea discount. Korean conglomerates (chaebols) have long traded at a significant discount to intrinsic value due to governance concerns and complex cross-shareholding structures. The earnings yield may be "high" because investors structurally discount Korean earnings. This isn't a yield gap that closes, it may be a permanent discount. Korea is one of only three markets where the screen loses to its own index.
- Hong Kong specific factors. Hong Kong's yield gap portfolio was invested in 24 of 25 years but delivered only 3.57% CAGR with a -65.01% max drawdown. Increasing political and economic integration with mainland China has created uncertainty premia that depress equity valuations, and that uncertainty hasn't resolved, so the discount hasn't closed. The Hang Seng did worse still (0.49%), which is why the screen shows +3.09% locally on a return almost no one would want.
Notable Observations
Switzerland: best Sharpe, best drawdown, and a caveat. The SIX exchange returned 7.43% CAGR (-0.21% vs SPY, +5.53% vs the SMI) with a Sharpe ratio of 0.501 and a -19.48% max drawdown, the best of both across every market that actually stayed invested. Norway's 0.774 Sharpe is higher but covers only 11 periods, and South Africa's shallower -6.59% drawdown is 23 years of cash. The SMI itself returned only 1.90% over 25 years. The caveat is the cash rate: the Swiss screen could only fill a 10-stock book in 18 of 25 years, and in 2000-2003 it found between 11 and 16 qualifying names of which only 2 to 4 were tradeable. Swiss quality value looks excellent on the years it ran, and it ran 72% of the time.
Poland flipped from marginal winner to clear loser. WSE now returns 2.87% CAGR, -4.77% against SPY, where an earlier version of this study had it marginally positive. The cash rate is the reason: 11 of 25 years, up from 8. Poland's market is relatively illiquid and the screen frequently cannot assemble a tradeable book. Its -20.94% max drawdown is the second-lowest in the table, but a drawdown measured over 14 invested years is not comparable to one measured over 25.
Singapore lost its local alpha. SES fell from 4.86% to 1.41% CAGR, and its edge over the STI went from clearly positive to -0.24%. It now has the smallest average book of any market (13.6 stocks) and holds cash in 8 of 25 years. Combined with the known sub-SGD 1 price filter issue, Singapore is the market in this study we have least confidence in.
India's volatility and local underperformance. India returned 7.17% CAGR, below both SPY (-0.47%) and the Sensex (-4.23%, Sensex 11.40% CAGR). The Sharpe of 0.02 is among the lowest in the table, below every market except Poland, Singapore and Korea. Seven of 25 years are cash, six of them from missing pre-2006 NSE fundamentals and one (2007) because only 8 of 10 screened names were tradeable. Over 2010-2024, invested every year, the screen returned 13.20% against the Sensex's 10.63%. For an Indian domestic investor the 25-year record does not beat a Sensex tracker, but the post-2010 record does.
South Africa is excluded, not underperforming. At a 12% EY threshold (rfr=9%+3%), only 2 of 25 years had enough qualifying, tradeable stocks. That's not a strategy, it's a "no signal" condition. South Africa is excluded from this analysis, not ranked as a poor performer. Its 0.41% CAGR and -6.59% max drawdown describe 23 years of cash.
Run a Global Screen Yourself
-- Global yield gap screen (EY > 6% floor, all markets)
SELECT
    k.symbol,
    p.companyName,
    p.exchange,
    p.sector,
    ROUND(k.earningsYieldTTM * 100, 2) AS earnings_yield_pct,
    ROUND(1.0 / NULLIF(k.earningsYieldTTM, 0), 1) AS implied_pe,
    ROUND(k.returnOnEquityTTM * 100, 2) AS roe_pct,
    ROUND(fr.debtToEquityRatioTTM, 2) AS debt_to_equity,
    ROUND(k.freeCashFlowYieldTTM * 100, 2) AS fcf_yield_pct,
    ROUND(p.marketCap / 1e9, 2) AS mktcap_b
FROM key_metrics_ttm k
JOIN profile p ON k.symbol = p.symbol
JOIN financial_ratios_ttm fr ON k.symbol = fr.symbol
WHERE k.earningsYieldTTM > 0.06
  AND k.earningsYieldTTM < 0.50
  AND k.returnOnEquityTTM > 0.08
  AND (fr.debtToEquityRatioTTM IS NULL
       OR (fr.debtToEquityRatioTTM >= 0 AND fr.debtToEquityRatioTTM < 2.0))
  AND p.marketCap > 500000000
  AND (p.industry IS NULL OR p.industry NOT LIKE 'Asset Management%')
  AND (p.industry IS NULL OR p.industry NOT LIKE 'Shell Companies%')
  AND (p.industry IS NULL OR p.industry NOT LIKE 'Closed-End Fund%')
  AND p.isFund = false
  AND p.isEtf = false
  AND p.isActivelyTrading = true
QUALIFY ROW_NUMBER() OVER (PARTITION BY p.companyName
                           ORDER BY p.averageVolume DESC) = 1
ORDER BY k.earningsYieldTTM DESC
LIMIT 30
Run this query on Ceta Research Data Explorer
One difference between that query and the backtest: it applies a single 500 million floor to every market, and marketCap is reported in each listing's own currency, so the floor is worth about $545M on XETRA and about $6M on the NSE. The backtest uses the per-market thresholds listed in the regional blogs. Add an exchange filter and the matching local threshold before you read anything into a global ranking.
Run the full global backtest:
git clone https://github.com/ceta-research/backtests.git
cd backtests
pip install -r requirements.txt
python3 yield-gap/backtest.py --global --output results/exchange_comparison.json
Limitations
All returns in local currency. Currency depreciation against USD adds a layer of drag for international investors that the backtests don't capture. Japan, India, Indonesia, and Southeast Asian currencies have all weakened against USD over this period.
Exchange listing is not domicile. The universe is every company listed on an exchange, which outside the US is often dominated by foreign secondary listings. We re-ran the three thin European markets in this table restricted to locally headquartered companies. Germany's local edge went from +2.11% to +1.85%, Switzerland's from +5.53% to +3.67%, and Poland stayed negative on both bases. No market changed sign, and in all three the number of investable years went up rather than down, because the foreign listings were the ones without tradeable prices. The published figures use the exchange-listed universe.
SPY as benchmark for all markets. SPY is the global capital cost benchmark used in the table above. If you're deploying capital globally, SPY is the relevant alternative. If you're a local investor in each country, your benchmark and opportunity cost are different, which is why the local comparison is given alongside it.
Survivorship bias exists across all markets. FMP's coverage of delisted and acquired companies varies by market. Emerging markets with less data standardization may have more survivorship bias.
The look-ahead risk is different across markets. Point-in-time logic (45-day FY filing lag) is most reliable in markets with strict filing deadlines. In markets with more variable reporting timelines (some emerging markets), the lag may not fully prevent look-ahead.
These benchmarks leave dividends out. Portfolio returns here use dividend-adjusted prices, so they include dividends. Most of the indices we measure against do not. The FTSE 100, Hang Seng, KOSPI, Nikkei 225, OMX Stockholm 30, Oslo All Share, SET Index, SMI, SSE Composite, STI, Sensex, TAIEX and TSX Composite are price indices, so excess return against them is overstated by roughly the local dividend yield, which has run between about 1.3% and 3.5% in these markets. Two comparisons need no adjustment: the S&P 500 figure runs through SPY, which is dividend-adjusted, and the DAX is a performance index.
Apply that haircut and the 11 local wins thin out considerably. Four clear the top of the dividend band under any assumption in it: Sweden (+9.26%), the UK (+9.16%), Switzerland (+5.53%) and Canada (+5.13%). Germany (+2.11%) survives because the DAX needs no haircut. The remaining six, Hong Kong (+3.09%), Japan (+2.58%), China (+1.35%), Thailand (+1.34%), Taiwan (+1.21%) and Norway (+0.91%), sit inside or below the 1.3% to 3.5% band, so their local edge is not established by this data. Treat those as unproven rather than positive.
Data: Ceta Research (FMP financial data warehouse), January 2000 through January 2025. Results for all 20 exchanges tested; JNB and OSL are shown for completeness but excluded from the charts and from any ranking. Full methodology: github.com/ceta-research/backtests/blob/main/METHODOLOGY.md.
Academic references: Campbell, J.Y. & Vuolteenaho, T. (2004). "Bad Beta, Good Beta." American Economic Review, 94(5). Damodaran, A. (2012). "Equity Risk Premiums (ERP): Determinants, Estimation and Implications." Stern School of Business.
Past performance does not guarantee future results. This is educational content, not investment advice.

