
Yield Gap Sweden: The Best Market in a 20-Exchange Study (2000-2025)
We ran the yield gap strategy on Stockholm Stock Exchange stocks from 2000 to 2025. The result: 12.21% CAGR vs 2.95% for OMX Stockholm 30 (+9.26% excess), the highest return of the 20 markets we tested, with an 80% annual win rate against the local index.

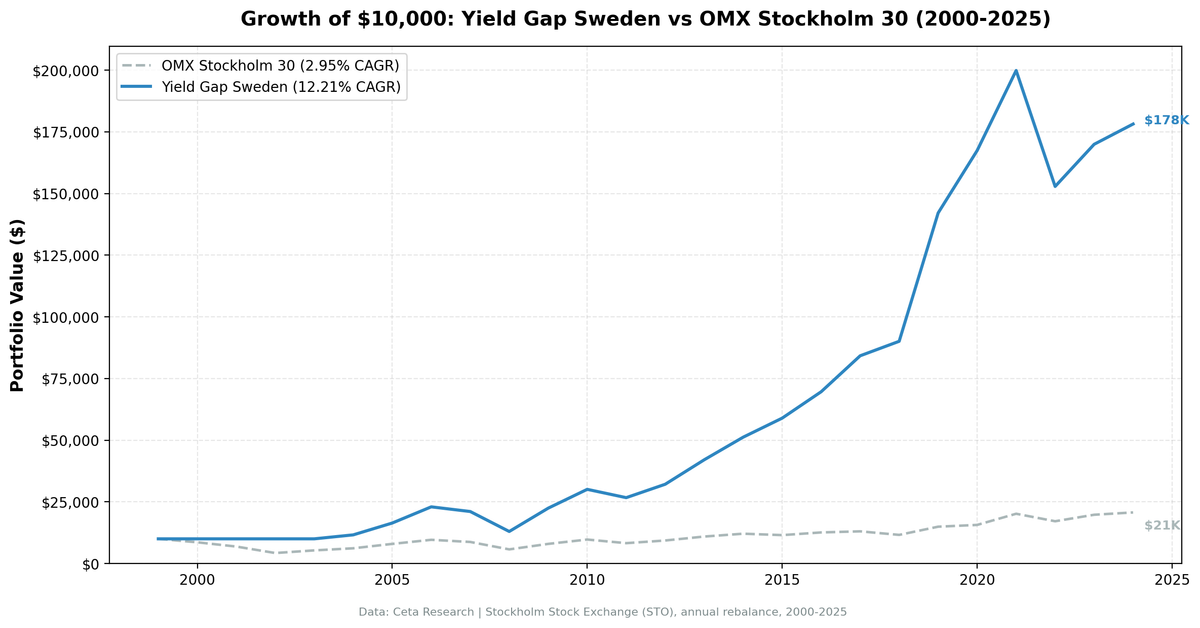
title: "Yield Gap Sweden: The Best Market in a 20-Exchange Study (2000-2025)" slug: yield-gap-sweden-backtest publish_date: 2026-03-24 tags: [backtests, sweden-markets, value-investing, earnings-yield, STO] post_access: public excerpt: "We ran the yield gap strategy on Stockholm Stock Exchange stocks from 2000 to 2025. The result: 12.21% CAGR vs 2.95% for OMX Stockholm 30 (+9.26% excess), the highest return of the 20 markets we tested, with an 80% annual win rate against the local index." authors: [Swas] feature_image: 1_sweden_cumulative_growth.png feature_image_alt: "Growth of $10,000: Yield Gap Sweden vs OMX Stockholm 30 (2000-2025)"
Contents
Data: FMP financial data warehouse, 2000-2025. Updated September 2026.
Sweden doesn't come to mind first when thinking about value investing. But among the 20 markets we tested, Stockholm delivered the highest absolute return and the largest excess over its local index, with an 80% annual win rate against the OMX Stockholm 30 and a return profile that compounded well across multiple market cycles.
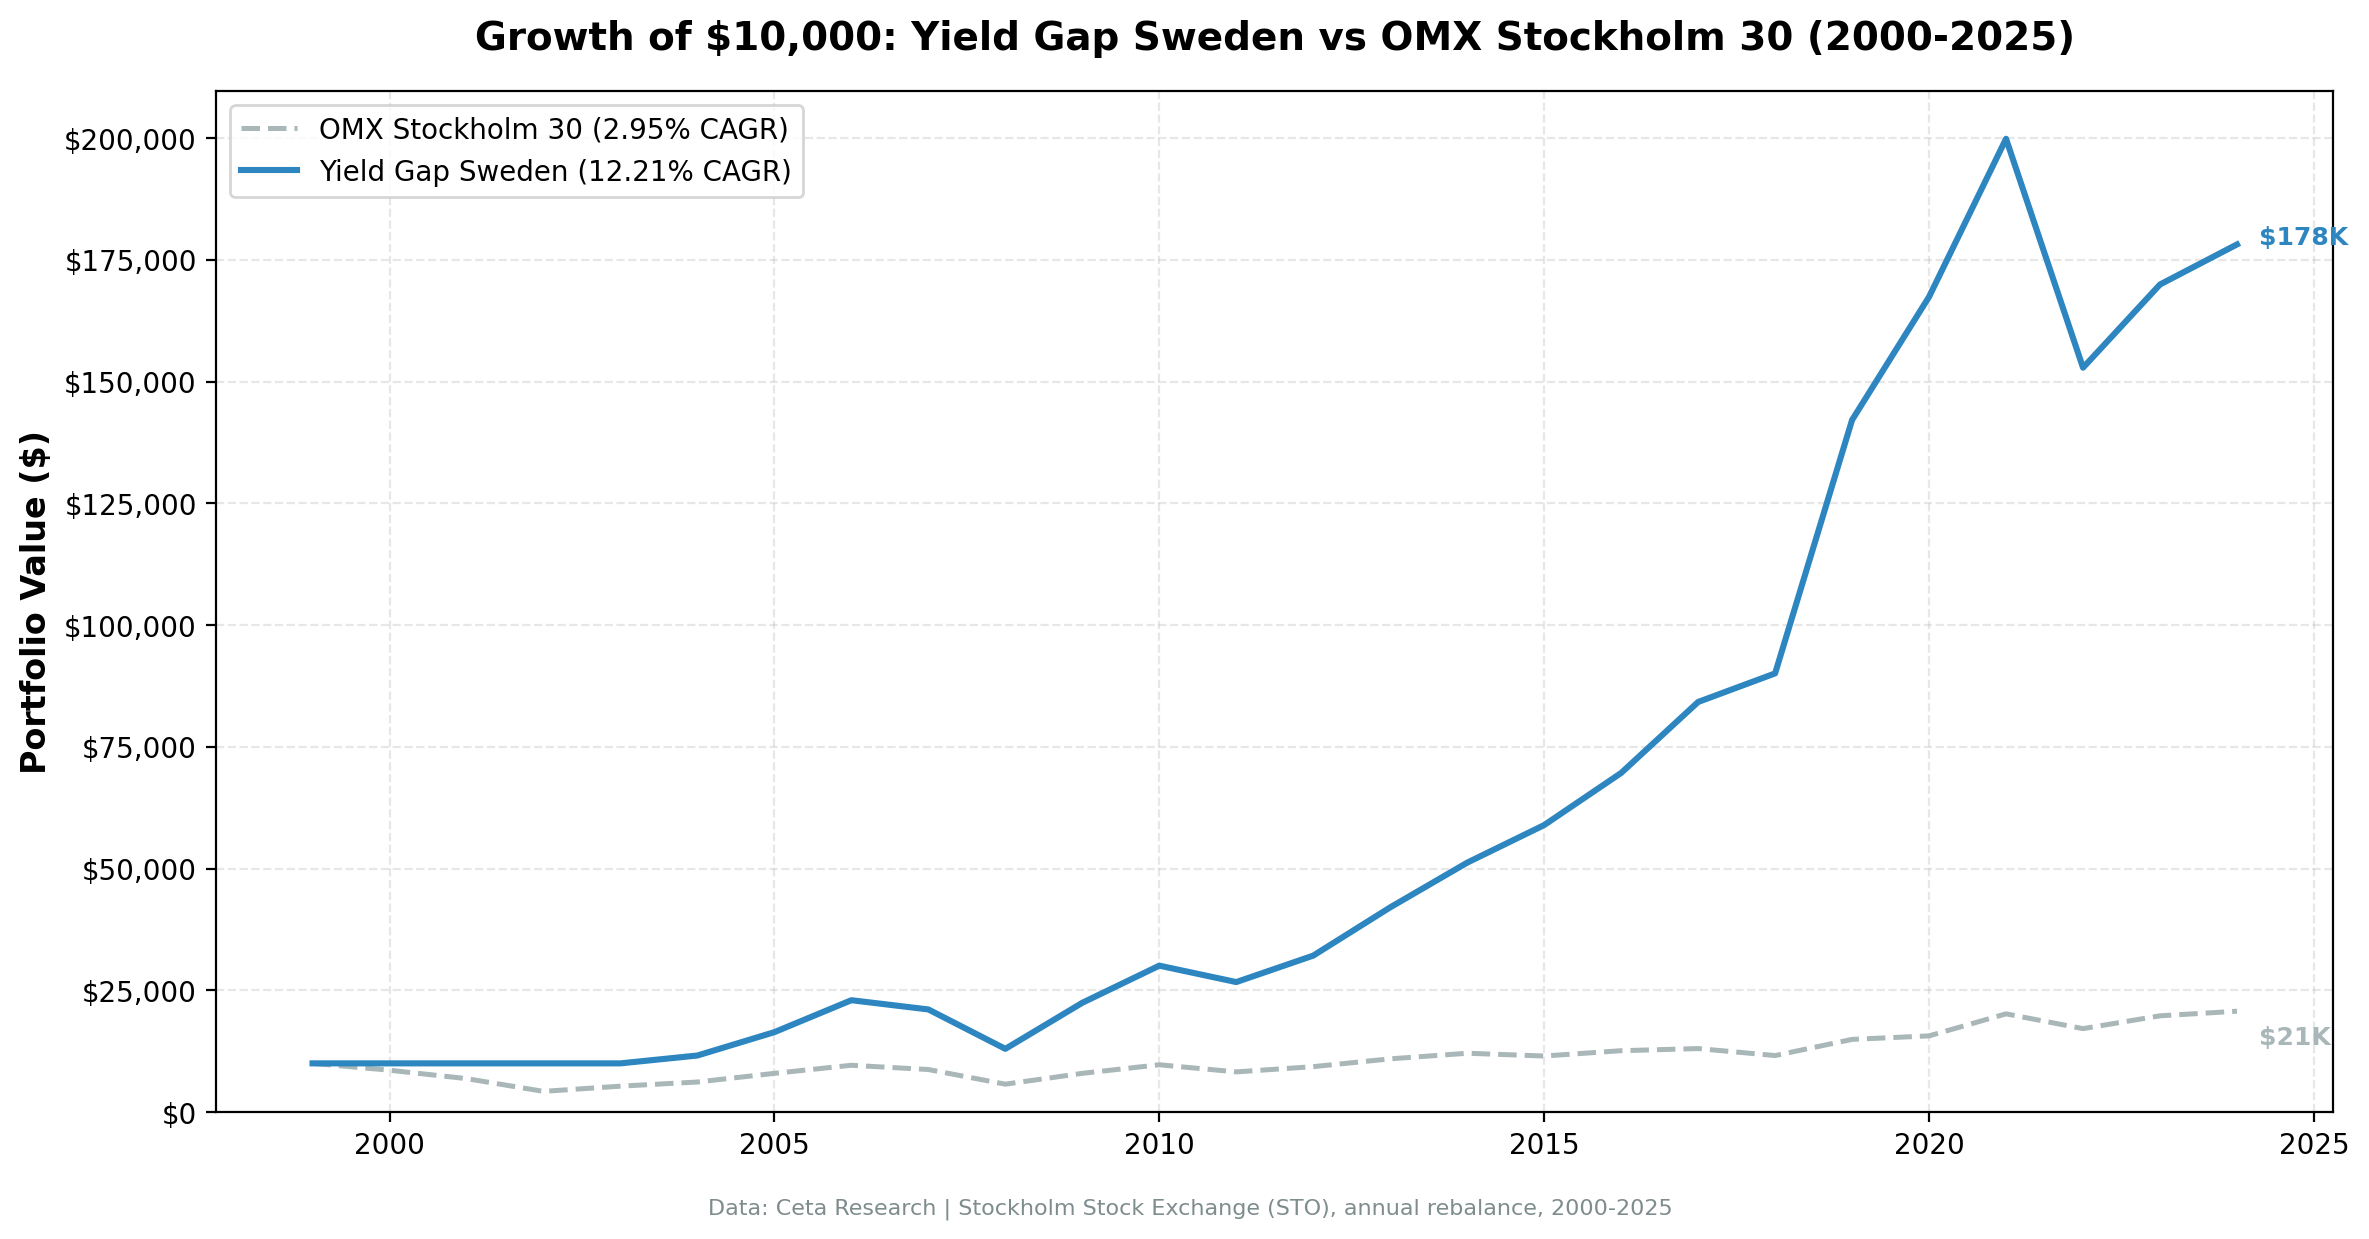
A $10,000 investment grew to $178,167 using this strategy. The OMX Stockholm 30 grew to about $20,700 over the same period. SPY grew to $63,066.
The Strategy
Sweden's risk-free rate over this period averaged roughly 2%, putting the effective threshold at 6% earnings yield. The 6% absolute floor applies, since rfr+3% gives 5%, below the floor. That means PE ratios below ~16.7x.
Signal: - Earnings yield > 6% (PE < ~16.7x) - Earnings yield < 50% - ROE > 8% - D/E < 2.0
Portfolio construction: Top 30 by highest earnings yield, equal weight, annual January rebalance. Cash if fewer than 10 stocks qualify. The first four years of the backtest (2000 through 2003) failed that test. In 2000, 2001 and 2003 fewer than 10 Swedish companies passed the screen at all. In 2002, 10 passed but only 9 had a usable entry price. The portfolio held cash for all four, which explains much of the early-period divergence from the index.
Methodology
- Universe: Stockholm Stock Exchange (STO)
- Market cap filter: SEK 5B+ at each rebalance date
- Data period: January 2000 through January 2025 (25 annual periods, 16% cash years, 4 of 25)
- Rebalancing: Annual (January)
- Point-in-time data: FY filings with 45-day filing lag
- Transaction costs: Size-tiered model
- Benchmark: OMX Stockholm 30 (local Swedish benchmark)
- Data source: Ceta Research FMP financial data warehouse
Full methodology at github.com/ceta-research/backtests/blob/main/METHODOLOGY.md.
Results
| Metric | Yield Gap Sweden | OMX Stockholm 30 |
|---|---|---|
| CAGR | 12.21% | 2.95% |
| Total return (25yr) | 1,681.7% | ~107% |
| Max drawdown | -43.49% | -57.52% |
| Sharpe ratio | 0.424 | 0.047 |
| Down capture vs OMX | 36.7% | n/a |
| Win rate vs OMX | 80.0% | n/a |
| Cash periods | 4 of 25 years (16%) | n/a |
| Avg stocks (invested) | 24.1 | n/a |
The 80% win rate means the strategy beat the local OMX Stockholm 30 in 20 of 25 years. That's an unusually consistent edge, and the highest win rate of any market in the study alongside the UK. The OMX Stockholm 30 was itself a weak index over this period, averaging 2.95% CAGR from 2000-2025. The context matters: Sweden's large-cap index underperformed dramatically while the yield gap screen kept compounding.
The 36.7% down-capture vs OMX means the strategy absorbed roughly a third of the local index's declines on average. Some of that is the four cash years, three of which landed in falling markets. Strip 2000-2003 out and the record starts in 2004, which is worth keeping in mind: this is a 21-year track record wearing a 25-year label.
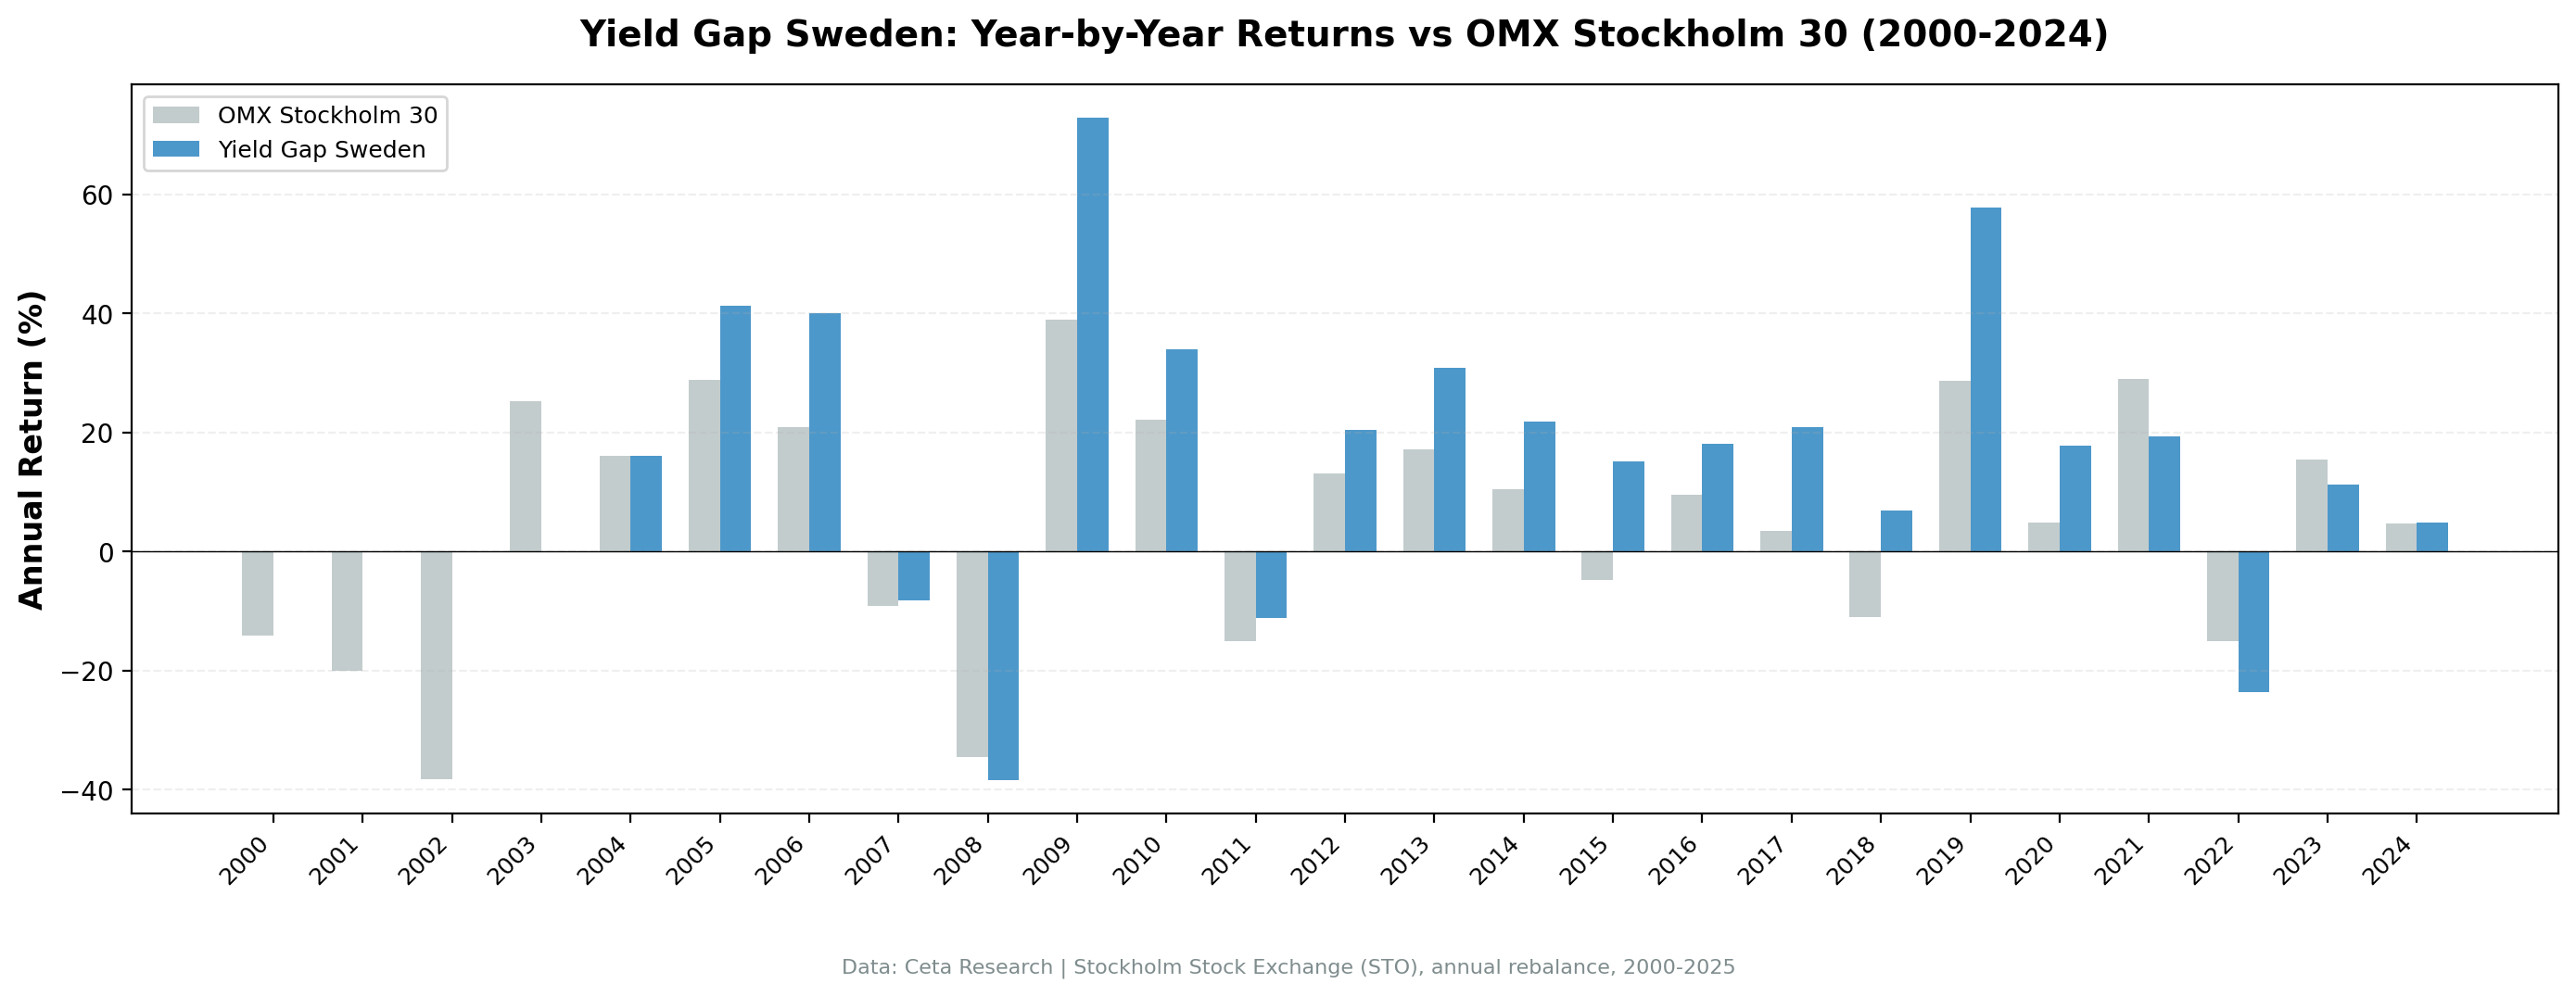
Annual returns (portfolio vs OMX Stockholm 30):
| Year | Portfolio | OMX 30 | Excess |
|---|---|---|---|
| 2000 | 0.00% (cash) | -14.04% | +14.04% |
| 2001 | 0.00% (cash) | -20.09% | +20.09% |
| 2002 | 0.00% (cash) | -38.16% | +38.16% |
| 2003 | 0.00% (cash) | +25.19% | -25.19% |
| 2004 | +16.13% | +16.03% | +0.11% |
| 2005 | +41.31% | +28.84% | +12.47% |
| 2006 | +39.98% | +20.84% | +19.14% |
| 2007 | -8.26% | -9.08% | +0.82% |
| 2008 | -38.40% | -34.45% | -3.95% |
| 2009 | +72.87% | +38.89% | +33.99% |
| 2010 | +33.99% | +22.14% | +11.85% |
| 2011 | -11.22% | -15.08% | +3.85% |
| 2012 | +20.36% | +13.06% | +7.30% |
| 2013 | +30.85% | +17.20% | +13.65% |
| 2014 | +21.83% | +10.53% | +11.30% |
| 2015 | +15.07% | -4.74% | +19.81% |
| 2016 | +18.16% | +9.50% | +8.66% |
| 2017 | +20.93% | +3.47% | +17.46% |
| 2018 | +6.97% | -11.01% | +17.98% |
| 2019 | +57.77% | +28.65% | +29.12% |
| 2020 | +17.80% | +4.80% | +13.00% |
| 2021 | +19.38% | +28.95% | -9.56% |
| 2022 | -23.52% | -15.07% | -8.45% |
| 2023 | +11.18% | +15.38% | -4.20% |
| 2024 | +4.84% | +4.76% | +0.08% |
Note: 2000 through 2003 show 0% returns. In 2000, 2001 and 2003 fewer than 10 stocks met the EY > 6% / ROE > 8% / D/E < 2 criteria. In 2002, 10 passed the screen but only 9 of them had a usable entry price in the data, which is still below the floor. The STO universe took a few years to yield enough qualifying stocks. The +38.16% excess shown for 2002 is cash sitting out a 38% index decline, not a return the strategy earned.
What Drove the Returns
2005-2006 and 2009-2010 were transformative. Swedish industrials and consumer companies were genuinely cheap relative to earnings. The portfolio returned +41.31% in 2005 (vs OMX +28.84%) and +39.98% in 2006 (vs OMX +20.84%). The 2009 bounce of +72.87% vs OMX +38.89% added another enormous compounding step.
2019 stands out. +57.77% vs OMX +28.65% (+29.12% excess). Sweden had a broad population of high-earnings-yield industrial and specialty companies that rerated sharply that year. No single event explains it. A sustained mid-cap value recovery.
2018 showed defensive quality vs local index. +6.97% vs OMX -11.01% (+17.98% excess). The OMX Stockholm 30 fell hard while Swedish quality value stocks with simpler business models held up. The strategy's sector mix diverged meaningfully from the large-cap index.
2021-2024 was mixed. 2021 saw underperformance vs local (-9.56% excess), 2022 gave back another 8.45 points, and 2023 was weak again (-4.20%). 2024 finished level (+0.08%). The OMX Stockholm 30 in recent years has been driven by industrial heavyweights (Atlas Copco, Volvo) at elevated multiples. The yield gap screen, by construction, excluded them.
The cash years flattered the record. Holding cash in 2003, when the OMX returned +25.19%, was a 25-point miss. But cash also sat out 2000 (-14.04%), 2001 (-20.09%) and 2002 (-38.16%). Net across the four years, cash beat the index by a wide margin. That is an accident of when Swedish fundamentals coverage begins, not a feature of the strategy, and you should discount the headline CAGR accordingly.
Run It Yourself
Current Sweden yield gap screen:
SELECT
    k.symbol,
    p.companyName,
    p.exchange,
    p.sector,
    ROUND(k.earningsYieldTTM * 100, 2) AS earnings_yield_pct,
    ROUND(1.0 / NULLIF(k.earningsYieldTTM, 0), 1) AS implied_pe,
    ROUND(k.returnOnEquityTTM * 100, 2) AS roe_pct,
    ROUND(fr.debtToEquityRatioTTM, 2) AS debt_to_equity,
    ROUND(k.freeCashFlowYieldTTM * 100, 2) AS fcf_yield_pct,
    ROUND(p.marketCap / 1e9, 2) AS mktcap_b
FROM key_metrics_ttm k
JOIN profile p ON k.symbol = p.symbol
JOIN financial_ratios_ttm fr ON k.symbol = fr.symbol
WHERE k.earningsYieldTTM > 0.06
  AND k.earningsYieldTTM < 0.50
  AND k.returnOnEquityTTM > 0.08
  AND (fr.debtToEquityRatioTTM IS NULL
       OR (fr.debtToEquityRatioTTM >= 0 AND fr.debtToEquityRatioTTM < 2.0))
  AND p.marketCap > 5000000000          -- SEK 5B+ (matches the backtest threshold)
  AND (p.industry IS NULL OR p.industry NOT LIKE 'Asset Management%')
  AND (p.industry IS NULL OR p.industry NOT LIKE 'Shell Companies%')
  AND p.exchange IN ('STO')
  AND p.isFund = false
  AND p.isEtf = false
  AND p.isActivelyTrading = true
QUALIFY ROW_NUMBER() OVER (PARTITION BY p.companyName
                           ORDER BY p.averageVolume DESC) = 1
ORDER BY k.earningsYieldTTM DESC
LIMIT 30
Run this query on Ceta Research Data Explorer
Full backtest:
git clone https://github.com/ceta-research/backtests.git
cd backtests
pip install -r requirements.txt
python3 yield-gap/backtest.py --preset sweden --output results.json --verbose
Limitations
Currency risk: Returns in SEK. SEK/USD has been volatile, particularly during the 2022-2023 period when SEK weakened substantially against USD. USD-based investors would have experienced lower returns.
Cash years create uncertainty, and here they help: Four early years of cash holding mean the 25-year track record includes periods where the strategy simply wasn't active. Three of those four were falling markets, so cash added to the measured excess without the strategy doing anything. A Swedish investor who started in 2004 has 21 years of real signal, not 25.
Small universe: STO has a smaller number of large-cap companies than US or UK markets. The portfolio averaged 24.1 stocks when invested, and in the early years it could not reach 10 at all. Sector concentration is higher than in more liquid markets.
Sweden's economy is global: Swedish large-cap companies (engineering, industrials, financial) have heavy international revenue exposure. Returns are partly driven by global industrial cycle dynamics, not just Swedish domestic conditions.
Data: Ceta Research (FMP financial data warehouse), January 2000 through January 2025. Full methodology: github.com/ceta-research/backtests/blob/main/METHODOLOGY.md.
Academic references: Campbell, J.Y. & Vuolteenaho, T. (2004). "Bad Beta, Good Beta." American Economic Review, 94(5). Damodaran, A. (2012). "Equity Risk Premiums (ERP): Determinants, Estimation and Implications." Stern School of Business.
Past performance does not guarantee future results. This is educational content, not investment advice.

