
Yield Gap UK: +9.16% a Year Over the FTSE 100, 80% Win Rate (2000-2025)
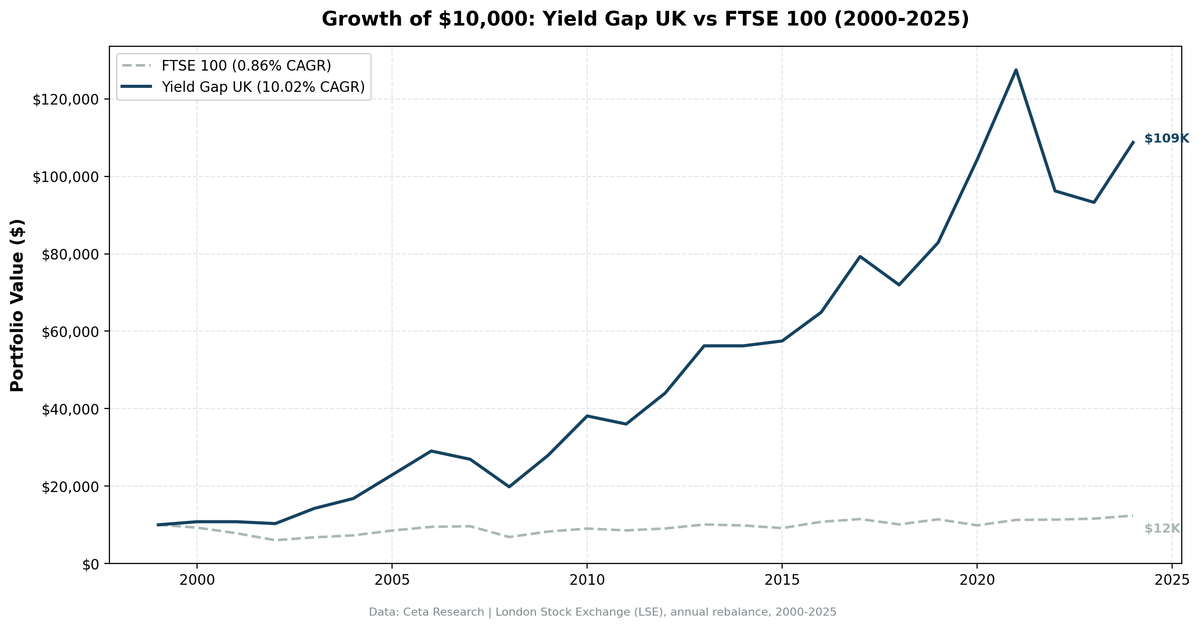
We tested the yield gap strategy on London Stock Exchange stocks from 2000 to 2025. LSE stocks delivered 10.02% CAGR against 0.86% for the FTSE 100, a +9.16% annual edge, and beat the local index in 80% of years.

title: "Yield Gap UK: +9.16% a Year Over the FTSE 100, 80% Win Rate (2000-2025)" slug: yield-gap-uk-backtest publish_date: 2026-03-19 tags: [backtests, uk-markets, value-investing, earnings-yield, LSE] post_access: public excerpt: "We tested the yield gap strategy on London Stock Exchange stocks from 2000 to 2025. LSE stocks delivered 10.02% CAGR against 0.86% for the FTSE 100, a +9.16% annual edge, and beat the local index in 80% of years." authors: [Swas] feature_image: 1_uk_cumulative_growth.png feature_image_alt: "Growth of $10,000: Yield Gap UK vs FTSE 100 (2000-2025)"
Contents
- The Strategy
- Methodology
- Results
- What Drives the UK Outperformance
- Why the UK Works for Value Investing
- Run It Yourself
- Limitations
Data: FMP financial data warehouse, 2000-2025. Updated September 2026.
We tested the yield gap strategy across 20 equity markets. The UK came second, behind Sweden. London Stock Exchange stocks with earnings yields 3+ percentage points above UK gilt rates returned 10.02% CAGR from 2000 to 2025, vs 0.86% for the FTSE 100 (price return) and 7.64% for SPY. That's +9.16% above the local index, compounding over 25 years.
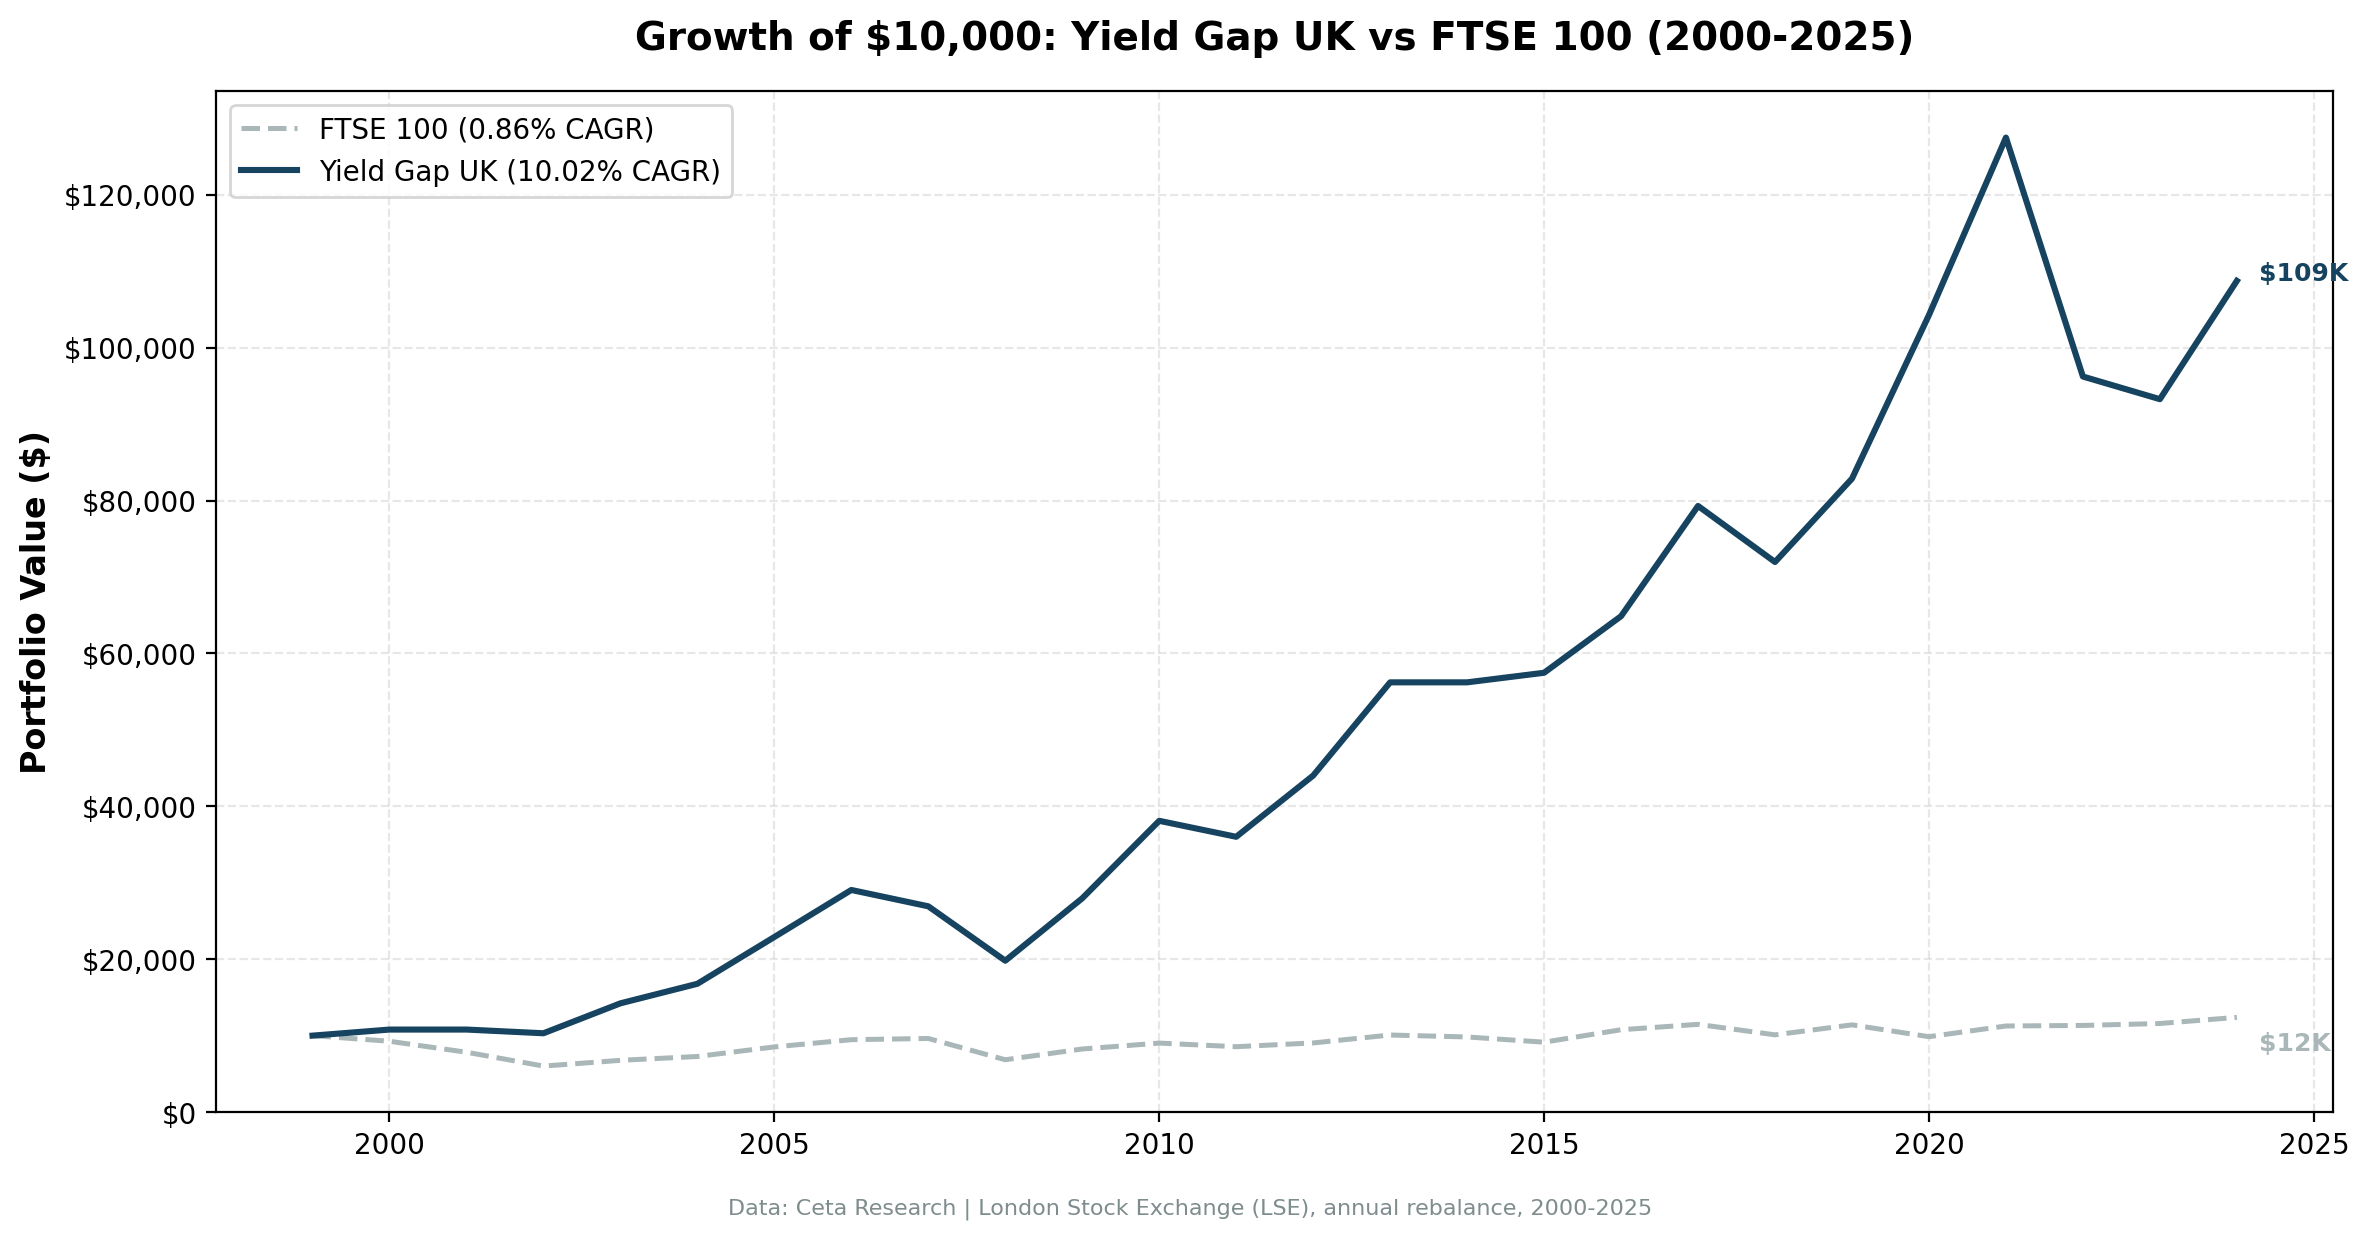
A $10,000 investment in January 2000 grew to $108,772. The same investment in SPY grew to $63,066. A FTSE 100 tracker grew to roughly $12,400 (price return only, ex-dividends).
The Strategy
The yield gap compares a stock's earnings yield (1/PE ratio) to the prevailing risk-free rate. For UK stocks, we use a 3.5% risk-free rate, reflecting the long-run average UK gilt yield. This sets the effective threshold at 6.5% earnings yield (PE < ~15.4x), slightly more demanding than the 6% US threshold.
Signal: - Earnings yield > max(6%, rfr + 3%), which is 6.5% for the UK (PE < ~15.4x) - Earnings yield < 50% - ROE > 8% - D/E < 2.0
Portfolio construction: Top 30 by highest earnings yield, equal weight, annual January rebalance. Cash if fewer than 10 stocks qualify.
Methodology
- Universe: London Stock Exchange (LSE)
- Market cap filter: £500M+ at each rebalance date
- Data period: January 2000 through January 2025 (25 annual periods, 2 cash years)
- Rebalancing: Annual (January)
- Point-in-time data: FY filings with 45-day filing lag
- Transaction costs: Size-tiered model
- Benchmark: FTSE 100 (local UK benchmark, price return)
- Data source: Ceta Research FMP financial data warehouse
Full methodology at github.com/ceta-research/backtests/blob/main/METHODOLOGY.md.
Results
| Metric | Yield Gap UK | FTSE 100 |
|---|---|---|
| CAGR | 10.02% | 0.86% |
| Total return (25yr) | 987.7% | ~24% |
| Max drawdown | -31.85% | -39.85% |
| Sharpe ratio | 0.344 | -0.202 |
| Down capture vs FTSE | 8.4% | n/a |
| Win rate vs FTSE | 80.0% | n/a |
| Cash periods | 2 of 25 years | n/a |
| Avg stocks (invested) | 14.3 | n/a |
The down-capture of 8.4% vs the FTSE 100 is the standout number. When the FTSE fell, this portfolio on average gave back only about 8% as much. That is close to no participation in the local index's declines at all. The 80% win rate (20 of 25 years beating the FTSE) shows the consistency. The strategy beat the local index in most years because the FTSE 100 itself went essentially nowhere over this period.
The two cash years are worth naming. In 2001 and 2014 the screen returned a full 30 names, but only 9 and 7 of them had a usable entry price in the data. Below the 10-stock floor the backtest holds cash rather than report a handful of stocks as a diversified portfolio. Both happen to be years the FTSE fell, so cash helped, but that's luck, not design.
Note: the FTSE 100 price return was only 0.86% annually from 2000-2025. With dividends reinvested, the total return index does considerably better. The comparison here is to the price-return benchmark that our backtest uses as the local index proxy. Subtract roughly 3.5 points of UK dividend yield and the edge is nearer +5.7% than +9.16%.
UK value stocks have long had a reputation for being better priced than their US counterparts. The data supports that. The London market consistently produces pools of high-earnings-yield, quality companies, partly because UK investors have historically emphasized dividends and fundamental value over growth premiums.
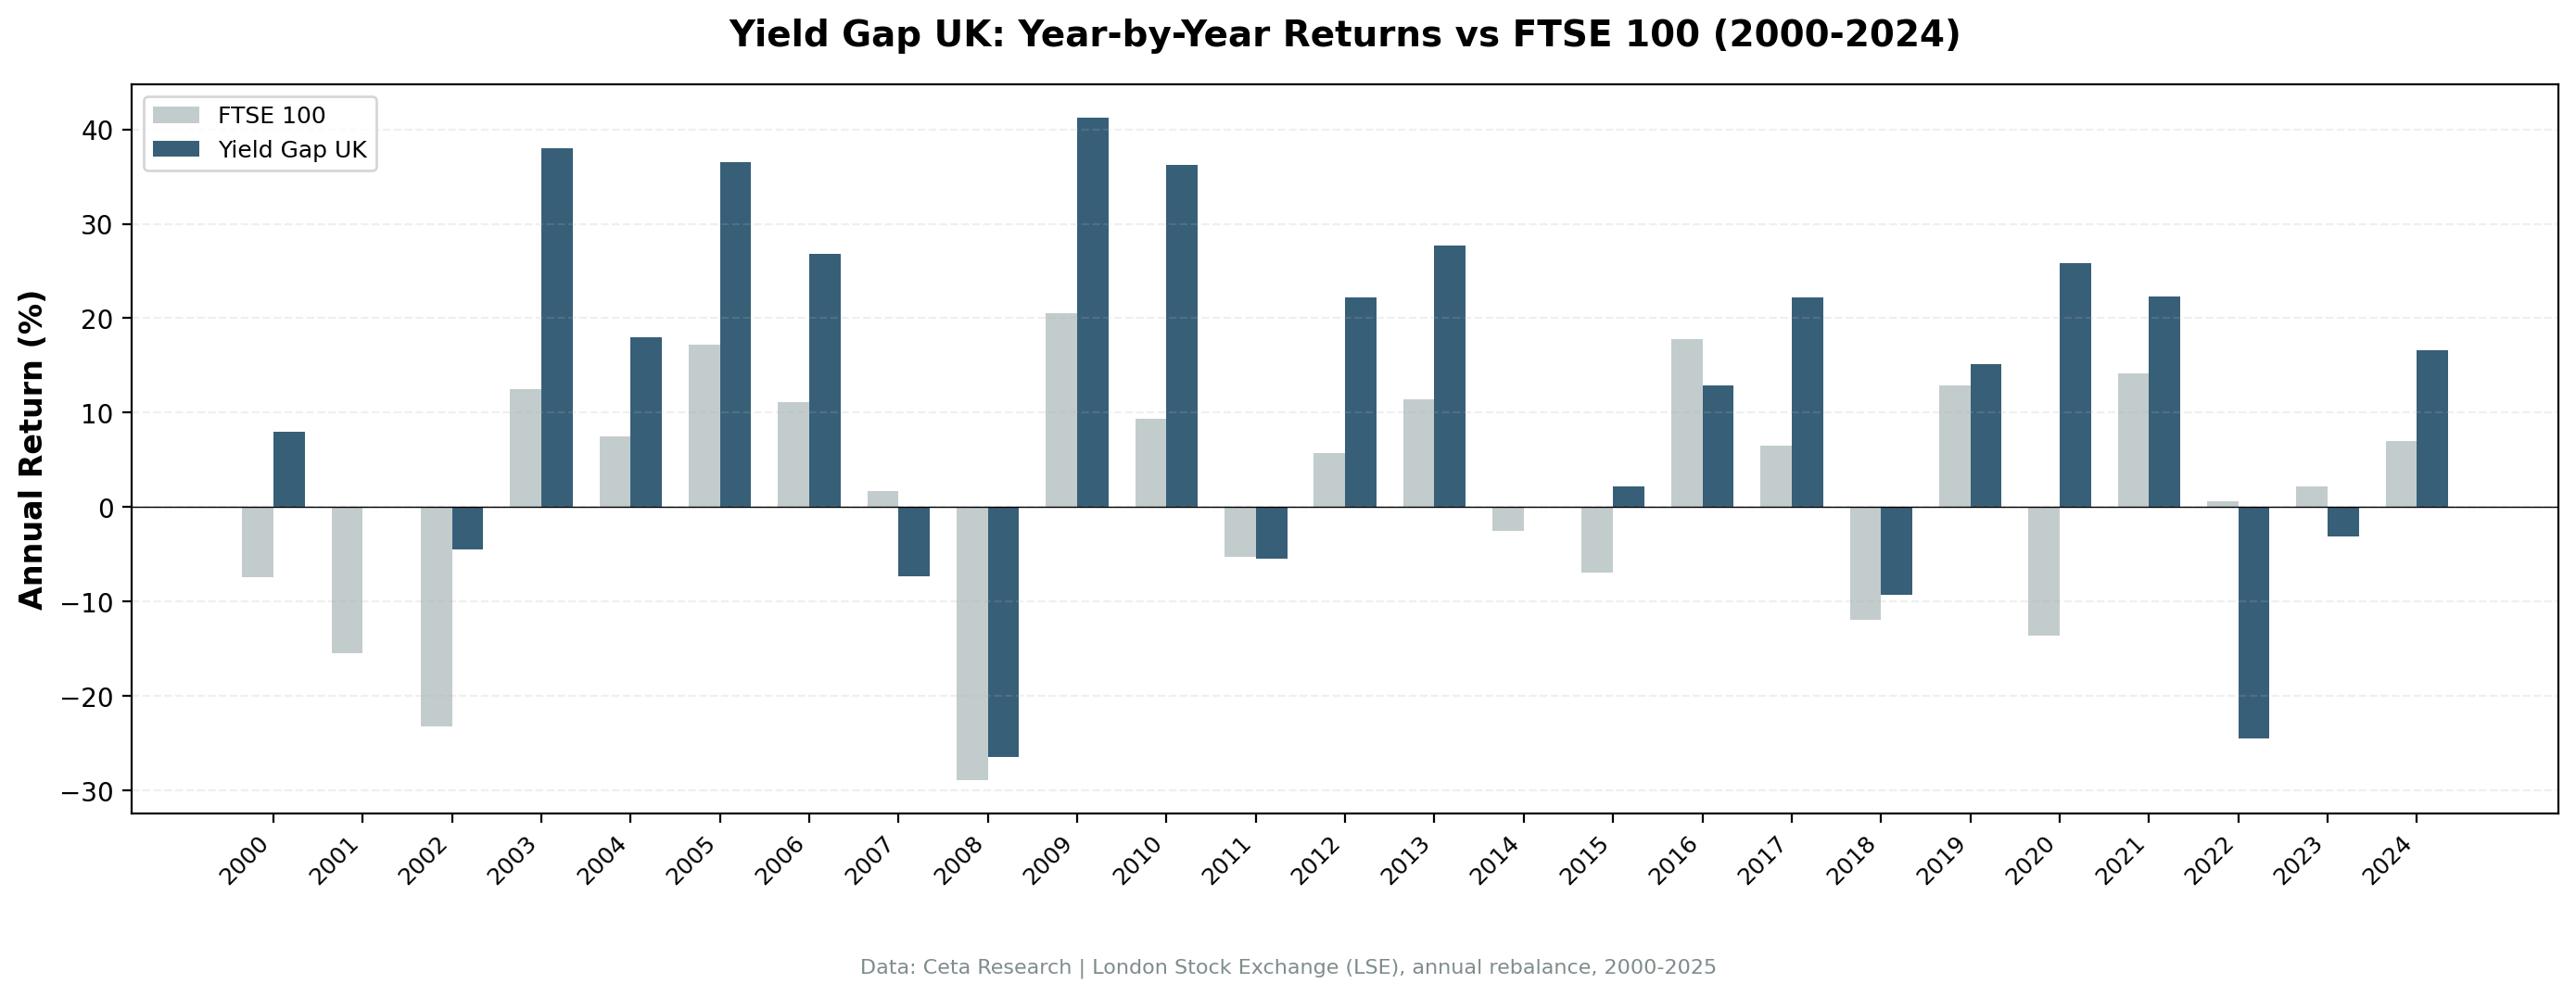
Annual returns (portfolio vs FTSE 100):
| Year | Portfolio | FTSE 100 | Excess | Note |
|---|---|---|---|---|
| 2000 | +7.94% | -7.37% | +15.31% | |
| 2001 | 0.00% | -15.49% | +15.49% | Cash, 9 of 30 buyable |
| 2002 | -4.49% | -23.16% | +18.68% | |
| 2003 | +38.00% | +12.49% | +25.51% | |
| 2004 | +17.97% | +7.47% | +10.50% | |
| 2005 | +36.48% | +17.22% | +19.27% | |
| 2006 | +26.86% | +11.08% | +15.78% | |
| 2007 | -7.36% | +1.68% | -9.04% | |
| 2008 | -26.44% | -28.91% | +2.47% | |
| 2009 | +41.24% | +20.57% | +20.67% | |
| 2010 | +36.25% | +9.34% | +26.91% | |
| 2011 | -5.49% | -5.22% | -0.27% | |
| 2012 | +22.25% | +5.75% | +16.51% | |
| 2013 | +27.70% | +11.46% | +16.24% | |
| 2014 | 0.00% | -2.53% | +2.53% | Cash, 7 of 30 buyable |
| 2015 | +2.23% | -6.94% | +9.16% | |
| 2016 | +12.88% | +17.80% | -4.91% | |
| 2017 | +22.23% | +6.55% | +15.68% | |
| 2018 | -9.25% | -11.95% | +2.70% | |
| 2019 | +15.16% | +12.92% | +2.24% | |
| 2020 | +25.83% | -13.58% | +39.41% | |
| 2021 | +22.26% | +14.20% | +8.06% | |
| 2022 | -24.52% | +0.65% | -25.17% | |
| 2023 | -3.08% | +2.22% | -5.29% | |
| 2024 | +16.60% | +6.97% | +9.62% |
What Drives the UK Outperformance
The dotcom bust gave UK value a massive head start. From 2000 to 2007 the UK portfolio compounded at 13.2% a year while the FTSE 100 went backwards at -0.5%, falling three consecutive years (2000: -7.37%, 2001: -15.49%, 2002: -23.16%). UK markets had limited exposure to late-1990s technology valuations. Earnings-yield investing in the UK during this period meant owning industrial, energy, and financial companies that simply kept earning.
2008 held up better than the index. The UK portfolio fell -26.44% in 2008 vs the FTSE's -28.91%, a +2.47% excess. That's a small edge in an ugly year rather than a rout, and it's the opposite of what a screen loaded with UK banks and insurers might lead you to expect. The recovery was strong: +41.24% in 2009 vs FTSE +20.57%.
2020 was the best single-year excess. During COVID, the FTSE 100 fell -13.58% while UK yield gap stocks returned +25.83%, a +39.41% excess. UK value stocks had sold off during the initial crash, then recovered sharply when markets recognized the businesses remained fundamentally intact.
2022 was the worst year by a wide margin. -24.52% vs FTSE +0.65%, a -25.17% gap. That single year is almost three times worse than any other relative loss in the series. UK financials and property companies, common in high-earnings-yield screens, suffered when rate rises hit valuations hard, while the FTSE 100's energy and mining weights cushioned the index.
2023 was the second weak year in a row. -3.08% vs FTSE +2.22%, a -5.29% gap. Both the portfolio and the FTSE underperformed SPY's +26% that year, driven by Magnificent Seven dominance in US markets.
Why the UK Works for Value Investing
The UK market has structural characteristics that favor earnings-yield strategies. The corporate culture emphasizes dividends over buybacks and growth reinvestment. Accounting standards and governance norms tend toward conservative financial reporting. The market has historically attracted investors who think in terms of yield and fundamental value rather than growth optionality.
This means high-earnings-yield UK stocks are often genuinely cheap, temporarily ignored by growth-oriented global capital flows, rather than cheap for structural reasons. The UK discount to global markets has been a recurring feature since 2016, and earnings-yield screens have harvested some of that discount consistently.
Run It Yourself
Current UK yield gap screen:
SELECT
    k.symbol,
    p.companyName,
    p.exchange,
    p.sector,
    ROUND(k.earningsYieldTTM * 100, 2) AS earnings_yield_pct,
    ROUND(1.0 / NULLIF(k.earningsYieldTTM, 0), 1) AS implied_pe,
    ROUND(k.returnOnEquityTTM * 100, 2) AS roe_pct,
    ROUND(fr.debtToEquityRatioTTM, 2) AS debt_to_equity,
    ROUND(k.freeCashFlowYieldTTM * 100, 2) AS fcf_yield_pct,
    ROUND(p.marketCap / 1e9, 2) AS mktcap_b
FROM key_metrics_ttm k
JOIN profile p ON k.symbol = p.symbol
JOIN financial_ratios_ttm fr ON k.symbol = fr.symbol
WHERE k.earningsYieldTTM > 0.065        -- EY > 6.5% (rfr=3.5%+3%)
  AND k.earningsYieldTTM < 0.50
  AND k.returnOnEquityTTM > 0.08
  AND (fr.debtToEquityRatioTTM IS NULL
       OR (fr.debtToEquityRatioTTM >= 0 AND fr.debtToEquityRatioTTM < 2.0))
  AND p.marketCap > 500000000           -- £500M+
  AND (p.industry IS NULL OR p.industry NOT LIKE 'Asset Management%')
  AND (p.industry IS NULL OR p.industry NOT LIKE 'Shell Companies%')
  AND p.exchange IN ('LSE')
  AND p.isFund = false
  AND p.isEtf = false
  AND p.isActivelyTrading = true
QUALIFY ROW_NUMBER() OVER (PARTITION BY p.companyName
                           ORDER BY p.averageVolume DESC) = 1
ORDER BY k.earningsYieldTTM DESC
LIMIT 30
Run this query on Ceta Research Data Explorer
Full backtest:
git clone https://github.com/ceta-research/backtests.git
cd backtests
pip install -r requirements.txt
python3 yield-gap/backtest.py --preset uk --output results.json --verbose
Limitations
Currency risk not modeled: Returns are in local currency (GBP). A USD-based investor would face GBP/USD fluctuations on top of the equity returns. GBP weakened significantly after Brexit (2016) and during the 2022 Truss budget crisis. Both periods would have reduced USD returns.
Small average portfolio: The strategy averaged 14.3 stocks when invested, the second-smallest book of any market in the study and well below the 21-28 range typical elsewhere. Concentration risk is higher. A single sector event can dominate the portfolio. In two years the book fell below the 10-stock floor entirely and the backtest held cash.
Political and regulatory risk: UK markets carry Brexit-related risks, financial regulation changes, and tax policy uncertainty that don't appear in the backtest data.
Survivorship bias and FMP coverage: LSE coverage in FMP is broad but may underrepresent smaller companies that were acquired or delisted mid-period.
Data: Ceta Research (FMP financial data warehouse), January 2000 through January 2025. Full methodology: github.com/ceta-research/backtests/blob/main/METHODOLOGY.md.
Academic references: Campbell, J.Y. & Vuolteenaho, T. (2004). "Bad Beta, Good Beta." American Economic Review, 94(5). Damodaran, A. (2012). "Equity Risk Premiums (ERP): Determinants, Estimation and Implications." Stern School of Business.
Past performance does not guarantee future results. This is educational content, not investment advice.

