
Asset Growth Anomaly on German Stocks: 6.39% CAGR, +1.35% Over DAX

Asset Growth Anomaly on German Stocks: Modest Outperformer With Crisis Protection
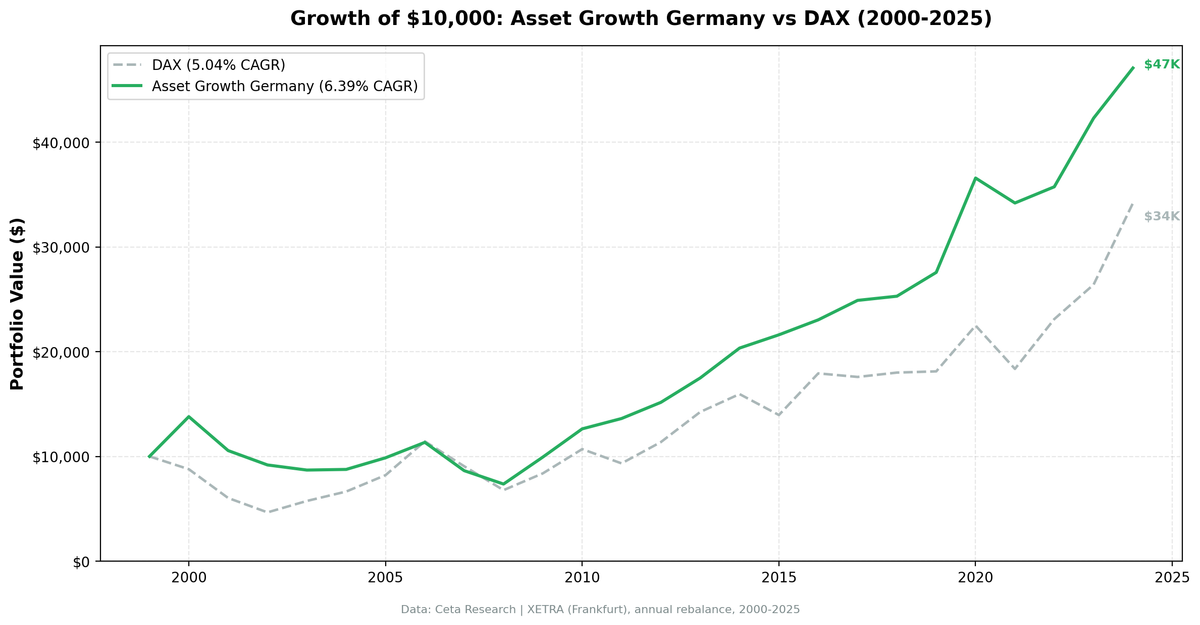
We backtested the asset growth anomaly with quality filters on XETRA-listed German stocks from 2000 to 2025. The portfolio returned 6.39% annually vs 5.04% for the DAX. That's +1.35% annual excess return. The strategy wins 52% of years, beating the DAX in 13 of 25. Combined with lower volatility and a fraction of the downside exposure, this screen works on German equities.
Contents
- Method
- Results
- When It Works
- When It Fails
- Limitations
- Run It Yourself
- Current Screen (SQL)
- Backtest
- Takeaway
- Part of a Series
- References
The crisis protection is where it really stands out. In 2000, the portfolio gained +37.9% while the DAX fell -12.2%. That's +50.1 points of excess return in a single year, the highest of any exchange we tested across 16 markets worldwide. German industrial companies that refused to chase the dot-com boom were rewarded beyond anything the US, Canadian, or Asian versions produced. This backtest is an honest result. It tells you what the asset growth screen does on German stocks: beats the local benchmark with materially less risk, and protects hard when markets break.
Method
Data source: Ceta Research (FMP financial data warehouse) Universe: XETRA (Frankfurt), market cap > €250M (~$273M USD) Period: 2000-2025 (25 annual rebalance periods) Rebalancing: Annual (July), equal weight top 30 by lowest asset growth Benchmark: DAX (^GDAXI) Cash rule: Hold cash if fewer than 10 stocks qualify Transaction costs: Size-tiered model (0.1% mega-cap, 0.3% large-cap, 0.5% mid-cap) Data quality guards: Entry price > $1, single-period return capped at 200%
Historical financial data with 45-day lag to prevent look-ahead bias. Full methodology: backtests/METHODOLOGY.md.
The filters are identical to our US backtest:
| Criterion | Metric | Threshold |
|---|---|---|
| Capital discipline | Asset Growth (YoY) | -20% to +10% |
| Profitability | Return on Equity | > 8% |
| Asset efficiency | Return on Assets | > 5% |
| Pricing power | Operating Margin | > 10% |
| Size | Market Cap | > €250M (~$273M USD) |
Results
| Metric | Portfolio | DAX |
|---|---|---|
| CAGR | 6.39% | 5.04% |
| Total Return | 370.74% | 241.86% |
| Max Drawdown | -46.64% | -53.43% |
| Volatility | 16.31% | 21.11% |
| Sharpe Ratio | 0.269 | 0.144 |
| Sortino Ratio | 0.497 | 0.239 |
| Win Rate (vs DAX) | 52% | -- |
| Beta | 0.455 | 1.00 |
| Alpha | 3.01% | -- |
| Up Capture | 62.88% | -- |
| Down Capture | 13.66% | -- |
| Cash Periods | 0/25 | -- |
| Avg Stocks | 20.6 | -- |
The portfolio beats the DAX by +1.35% annually over 25 years, turning $10,000 into $47,074 vs $34,186 for the index. It does this with less risk across every metric. Volatility is lower (16.31% vs 21.11%), max drawdown is shallower (-46.64% vs -53.43%), and both Sharpe and Sortino ratios nearly double the benchmark.
The beta of 0.455 means the portfolio moves at under half the DAX's intensity. Down capture of 13.66% is exceptional. The portfolio participated in 63% of the upside while absorbing barely a seventh of the downside. Alpha of 3.01% confirms the screen adds meaningful value on a risk-adjusted basis. Zero cash periods over 25 years confirms the XETRA universe is deep enough to always fill a portfolio.
The 52% win rate means the strategy beats the DAX slightly more often than not. But the real edge is asymmetric: in the 13 winning years, the average excess is +15.8 points. The screen doesn't need every year to work. It needs the crisis years to be large, and they are.
When It Works
The strategy's value shows up during market dislocations and volatile periods. The two clearest examples came during the dot-com bust and the global financial crisis.
2000 (Dot-Com Bust): The single best excess year of any exchange in our 16-market global test.
| Year | Portfolio | DAX | Excess |
|---|---|---|---|
| 2000 | +37.9% | -12.2% | +50.1 |
Germany had its own version of the tech bubble. The Neuer Markt (Germany's NASDAQ equivalent) peaked in March 2000 and eventually lost 96% of its value before being shut down entirely. Deutsche Telekom, Infineon, and a wave of internet startups had been growing assets aggressively through acquisitions and capacity expansion. The screen excluded all of them. It held Mittelstand-style companies with stable balance sheets, strong margins, and controlled growth. When the crash came, these stocks had nothing to write down. The +37.9% absolute return during a year when the DAX fell -12.2% reflects the sheer demand for quality during a panic.
2008-2009 (Global Financial Crisis): The screen limited losses during the crash and captured the recovery.
| Year | Portfolio | DAX | Excess |
|---|---|---|---|
| 2008 | -14.8% | -25.2% | +10.4 |
| 2009 | +35.0% | +23.6% | +11.3 |
The 2008 loss of -14.8% was meaningful but roughly 60% of the DAX's drawdown. The recovery in 2009 was equally strong. German capital-disciplined companies snapped back at +35.0%, beating the DAX by 11.3 points. Industrial exporters with clean balance sheets and strong order books were the first to benefit as global trade recovered. Combined, the two-year stretch produced +21.7 points of excess return.
2011, 2015, 2019-2021: The screen also outperformed during the eurozone debt crisis (+20.5 excess in 2011), the China-driven sell-off (+18.8 in 2015), and the COVID cycle (+8.5 in 2020, +11.9 in 2021). In every period where the DAX fell or stumbled, capital-disciplined stocks held up.
When It Fails
2003 (Post-Bust Recovery): The portfolio missed the rebound entirely.
| Year | Portfolio | DAX | Excess |
|---|---|---|---|
| 2003 | -5.3% | +23.4% | -28.7 |
This was the worst single year. After the dot-com bust and a brutal 2001-2002, markets rallied hard in 2003. The recovery favored beaten-down growth stocks, exactly what the screen filters out. Capital-disciplined companies had already held up during the crash, so they didn't have the rubber-band snapback. The portfolio posted a loss while the DAX gained 23%. The 2003-2006 stretch was the strategy's worst period on XETRA, with four consecutive years of underperformance as German markets ran hot.
2006, 2016, 2024 (Strong DAX rallies): The strategy trails when the index surges.
| Year | Portfolio | DAX | Excess |
|---|---|---|---|
| 2006 | +15.0% | +39.3% | -24.4 |
| 2016 | +6.6% | +28.5% | -21.9 |
| 2024 | +11.3% | +29.5% | -18.1 |
When the DAX rips higher on broad momentum, capital-disciplined mid-caps can't keep pace. The screen selects for exactly the companies that don't participate in momentum-driven rallies. In all three years, the portfolio posted positive returns but gave back a large chunk of relative performance. This is the cost of a low-beta strategy: you lag in the years when the benchmark does everything right.
Limitations
Max drawdown still deep. At -46.64%, the portfolio's worst peak-to-trough loss is shallower than the DAX's -53.43%, but it's still a painful ride. The drawdown was concentrated in the 2001-2003 period, when German equities broadly suffered. A 47% peak-to-trough drop tests conviction, even if the benchmark fell further.
Modest absolute CAGR. 6.39% annually is a real return, but it's not a high-growth compounder. The +1.35% excess over the DAX is meaningful when combined with lower volatility and drawdown, but investors used to US-style returns will find the absolute number underwhelming.
Lags hard in DAX rallies. The strategy lost to the DAX by -24.4 points in 2006, -21.9 in 2016, and -18.1 in 2024. When German markets surge on broad momentum, a concentrated portfolio of capital-disciplined mid-caps can't keep up. The 48% losing-year rate means roughly every other year trails the index.
Mittelstand bias. XETRA's qualifying universe skews toward German industrial mid-caps. The Mittelstand (family-owned or closely-held manufacturing companies) dominates the type of firm this screen selects. This creates sector concentration in industrials, auto parts, chemicals, and machinery. A downturn in European manufacturing hits this portfolio harder than the DAX.
Survivorship and universe constraints. The XETRA qualifying universe with a 250M EUR market cap floor produces roughly 20 stocks per year on average. That's thinner than the US or Japanese versions. Delisted stocks may not appear in historical data, which could introduce mild survivorship bias.
Run It Yourself
Run this screen live on Ceta Research
Current Screen (SQL)
WITH bs_current AS (
    SELECT symbol, totalAssets,
        ROW_NUMBER() OVER (PARTITION BY symbol ORDER BY dateEpoch DESC) AS rn
    FROM balance_sheet
    WHERE period = 'FY' AND totalAssets > 0
),
bs_prior AS (
    SELECT symbol, totalAssets AS prior_assets,
        ROW_NUMBER() OVER (PARTITION BY symbol ORDER BY dateEpoch DESC) AS rn
    FROM balance_sheet
    WHERE period = 'FY' AND totalAssets > 0
),
growth AS (
    SELECT bc.symbol,
        (bc.totalAssets - bp.prior_assets) / bp.prior_assets AS asset_growth
    FROM bs_current bc
    JOIN bs_prior bp ON bc.symbol = bp.symbol AND bp.rn = 2
    WHERE bc.rn = 1 AND bp.prior_assets > 0
)
SELECT g.symbol, p.companyName,
    ROUND(g.asset_growth * 100, 2) AS asset_growth_pct,
    ROUND(k.returnOnEquityTTM * 100, 2) AS roe_pct,
    ROUND(k.returnOnAssetsTTM * 100, 2) AS roa_pct,
    ROUND(f.operatingProfitMarginTTM * 100, 2) AS opm_pct,
    ROUND(k.marketCap / 1e9, 2) AS mktcap_bn
FROM growth g
JOIN profile p ON g.symbol = p.symbol
JOIN key_metrics_ttm k ON g.symbol = k.symbol
JOIN financial_ratios_ttm f ON g.symbol = f.symbol
WHERE g.asset_growth < 0.10
  AND g.asset_growth > -0.20
  AND k.returnOnEquityTTM > 0.08
  AND k.returnOnAssetsTTM > 0.05
  AND f.operatingProfitMarginTTM > 0.10
  AND k.marketCap > 250000000
  AND p.exchange = 'XETRA'
ORDER BY g.asset_growth ASC
LIMIT 30
Backtest
# Clone the repo
git clone https://github.com/ceta-research/backtests.git
cd backtests

# Run Germany backtest
python3 asset-growth/backtest.py --preset germany --output results.json --verbose

# Run all exchanges
python3 asset-growth/backtest.py --global --output results/exchange_comparison.json
Takeaway
The asset growth anomaly on XETRA works. It beats the DAX by +1.35% annually over 25 years, with lower volatility, a shallower max drawdown, and a 52% win rate. $10,000 grew to $47,074 vs $34,186 for the index. The risk-adjusted numbers are even better: 0.455 beta, 13.66% down capture, and 3.01% alpha.
The real story is asymmetry. In the 13 years the strategy wins, it wins big. The +50.1 excess in 2000 is the single highest crisis-year outperformance of any exchange in our 14-market test. The +21.7 combined excess during 2008-2009 is equally strong. In the 12 years it loses, the losses are spread across moderate DAX rallies where the portfolio still posts positive returns. The 0.455 beta and 13.66% down capture confirm the pattern: this portfolio barely follows the market down.
The honest framing: this is a solid standalone screen on German equities. It won't keep up during DAX momentum surges, and the absolute CAGR of 6.39% won't excite anyone chasing double-digit returns. But as a capital-disciplined approach to German stocks that beats the local benchmark while taking half the risk, the numbers hold up across 25 years and multiple market cycles.
Part of a Series
This analysis is part of our asset growth anomaly global exchange comparison: - Asset Growth on US Stocks (NYSE + NASDAQ + AMEX), 12.78% CAGR, the baseline - Asset Growth on UK Stocks (LSE), 10.94% CAGR, +9.71% over FTSE 100 - Asset Growth: 16-Exchange Global Comparison, full comparison table
Data: Ceta Research (FMP financial data warehouse), 2000-2025. Universe: XETRA (Frankfurt). Annual rebalance (July), equal weight, top 30 by lowest asset growth. Returns in EUR unless noted. Full methodology: METHODOLOGY.md. Past performance does not guarantee future results. This is educational content, not investment advice.
References
- Cooper, M., Gulen, H. & Schill, M. (2008). "Asset Growth and the Cross-Section of Stock Returns." Journal of Finance, 63(4), 1609-1651.
- Watanabe, A., Xu, Y., Yao, T. & Yu, T. (2013). "The Asset Growth Effect: Insights from International Equity Markets." Journal of Financial Economics, 108(2), 529-563.
- Hou, K., Xue, C. & Zhang, L. (2015). "Digesting Anomalies: An Investment Approach." Review of Financial Studies, 28(3), 650-705.


