
DCF Threshold in Canada: 9.32% CAGR and Negative Down Capture Over 25


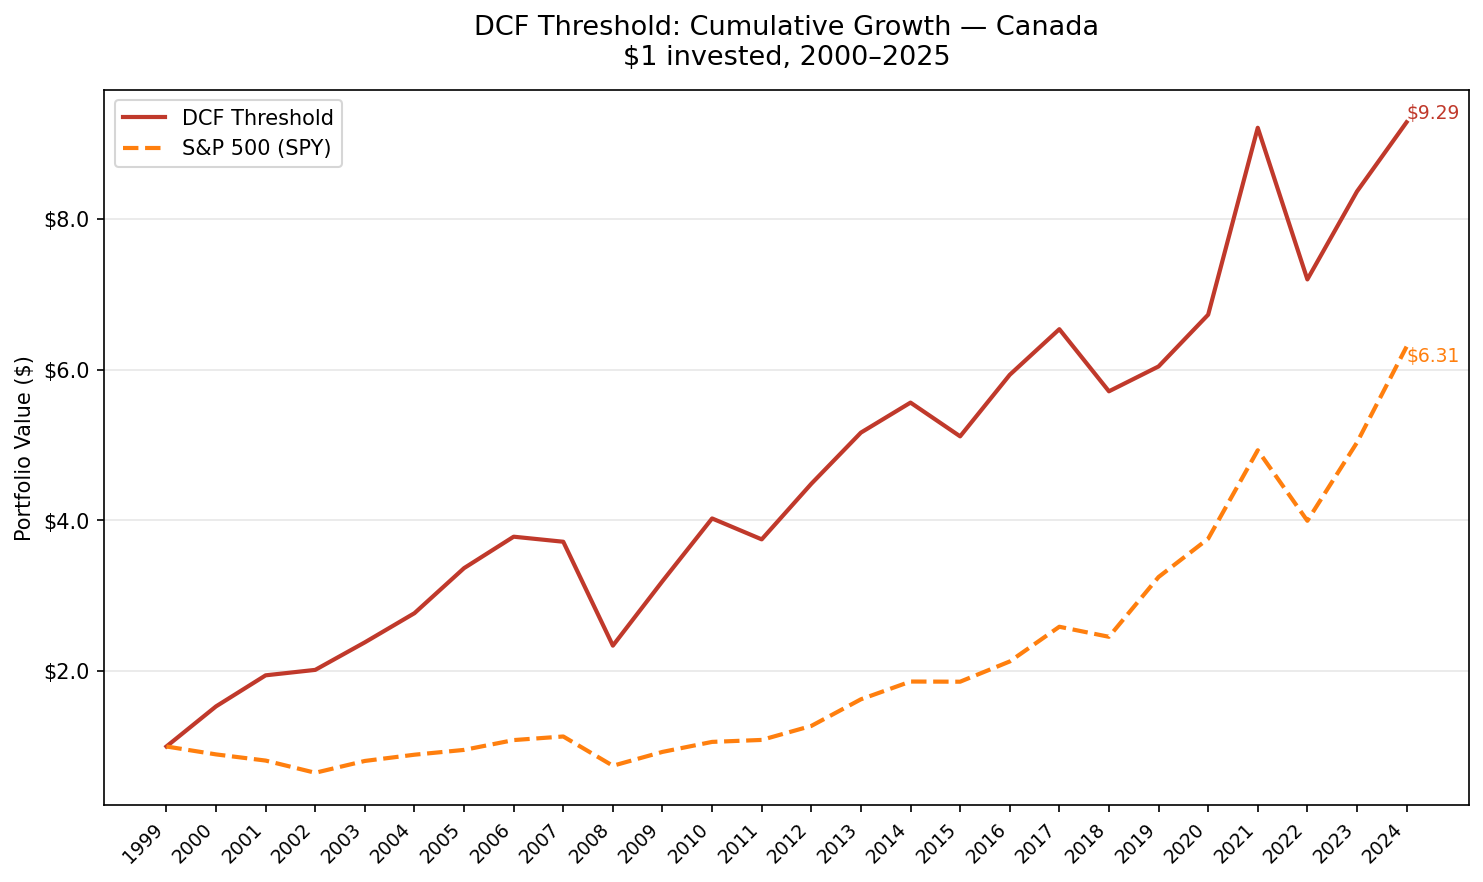
We ran the DCF Threshold screen on 25 years of Canadian stocks from the TSX. The signal: buy the 30 most undervalued companies by Gordon Growth DCF discount, filtered for ROE above 8%, D/E below 1.5, and positive operating cash flow. The strategy returned 9.32% annually vs 7.64% for the S&P 500, with one unusual result: negative down capture. When the market fell, Canadian DCF stocks gained on average.
Contents
- Method
- What We Found
- A strategy that gains when markets fall.
- The 2000–2002 divergence
- Year-by-year returns
- After 2012: structural trailing begins
- 2021: one more commodity moment
- 2008 and 2022: crisis behavior
- Why Canada Is Underrepresented in Finance Content
- Backtest Methodology
- Limitations
- Conclusion
Method
- Data source: Ceta Research (FMP financial data warehouse)
- Universe: TSX (Toronto Stock Exchange), market cap > CAD 500M
- Period: 2000–2025 (25 annual periods)
- Rebalancing: Annual (January), equal weight, top 30 by highest FCF yield
- Benchmark: S&P 500 Total Return (SPY)
- Cash rule: Hold cash if fewer than 10 stocks qualify
Same signal as the US version: FCF/MarketCap ≥ 8.78%, the price-independent equivalent of a 20% discount to Gordon Growth intrinsic value. Quality filters applied identically (ROE > 8%, D/E < 1.5, OCF > 0).
What We Found
A strategy that gains when markets fall.
| Metric | DCF Threshold (Canada) | S&P 500 |
|---|---|---|
| CAGR | 9.32% | 7.64% |
| Total Return | 829% | 531% |
| Sharpe Ratio | 0.356 | 0.294 |
| Sortino Ratio | 0.668 | 0.496 |
| Max Drawdown | -38.21% | -34.90% |
| Up Capture | 83.25% | 100% |
| Down Capture | -4.31% | 100% |
| Win Rate vs SPY | 40% | — |
| Cash Periods | 0 of 25 | — |
| Avg Stocks | 21.8 | — |
The -4.31% down capture is the standout number. A negative down capture means that when SPY fell, the Canadian DCF portfolio was positive on average. Not just cushioned, actually up. This happened because Canada's resource-heavy market structure meant DCF-qualifying stocks were almost entirely in energy, materials, and industrials. When the dot-com bubble collapsed (2000–2002), those sectors surged while US tech crashed.
The flip side is 40% win rate against SPY. The strategy underperforms in most individual years but accumulates alpha through the years when market conditions align with its structural bias.
The 2000–2002 divergence
Three years when the market collapsed and the Canadian DCF screen went the other way:
| Year | DCF Threshold | S&P 500 | Gap |
|---|---|---|---|
| 2000 | +53.2% | -10.5% | +63.7% |
| 2001 | +26.9% | -9.2% | +36.1% |
| 2002 | +3.7% | -19.9% | +23.6% |
Combined 2000–2002: DCF Threshold +100.9% cumulative. SPY -35.1%. A 136-point divergence over three years.
This was structural. The TSX in the early 2000s was weighted heavily toward energy, base metals, and financials. When dot-com valuations collapsed, capital rotated into exactly those sectors. Canadian companies already trading at FCF yield above 8.78% were by definition not the speculative tech names. They were the boring, cash-generating resource stocks that became the market's best performers.
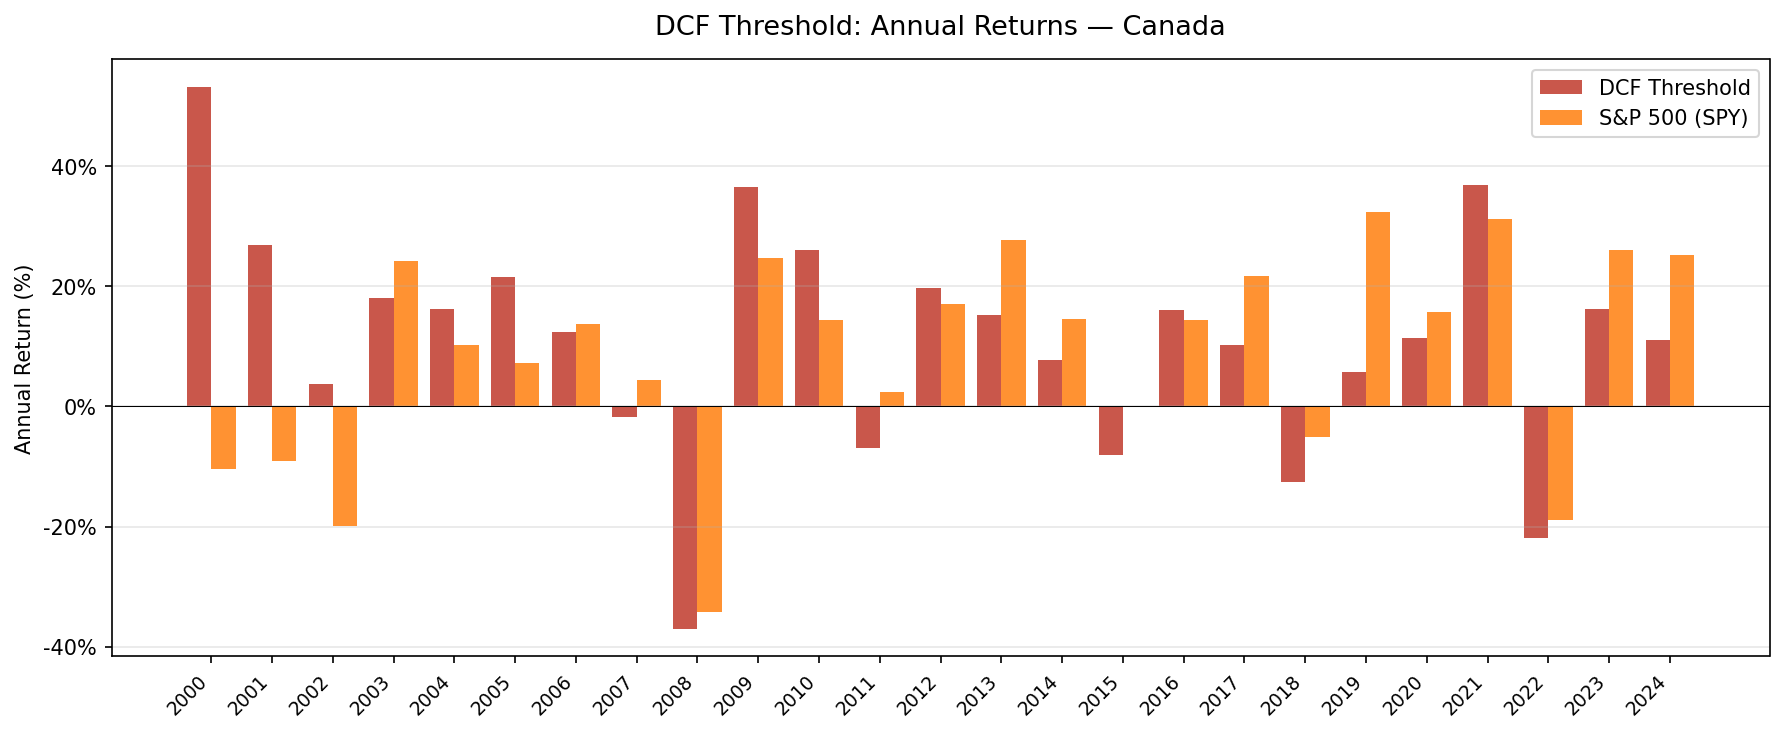
Year-by-year returns
| Year | DCF Threshold | S&P 500 | Excess |
|---|---|---|---|
| 2000 | +53.2% | -10.5% | +63.7% |
| 2001 | +26.9% | -9.2% | +36.1% |
| 2002 | +3.7% | -19.9% | +23.6% |
| 2003 | +18.1% | +24.1% | -6.0% |
| 2004 | +16.2% | +10.2% | +6.0% |
| 2005 | +21.6% | +7.2% | +14.4% |
| 2006 | +12.4% | +13.7% | -1.3% |
| 2007 | -1.8% | +4.4% | -6.2% |
| 2008 | -37.1% | -34.3% | -2.8% |
| 2009 | +36.6% | +24.7% | +11.9% |
| 2010 | +26.1% | +14.3% | +11.7% |
| 2011 | -6.9% | +2.5% | -9.4% |
| 2012 | +19.7% | +17.1% | +2.6% |
| 2013 | +15.1% | +27.8% | -12.6% |
| 2014 | +7.7% | +14.5% | -6.8% |
| 2015 | -8.1% | -0.1% | -7.9% |
| 2016 | +16.0% | +14.4% | +1.5% |
| 2017 | +10.2% | +21.6% | -11.4% |
| 2018 | -12.6% | -5.2% | -7.5% |
| 2019 | +5.8% | +32.3% | -26.5% |
| 2020 | +11.4% | +15.6% | -4.3% |
| 2021 | +36.9% | +31.3% | +5.6% |
| 2022 | -21.9% | -19.0% | -2.9% |
| 2023 | +16.2% | +26.0% | -9.8% |
| 2024 | +11.0% | +25.3% | -14.3% |
After 2012: structural trailing begins
The first twelve years built a significant lead. After 2012, the strategy consistently trails SPY in most years. The reason is the same structural dynamic, reversed.
The period 2013–2024 was dominated by US mega-cap tech growth. SPY returns were increasingly driven by companies like Apple, Microsoft, Alphabet, and Nvidia, none of which would appear in a Canadian FCF yield screen. The TSX remained resource-heavy while US growth stocks repriced higher. A Canadian value screen structurally misses that theme entirely.
The 40% win rate reflects this: the strategy performs well in commodity cycles, post-crisis recoveries, and rate-rising environments. It trails in sustained growth rallies.
2021: one more commodity moment
The strategy's best year in the second half of the backtest was 2021 (+36.9% vs +31.3% for SPY). After the COVID selloff, energy and materials recovered strongly. FCF-generating resource stocks temporarily led the market again. It was a brief return to the conditions that drove the 2000–2002 outperformance.
2008 and 2022: crisis behavior
| Event | DCF Threshold | S&P 500 | Gap |
|---|---|---|---|
| Financial crisis (2008) | -37.1% | -34.3% | -2.8% |
| 2022 bear market | -21.9% | -19.0% | -2.9% |
When both rates and risk appetite shifted simultaneously (2008, 2022), Canadian resource stocks fell alongside the rest of the market. The negative down capture that appeared so strongly in 2000–2002 didn't repeat in these later crises because the selloffs were macroeconomic rather than sector-specific. Energy and materials fell with everything else.
Why Canada Is Underrepresented in Finance Content
Most quantitative finance content focuses on US data. Canadian-specific backtests are rare, which understates how different the market structure is. Canada's FCF universe is heavily weighted toward:
- Energy (oil sands, pipelines, natural gas): structurally high FCF, low growth multiples
- Materials (mining, metals, fertilizers): cyclical FCF, low P/B, often high FCF yield
- Financials (banks, insurance): conservative balance sheets, steady FCF
These three sectors consistently populate the DCF screen. That's why the strategy has zero cash periods (always finds 10+ qualifying stocks) but a win rate of only 40% (underperforms when the sectors underperform). It's sector exposure dressed as factor exposure.
Backtest Methodology
| Parameter | Choice |
|---|---|
| Universe | TSX, Market Cap > CAD 500M |
| Signal | FCF/MCap ≥ 8.78%, ROE > 8%, D/E < 1.5, OCF > 0 |
| Portfolio | Top 30 by FCF yield, equal weight |
| Rebalancing | Annual (January) |
| Cash rule | Hold cash if < 10 qualify |
| Benchmark | S&P 500 Total Return (SPY) |
| Period | 2000–2025 (25 years) |
| Data | Point-in-time (45-day lag on FY financial statements) |
| Transaction costs | Size-tiered (0.1%–0.5% one-way) |
Limitations
Sector concentration. The Canadian FCF screen is effectively a resource and financial sector bet. In years when those sectors underperform, the strategy underperforms, regardless of individual stock quality.
Win rate of 40%. The strategy loses to SPY in 15 of 25 years. It generates alpha through a handful of large positive years, mostly concentrated in the early 2000s. An investor who started this strategy in 2004 would have had a substantially worse experience than the full-period numbers suggest.
Benchmark mismatch. Using SPY (US market) as the benchmark for a Canadian strategy introduces currency effects and market structure differences. The TSX and S&P 500 have very different sector compositions, so excess return partly reflects sector rotation rather than pure stock selection.
2008 and 2022 loss. Despite the negative down capture headline, the strategy still lost 37.1% in 2008 and 21.9% in 2022. Negative average down capture doesn't mean protected. It means that in the specific configuration of market selloffs tested, Canadian resource stocks had their own positive periods.
Conclusion
The Canadian DCF Threshold result looks unusual on paper, negative down capture with below-average win rate. But it's a coherent structural story. Canada's FCF-generating companies are concentrated in energy, materials, and financials. Those sectors thrive precisely when growth-driven markets collapse. The early 2000s produced a massive divergence (+136 percentage points vs SPY over three years) that anchored the long-run alpha.
For investors who believe commodity cycles and rate-rising environments will periodically reassert themselves, the Canadian DCF screen provides specific, mechanically-derived exposure to the kinds of companies that benefit. The signal works. The caveat is that "working" means behaving very differently from US market benchmarks, in ways that require conviction.
Part of a Series: Global | US | UK | India
Run It Yourself
Explore the data behind this analysis on Ceta Research. Query our financial data warehouse with SQL, build custom screens, and run your own backtests across 70,000+ stocks on 20 exchanges.
Data: Ceta Research (FMP financial data warehouse). Backtest: 2000–2025. Past performance doesn't guarantee future results. Full methodology at github.com/ceta-research/backtests.


