
DCF Threshold in the UK: 9.10% CAGR Over 21 Invested Years of LSE Data

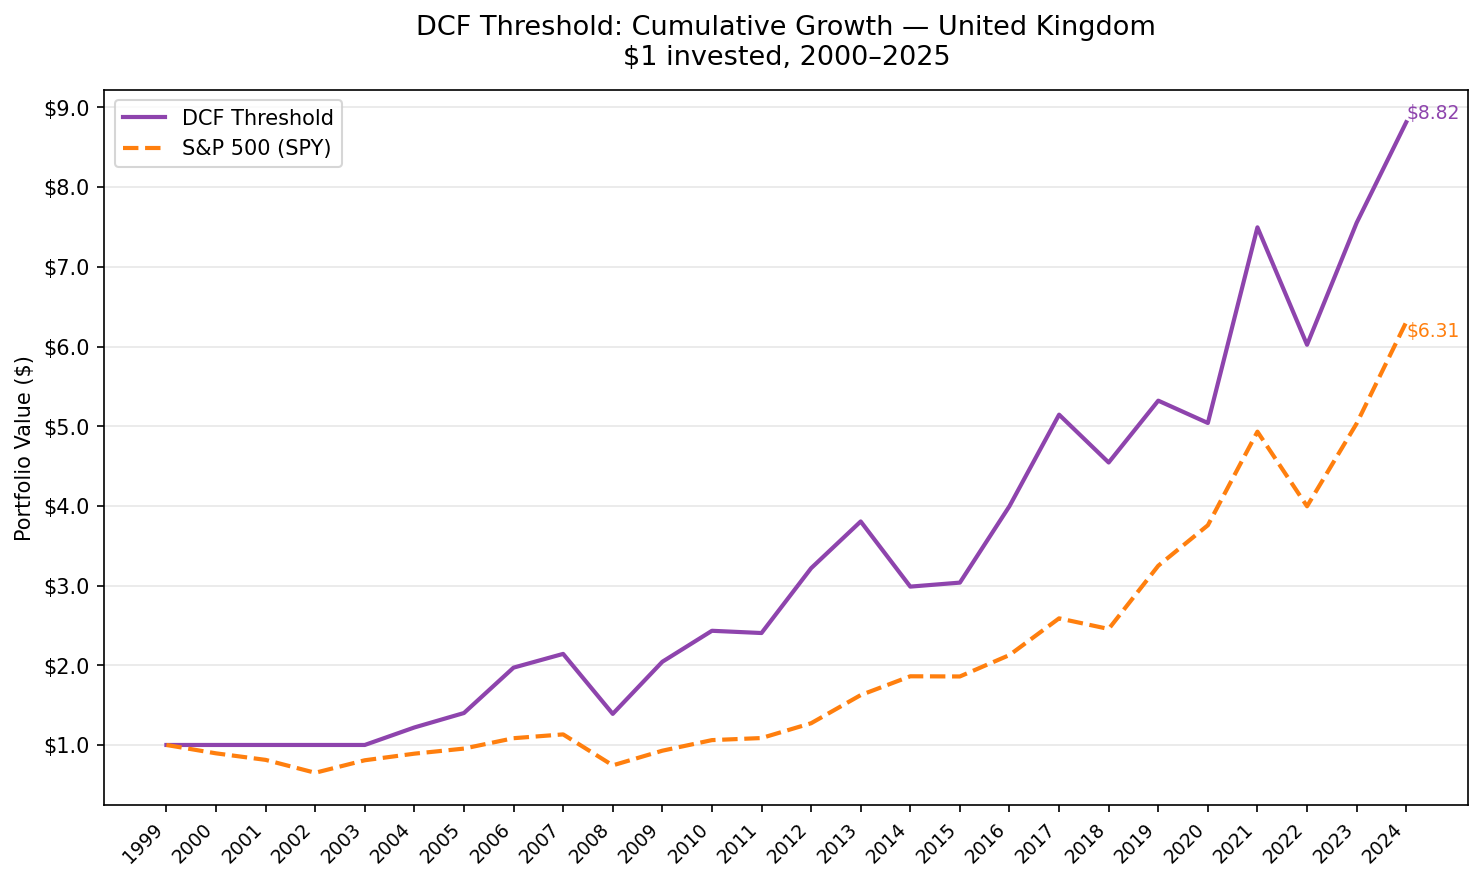
We ran the DCF Threshold screen on 25 years of UK stocks from the London Stock Exchange. Buy the 30 most undervalued companies by Gordon Growth DCF discount, filtered for ROE above 8%, D/E below 1.5, and positive operating cash flow. The strategy found no qualifying stocks in the first four years (2000–2003), then returned 9.10% annually over the full 25-year period, 1.45% above the S&P 500 benchmark, with a consistent pattern of value recovery and occasional sharp losses.
Contents
- Method
- What We Found
- Consistent but not spectacular.
- The 2000–2003 cash period
- Year-by-year returns
- The strong years: 2006, 2009, 2012, 2021
- The problem year: 2014
- 2020: COVID and UK-specific drag
- UK Market Context
- Backtest Methodology
- Limitations
- Conclusion
Method
- Data source: Ceta Research (FMP financial data warehouse)
- Universe: LSE (London Stock Exchange), market cap > GBP 500M
- Period: 2000–2025 (25 annual periods; 21 invested years, 2004–2024)
- Rebalancing: Annual (January), equal weight, top 30 by highest FCF yield
- Benchmark: S&P 500 Total Return (SPY)
- Cash rule: Hold cash if fewer than 10 stocks qualify
Signal: FCF/MarketCap ≥ 8.78%, the price-independent equivalent of a 20% discount to Gordon Growth intrinsic value. Same quality filters as all DCF Threshold variants: ROE > 8%, D/E < 1.5, OCF > 0.
What We Found

Consistent but not spectacular.
| Metric | DCF Threshold (UK) | S&P 500 |
|---|---|---|
| CAGR | 9.10% | 7.64% |
| Total Return | 782% | 531% |
| Sharpe Ratio | 0.261 | 0.237 |
| Sortino Ratio | 0.508 | 0.383 |
| Max Drawdown | -35.13% | -34.90% |
| Up Capture | 105.4% | 100% |
| Down Capture | 65.99% | 100% |
| Win Rate vs SPY | 56% | — |
| Cash Periods | 4 of 25 | — |
| Avg Stocks | 17.5 (when invested) | — |
The UK result is more modest than the US or India. 1.45% annual excess return with a Sharpe of 0.261. But the characteristics are attractive for the type of investor this strategy suits: lower max drawdown (-35.13% vs -40% for the US version), 66% down capture (US was 38%), and 56% win rate.
The lower down capture means the UK portfolio is more correlated with market declines than the US version. That's partly because the UK universe has thinner average stock counts (17.5 vs 21 for US), and partly because LSE stocks at these quality thresholds tend toward more cyclical sectors than the US screened universe.
The 2000–2003 cash period
UK coverage in the FMP dataset was sparse before 2004. The strategy held cash for the first four years, which means the effective sample is 21 years, not 25. The CAGR computation includes the cash years, so the 9.10% figure is honest on a full-period basis.
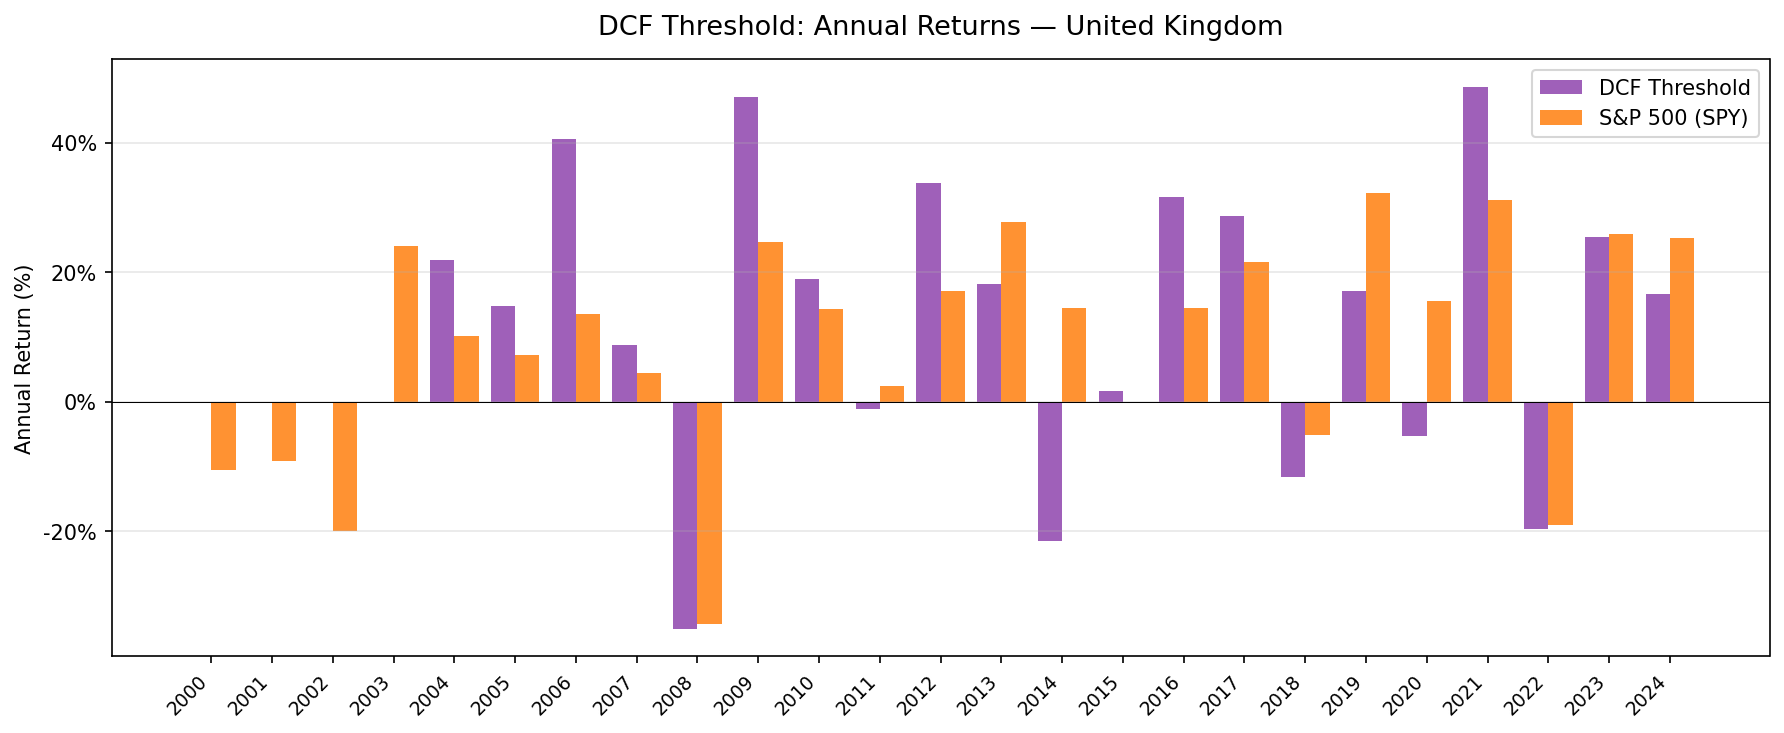
Year-by-year returns
| Year | DCF Threshold | S&P 500 | Excess |
|---|---|---|---|
| 2000 | 0.0% (cash) | -10.5% | — |
| 2001 | 0.0% (cash) | -9.2% | — |
| 2002 | 0.0% (cash) | -19.9% | — |
| 2003 | 0.0% (cash) | +24.1% | — |
| 2004 | +22.0% | +10.2% | +11.7% |
| 2005 | +14.9% | +7.2% | +7.7% |
| 2006 | +40.7% | +13.7% | +27.0% |
| 2007 | +8.8% | +4.4% | +4.3% |
| 2008 | -35.1% | -34.3% | -0.8% |
| 2009 | +47.0% | +24.7% | +22.3% |
| 2010 | +19.0% | +14.3% | +4.7% |
| 2011 | -1.1% | +2.5% | -3.6% |
| 2012 | +33.8% | +17.1% | +16.7% |
| 2013 | +18.2% | +27.8% | -9.5% |
| 2014 | -21.5% | +14.5% | -36.0% |
| 2015 | +1.7% | -0.1% | +1.8% |
| 2016 | +31.6% | +14.4% | +17.2% |
| 2017 | +28.7% | +21.6% | +7.1% |
| 2018 | -11.7% | -5.2% | -6.5% |
| 2019 | +17.1% | +32.3% | -15.2% |
| 2020 | -5.3% | +15.6% | -20.9% |
| 2021 | +48.7% | +31.3% | +17.4% |
| 2022 | -19.7% | -19.0% | -0.7% |
| 2023 | +25.4% | +26.0% | -0.6% |
| 2024 | +16.7% | +25.3% | -8.6% |
The strong years: 2006, 2009, 2012, 2021
Four years stand out as large positive excess returns: 2006 (+27.0%), 2009 (+22.3%), 2012 (+16.7%), and 2021 (+17.4%). Each reflects a different dynamic.
2006 was a commodity and financial rally year globally. UK listed companies in those sectors held deep FCF yields relative to their intrinsic value. The screen captured the re-rating.
2009 was the post-crisis recovery. UK value stocks bounced harder than the US market, consistent with the pattern in other markets where deep discounts closed quickly once credit markets stabilized.
2012 was the European recovery year. After the sovereign debt crisis bottomed, UK industrials and financials with quality fundamentals outperformed.
2021 was the post-COVID reopening trade. UK companies, particularly in energy and financials, that had been deeply discounted through 2020 recovered sharply.
The problem year: 2014
2014 was the strategy's worst single year: -21.5% vs +14.5% for SPY, a 36-point gap. This was specific to the UK that year. Oil prices collapsed in late 2014. Several large UK energy companies that qualified on FCF (pre-collapse) held positions into the downturn. The combination of sterling weakness and energy sector correction was severe.
This is the kind of tail risk that quality filters reduce but don't eliminate. A company can have positive FCF, low debt, and positive ROE at the start of a year and still lose 40% by year end if the commodity price underlying its cash flow collapses. The January rebalance doesn't allow mid-year exit.
2020: COVID and UK-specific drag
The UK strategy returned -5.3% in 2020 while SPY returned +15.6%. A 20.9-point gap. UK markets generally underperformed global indices during COVID due to Brexit uncertainty compounding the pandemic shock. UK-listed companies also had heavier exposure to hospitality, travel, and retail sectors that were disproportionately affected. The DCF screen couldn't protect against those sector dynamics.
UK Market Context
The LSE universe that passes DCF Threshold quality filters is concentrated in a few sectors:
- Financials (banks, insurance, asset managers): consistently high FCF yield, low debt post-2009
- Energy and utilities: infrastructure-heavy, steady FCF but commodity exposure
- Consumer staples (food, beverages, household goods): defensive FCF generators
This creates different exposure than US or Canadian DCF portfolios. UK financials re-rated upward from 2009 onward as the banking sector recovered; that's partly why 2009, 2012, and 2016 were strong. UK energy names hurt in 2014 and contributed to 2020 underperformance.
The 17.5 average stocks when invested is the thinnest portfolio in the four featured markets. Years with fewer qualifying stocks are more susceptible to single-name concentration.
Backtest Methodology
| Parameter | Choice |
|---|---|
| Universe | LSE, Market Cap > GBP 500M |
| Signal | FCF/MCap ≥ 8.78%, ROE > 8%, D/E < 1.5, OCF > 0 |
| Portfolio | Top 30 by FCF yield, equal weight |
| Rebalancing | Annual (January) |
| Cash rule | Hold cash if < 10 qualify |
| Benchmark | S&P 500 Total Return (SPY) |
| Period | 2000–2025 (25 years; 21 invested years from 2004) |
| Data | Point-in-time (45-day lag on FY financial statements) |
| Transaction costs | Size-tiered (0.1%–0.5% one-way) |
Limitations
2014 tail risk (-36% gap). The energy sector collapse illustrated how sector concentration in annual rebalancing can produce severe single-year losses. A position entered in January on clean fundamentals can be devastating by December if the underlying commodity collapses.
21 effective years. The four cash years reduce the sample. The DCF screen started operating in the UK only from 2004 in this dataset. Investors should note this is a 21-year sample, not 25.
Thin portfolio. 17.5 average stocks is below the 21–25 range seen in the US, Canada, and India. Individual stock risk is higher.
Benchmark mismatch. Comparing UK returns to SPY introduces currency effects and different macro conditions. Much of the underperformance in 2019–2020 reflects UK-specific Brexit uncertainty rather than the DCF signal's failure.
66% down capture. Unlike the US version's 38% down capture, the UK strategy participates in roughly two-thirds of market downturns. It provides less cushioning than the US variant.
Conclusion
The UK DCF Threshold result is steady rather than spectacular: 9.10% CAGR, 1.45% annual excess return, 56% win rate. The pattern of strong recovery years (2006, 2009, 2012, 2016, 2021) punctuated by occasional sector-specific disasters (2014) is consistent with how a concentrated value screen operates in a market with significant energy and financial exposure.
The strategy is investable for investors who want UK equity exposure with a mechanical value and quality discipline. It's not a downside protection strategy, the 66% down capture and occasional -36% underperformance years make that clear. It's a systematic selection of the UK's most cash-generative, sound companies at moments when the market has priced them below intrinsic value.
The comparison across all 13 markets is in the companion post.
Part of a Series: Global | US | India | Canada
Run It Yourself
Explore the data behind this analysis on Ceta Research. Query our financial data warehouse with SQL, build custom screens, and run your own backtests across 70,000+ stocks on 20 exchanges.
Data: Ceta Research (FMP financial data warehouse). Backtest: 2000–2025. Past performance doesn't guarantee future results. Full methodology at github.com/ceta-research/backtests.


