
Dividend Coverage on UK Stocks: 9.38% CAGR, 80% Win Rate, Strong Drawdown Protection
Dividend coverage on LSE: 9.38% CAGR over 25 years, 80% win rate, max drawdown -23.46%. During 2008, coverage stocks fell just 3.8% while the FTSE 100 dropped 22.0%.

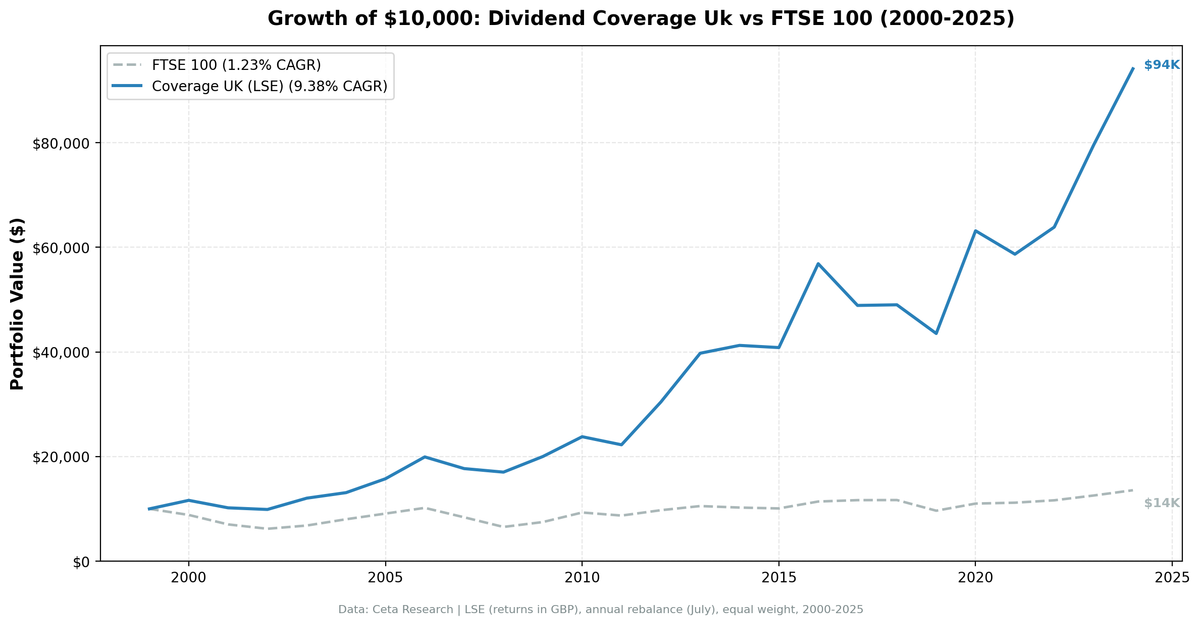
We ran the FCF-based dividend coverage screen on LSE-listed UK equities. 9.38% CAGR over 25 years. 8.16% annual alpha over the FTSE 100. The standout numbers: an 80% win rate and a max drawdown of just -23.46%, the shallowest of any developed market we tested. During the 2008 financial crisis, coverage stocks fell only 3.8% while the FTSE 100 dropped 22.0%. During Brexit year 2016, they returned +39.3%.
Contents
- Method
- The Screen (SQL)
- What We Found
- 25 years of data. 8.16% annual alpha over the FTSE 100.
- Year-by-Year Returns
- Key Observations
- 2008: Strong Crisis Protection
- Brexit Year 2016: +39.3%
- 2020: The Best Single Year
- Where the Strategy Struggles
- 80% Win Rate: Consistency Over Explosiveness
- Max Drawdown: -23.46%
- Currency Note
- Limitations
- Takeaway
- Part of a Series
- References
- Run This Screen Yourself
The UK market rewarded dividend coverage screening with consistent, defensive results. Not the highest CAGR, but a strong combination of reliability and downside protection.
Data: FMP financial data warehouse, 2000–2025. Updated March 2026.
Method
This post uses the same dividend coverage screen described in the US backtest. The only difference is the universe: LSE-listed UK equities instead of US exchanges.
Data source: Ceta Research (FMP financial data warehouse) Universe: LSE (UK), market cap > GBP 500M Period: 2000-2025 (25 years, 25 annual periods) Rebalancing: Annual (July), equal weight top 30 by coverage descending Benchmark: FTSE 100 (^FTSE, price return) Cash rule: Hold cash if fewer than 10 stocks qualify Transaction costs: Size-tiered model (0.1-0.5% one-way based on market cap)
(Note: benchmark is price return index, excluding dividends.)
Financial data uses a 45-day lag to prevent look-ahead bias. July rebalance ensures fiscal year filings are available.
Signal: FCF / ABS(Common Dividends Paid) between 1.5x and 20x Filters: Dividend Yield > 2%, Market Cap > GBP 500M
The Screen (SQL)
WITH latest_cf AS (
    SELECT c.symbol, c.freeCashFlow, c.commonDividendsPaid, c.date,
        ROW_NUMBER() OVER (PARTITION BY c.symbol ORDER BY c.date DESC) AS rn
    FROM cash_flow_statement c
    JOIN profile p ON c.symbol = p.symbol
    WHERE c.period = 'FY'
      AND c.commonDividendsPaid < 0
      AND c.freeCashFlow > 0
      AND p.exchange = 'LSE'
),
latest_ratios AS (
    SELECT symbol, dividendYield, date,
        ROW_NUMBER() OVER (PARTITION BY symbol ORDER BY date DESC) AS rn
    FROM financial_ratios
    WHERE period = 'FY' AND dividendYield IS NOT NULL
),
latest_metrics AS (
    SELECT symbol, marketCap, date,
        ROW_NUMBER() OVER (PARTITION BY symbol ORDER BY date DESC) AS rn
    FROM key_metrics
    WHERE period = 'FY' AND marketCap IS NOT NULL
)
SELECT
    cf.symbol,
    ROUND(cf.freeCashFlow / NULLIF(ABS(cf.commonDividendsPaid), 0), 2) AS coverage,
    ROUND(r.dividendYield * 100, 2) AS yield_pct,
    ROUND(cf.freeCashFlow / 1e9, 2) AS fcf_bn,
    ROUND(km.marketCap / 1e9, 1) AS mktcap_bn
FROM latest_cf cf
JOIN latest_ratios r ON cf.symbol = r.symbol AND r.rn = 1
JOIN latest_metrics km ON cf.symbol = km.symbol AND km.rn = 1
WHERE cf.rn = 1
  AND cf.freeCashFlow / NULLIF(ABS(cf.commonDividendsPaid), 0) BETWEEN 1.5 AND 20
  AND r.dividendYield > 0.02
  AND km.marketCap > 500e6
ORDER BY coverage DESC
LIMIT 30
Run this query on Ceta Research
What We Found
25 years of data. 8.16% annual alpha over the FTSE 100.
| Metric | Coverage (LSE) | FTSE 100 |
|---|---|---|
| CAGR | 9.38% | 1.23% |
| Total Return | 841% | 36% |
| Volatility | 17.50% | 12.91% |
| Max Drawdown | -23.46% | -38.07% |
| Sharpe Ratio | 0.336 | -0.176 |
| Win Rate (annual) | 80% | - |
| Avg Stocks per Period | 12.2 | - |
| Cash Periods | 0 of 25 | - |
$10,000 invested in 2000 grew to roughly $94,000.
The numbers that matter most here aren't the CAGR or total return. They're the max drawdown (-23.46%) and the win rate (80%). The strategy beat the benchmark in 20 of 25 years. When it was invested, it averaged just 12.2 stocks per period. The screen found qualifying stocks in every year, but the LSE dividend-coverage universe is thin, so the portfolio runs concentrated.
The Sharpe ratio of 0.336 tells the same story from a different angle: solid return per unit of risk. The lower volatility (17.50% vs the US result's 22.4%) reflects the LSE universe of stable dividend payers. Consumer staples, energy majors, financials, and utilities. These are not exciting stocks. They're steady ones.
Year-by-Year Returns
| Year | Coverage | FTSE 100 | Excess |
|---|---|---|---|
| 2000 | +16.3% | -11.7% | +27.9% |
| 2001 | -12.3% | -20.5% | +8.2% |
| 2002 | -3.1% | -11.9% | +8.8% |
| 2003 | +21.9% | +10.0% | +11.9% |
| 2004 | +8.8% | +17.6% | -8.8% |
| 2005 | +20.2% | +13.5% | +6.7% |
| 2006 | +26.5% | +12.0% | +14.5% |
| 2007 | -11.2% | -17.7% | +6.5% |
| 2008 | -3.8% | -22.0% | +18.1% |
| 2009 | +17.5% | +14.3% | +3.3% |
| 2010 | +18.9% | +24.4% | -5.4% |
| 2011 | -6.5% | -6.3% | -0.2% |
| 2012 | +36.7% | +11.8% | +25.0% |
| 2013 | +30.7% | +8.1% | +22.5% |
| 2014 | +3.8% | -2.7% | +6.5% |
| 2015 | -1.0% | -1.6% | +0.6% |
| 2016 | +39.3% | +13.1% | +26.2% |
| 2017 | -14.0% | +2.3% | -16.3% |
| 2018 | +0.2% | +0.1% | +0.1% |
| 2019 | -11.2% | -17.4% | +6.3% |
| 2020 | +45.1% | +14.2% | +31.0% |
| 2021 | -7.1% | +1.5% | -8.6% |
| 2022 | +8.8% | +4.1% | +4.8% |
| 2023 | +24.5% | +7.9% | +16.6% |
| 2024 | +18.4% | +8.1% | +10.3% |
Key Observations
2008: Strong Crisis Protection
| Year | Coverage (LSE) | FTSE 100 | Excess |
|---|---|---|---|
| 2007 | -11.2% | -17.7% | +6.5% |
| 2008 | -3.8% | -22.0% | +18.1% |
The FTSE 100 lost 22.0% in 2008. LSE coverage stocks fell just 3.8%. That 18.1-point cushion is one of the strongest crisis-year cushions in our entire global comparison. The screen did two things right. First, it excluded banks and financials with deteriorating cash flows before the crisis hit. Second, the UK dividend universe is heavy on defensive sectors: consumer staples, utilities, energy, and healthcare. These sectors held up far better than financials and cyclicals during 2008.
The protection extended through 2007 too. When the FTSE 100 fell 17.7%, LSE coverage stocks lost 11.2%. Across the full financial crisis (2007-2008), the strategy lost about 15% while the FTSE 100 lost nearly 36%. That is meaningful downside protection.
Brexit Year 2016: +39.3%
+39.3% vs +13.1% for the FTSE 100. 26 points of alpha. The Brexit vote in June 2016 crashed GBP by 15% against the USD. For UK exporters and multinationals with overseas revenue (many of which populate the coverage screen), the weaker pound was a tailwind for cash flow generation. The July rebalance loaded these companies into the portfolio right as their earnings power was increasing in GBP terms.
2020: The Best Single Year
+45.1% vs +14.2% for the FTSE 100. 31 points of excess return, the best single year for UK coverage. UK dividend payers were brutalized during the COVID crash. Many blue-chip names on the FTSE cut or suspended dividends. But companies that maintained strong FCF coverage through the disruption were priced as if they too would cut. They didn't. The recovery was extraordinary.
Where the Strategy Struggles
2017 was the worst year: -14.0% vs +2.3% for the FTSE 100, a -16.3% excess. UK growth and large-cap names led that year while dividend-heavy sectors (energy, financials, consumer staples) lagged. The same sector tilt that protects in downturns costs during growth rallies.
2004 (-8.8%) and 2021 (-8.6%) were the other weak relative years. The pattern is consistent: the screen gives back ground when the index is driven by sectors it underweights. The 25-year track record justifies sitting through those years, but any individual investor would feel the strain.
80% Win Rate: Consistency Over Explosiveness
The strategy beat the FTSE 100 in 20 of 25 years. That's among the highest win rates we tested, just behind Sweden's 84%. Most years the alpha was modest (3-15 points), with losses concentrated in just a few periods. Compare this to the US result (64% win rate) or Germany (80%). The UK strategy doesn't rely on a few monster years to carry the average. It grinds out alpha steadily.
Max Drawdown: -23.46%
The max drawdown of -23.46% is well below what the broad FTSE 100 experienced across the full period and far lower than the XETRA coverage result (-47.63%). The combination of defensive sector exposure and the 2008 crisis protection keeps the drawdown contained, the shallowest of any developed market in our test.
Currency Note
LSE returns are in GBP. The benchmark (FTSE 100) is also GBP-denominated, so the comparison is clean. Note that the FTSE 100 is a price return index: it excludes dividends. The strategy's total return includes dividends reinvested, so part of the 8.16% annual alpha reflects this structural difference. For reference, vs the S&P 500 Total Return (SPY), the strategy delivered approximately 1.53% annual alpha over the same period.
The GBP weakened significantly against the USD over this 25-year window, from roughly $1.50 in 2000 to $1.25-1.30 now. A USD-based investor would see lower absolute returns after currency conversion. GBP-based investors see the numbers as reported.
Limitations
Thin, concentrated universe. The screen averaged just 12.2 qualifying stocks per year, the fewest of any market we tested. A 12-stock portfolio carries meaningful single-name risk. The LSE dividend-coverage pool is shallow, so individual holdings move the result more than they would in a deeper market like the US.
Annual rebalancing is slow. A company's coverage can deteriorate between July rebalances. The 2017 underperformance might have been partially avoided with more frequent rebalancing.
Coverage is backward-looking. The ratio uses last fiscal year's cash flow statement. COVID-era dividend cuts in 2020 happened to companies that had strong coverage in their 2019 filings.
Sector concentration. UK dividend payers cluster in energy, financials, consumer staples, and utilities. When these sectors underperform collectively (2017-2019), the portfolio has no diversification buffer.
Survivorship bias. Exchange membership uses current company profiles. Companies that delisted from the LSE aren't fully captured.
GBP/USD currency effect. The 25-year GBP depreciation means a USD-denominated investor would see lower absolute returns than reported here.
Takeaway
The UK dividend coverage screen delivers a consistent, defensive result. 9.38% CAGR, 8.16% annual alpha over the FTSE 100 price return index (1.53% vs the S&P 500 Total Return), 80% win rate, and a max drawdown of just -23.46%. The 2008 performance (-3.8% vs -22.0%) is among the strongest crisis protection we recorded.
The consistency comes from the LSE's universe composition. UK dividend culture runs deep. Large-cap UK companies maintain dividend programs through thick and thin, and the ones that can actually afford their dividends (as measured by FCF coverage) form a reliable, defensive portfolio, though a thin one (12 names on average).
The cost: concentrated underperformance during growth-driven years like 2017. The UK market has a value/income tilt that hurts when growth leads. But the 80% hit rate and strong drawdown protection make this the strategy variant for investors who prioritize consistency over raw CAGR.
Part of a Series
This analysis is part of our dividend coverage global exchange comparison. We tested the same screen on multiple exchanges worldwide: - Dividend Coverage on US Stocks (NYSE + NASDAQ + AMEX) - 11.56% CAGR, the baseline - Dividend Coverage on German Stocks (XETRA) - 12.83% CAGR, best Sharpe ratio - Dividend Coverage: Global Comparison - full comparison table
References
- Benartzi, S., Michaely, R. & Thaler, R. (1997). "Do Changes in Dividends Signal the Future or the Past?" Journal of Finance, 52(3), 1007-1034.
- DeAngelo, H., DeAngelo, L. & Skinner, D. (1996). "Reversal of Fortune: Dividend Signaling and the Disappearance of Sustained Earnings Growth." Journal of Financial Economics, 40(3), 341-371.
Run This Screen Yourself
Via web UI: Run the coverage screen on Ceta Research. The query is pre-loaded with exchange = 'LSE'. Hit "Run" and see what passes today.
Via Python:
import requests, time

API_KEY = "your_api_key"  # get one at cetaresearch.com
BASE = "https://tradingstudio.finance/api/v1"

resp = requests.post(f"{BASE}/data-explorer/execute", headers={
    "X-API-Key": API_KEY, "Content-Type": "application/json"
}, json={
    "query": """
        WITH latest_cf AS (
            SELECT c.symbol, c.freeCashFlow, c.commonDividendsPaid, c.date,
                ROW_NUMBER() OVER (PARTITION BY c.symbol ORDER BY c.date DESC) AS rn
            FROM cash_flow_statement c
            JOIN profile p ON c.symbol = p.symbol
            WHERE c.period = 'FY' AND c.commonDividendsPaid < 0
              AND c.freeCashFlow > 0 AND p.exchange = 'LSE'
        ),
        latest_ratios AS (
            SELECT symbol, dividendYield,
                ROW_NUMBER() OVER (PARTITION BY symbol ORDER BY date DESC) AS rn
            FROM financial_ratios WHERE period = 'FY' AND dividendYield IS NOT NULL
        ),
        latest_metrics AS (
            SELECT symbol, marketCap,
                ROW_NUMBER() OVER (PARTITION BY symbol ORDER BY date DESC) AS rn
            FROM key_metrics WHERE period = 'FY' AND marketCap IS NOT NULL
        )
        SELECT cf.symbol,
            ROUND(cf.freeCashFlow / NULLIF(ABS(cf.commonDividendsPaid), 0), 2) AS coverage,
            ROUND(r.dividendYield * 100, 2) AS yield_pct,
            ROUND(km.marketCap / 1e9, 1) AS mktcap_bn
        FROM latest_cf cf
        JOIN latest_ratios r ON cf.symbol = r.symbol AND r.rn = 1
        JOIN latest_metrics km ON cf.symbol = km.symbol AND km.rn = 1
        WHERE cf.rn = 1
          AND cf.freeCashFlow / NULLIF(ABS(cf.commonDividendsPaid), 0) BETWEEN 1.5 AND 20
          AND r.dividendYield > 0.02 AND km.marketCap > 500e6
        ORDER BY coverage DESC LIMIT 30
    """,
    "options": {"format": "json", "limit": 100}
})
task_id = resp.json()["taskId"]

while True:
    result = requests.get(f"{BASE}/tasks/data-query/{task_id}",
                          headers={"X-API-Key": API_KEY}).json()
    if result["status"] in ("completed", "failed"):
        break
    time.sleep(2)

for r in result["result"]["rows"][:10]:
    print(f"{r['symbol']:8s} coverage={r['coverage']:.1f}x yield={r['yield_pct']:.1f}%")
Get your API key at cetaresearch.com. The full backtest code (Python + DuckDB) is on GitHub.
Data: Ceta Research, FMP financial data warehouse. Universe: LSE (UK). Annual rebalance (July), equal weight top 30, 2000-2025.
Past performance does not guarantee future results. This is educational content, not investment advice.

