
One Dividend Screen, 12 Exchanges: Where Cash-Backed Dividends Beat the Market
We ran the same FCF-based dividend coverage screen across 12 global exchanges. Six beat the S&P 500. India produced 17.24% CAGR. The screen works best where dividend culture runs deep.

We ran one dividend coverage screen across 12 global exchanges from 2000 to 2025. Same signal, same filters, same portfolio rules. Six exchanges beat the S&P 500. India produced 17.24% CAGR with +9.39% excess return. The screen works best in markets with strong dividend culture and deep universes. It struggles where dividend payments are thin, inconsistent, or disconnected from cash flow discipline.
Contents
- Method
- The Screen (SQL)
- Full Results: 12 Exchanges
- The Winners
- India (17.24% CAGR, +9.39% excess)
- Germany (12.83% CAGR, +4.98% excess)
- UK (9.38% CAGR, +1.53% excess)
- US (11.56% CAGR, +3.71% excess)
- Canada (10.84% CAGR, +2.99% excess)
- Sweden (10.74% CAGR, +2.89% excess)
- Borderline: Japan
- Japan (7.88% CAGR, +0.03% excess)
- Underperformers
- Hong Kong (7.28% CAGR, -0.57% excess)
- Taiwan (6.67% CAGR, -1.18% excess)
- China (5.32% CAGR, -2.53% excess)
- Korea (4.73% CAGR, -3.12% excess)
- Switzerland (4.57% CAGR, -3.28% excess)
- Excluded Exchanges
- Key Insights
- Dividend culture predicts screen performance
- Market depth matters
- Volatility is not proportional to returns
- Crisis protection varies by market
- Six out of twelve is a strong hit rate
- Currency Warning
- Takeaway
- Part of a Series
- References
- Run This Screen Yourself

Data: FMP financial data warehouse, 2000–2025. Updated March 2026.
Method
The same screen ran on every exchange: free cash flow divided by the absolute value of dividends paid, between 1.5x and 20x. Dividend yield above 2%. Exchange-specific market cap thresholds (~$200M-1B USD equivalent depending on market). Top 30 stocks by coverage descending, equal-weighted, rebalanced annually each July. The 45-day data lag after fiscal year-end prevents lookahead bias from late filers.
| Parameter | Value |
|---|---|
| Signal | FCF / ABS(Dividends Paid) between 1.5x and 20x |
| Filters | Dividend Yield > 2%, Market Cap > exchange threshold |
| Selection | Top 30 by coverage descending, equal weight |
| Rebalancing | Annual (July), 45-day data lag |
| Benchmark | S&P 500 Total Return (SPY, USD) |
| Period | 2000-2025 |
| Code | github.com/ceta-research/backtests |
Returns are in local currency for each exchange. SPY is the cross-exchange benchmark in USD. Currency effects are not modeled, which matters more for some markets than others.
Excluded from the study: France (PAR) due to a dividendYield data gap in FMP's coverage, South Africa (JNB) because 68% of periods went to cash, and Australia (ASX) because FMP's adjusted-close data for Australian stocks has systematic split-adjustment errors that make the backtest unreliable.
Full methodology: METHODOLOGY.md
The Screen (SQL)
WITH latest_cf AS (
    SELECT c.symbol, c.freeCashFlow, c.commonDividendsPaid, c.date,
        ROW_NUMBER() OVER (PARTITION BY c.symbol ORDER BY c.date DESC) AS rn
    FROM cash_flow_statement c
    JOIN profile p ON c.symbol = p.symbol
    WHERE c.period = 'FY'
      AND c.commonDividendsPaid < 0
      AND c.freeCashFlow > 0
      AND p.exchange IN ('NYSE', 'NASDAQ', 'AMEX')
),
latest_ratios AS (
    SELECT symbol, dividendYield, date,
        ROW_NUMBER() OVER (PARTITION BY symbol ORDER BY date DESC) AS rn
    FROM financial_ratios
    WHERE period = 'FY' AND dividendYield IS NOT NULL
),
latest_metrics AS (
    SELECT symbol, marketCap, date,
        ROW_NUMBER() OVER (PARTITION BY symbol ORDER BY date DESC) AS rn
    FROM key_metrics
    WHERE period = 'FY' AND marketCap IS NOT NULL
)
SELECT
    cf.symbol,
    ROUND(cf.freeCashFlow / NULLIF(ABS(cf.commonDividendsPaid), 0), 2) AS coverage,
    ROUND(r.dividendYield * 100, 2) AS yield_pct,
    ROUND(cf.freeCashFlow / 1e9, 2) AS fcf_bn,
    ROUND(km.marketCap / 1e9, 1) AS mktcap_bn
FROM latest_cf cf
JOIN latest_ratios r ON cf.symbol = r.symbol AND r.rn = 1
JOIN latest_metrics km ON cf.symbol = km.symbol AND km.rn = 1
WHERE cf.rn = 1
  AND cf.freeCashFlow / NULLIF(ABS(cf.commonDividendsPaid), 0) BETWEEN 1.5 AND 20
  AND r.dividendYield > 0.02
  AND km.marketCap > 1e9
ORDER BY coverage DESC
LIMIT 30
Change p.exchange IN (...) to target any exchange. The backtest code on GitHub handles this automatically per exchange preset.
Run this query on Ceta Research
Full Results: 12 Exchanges
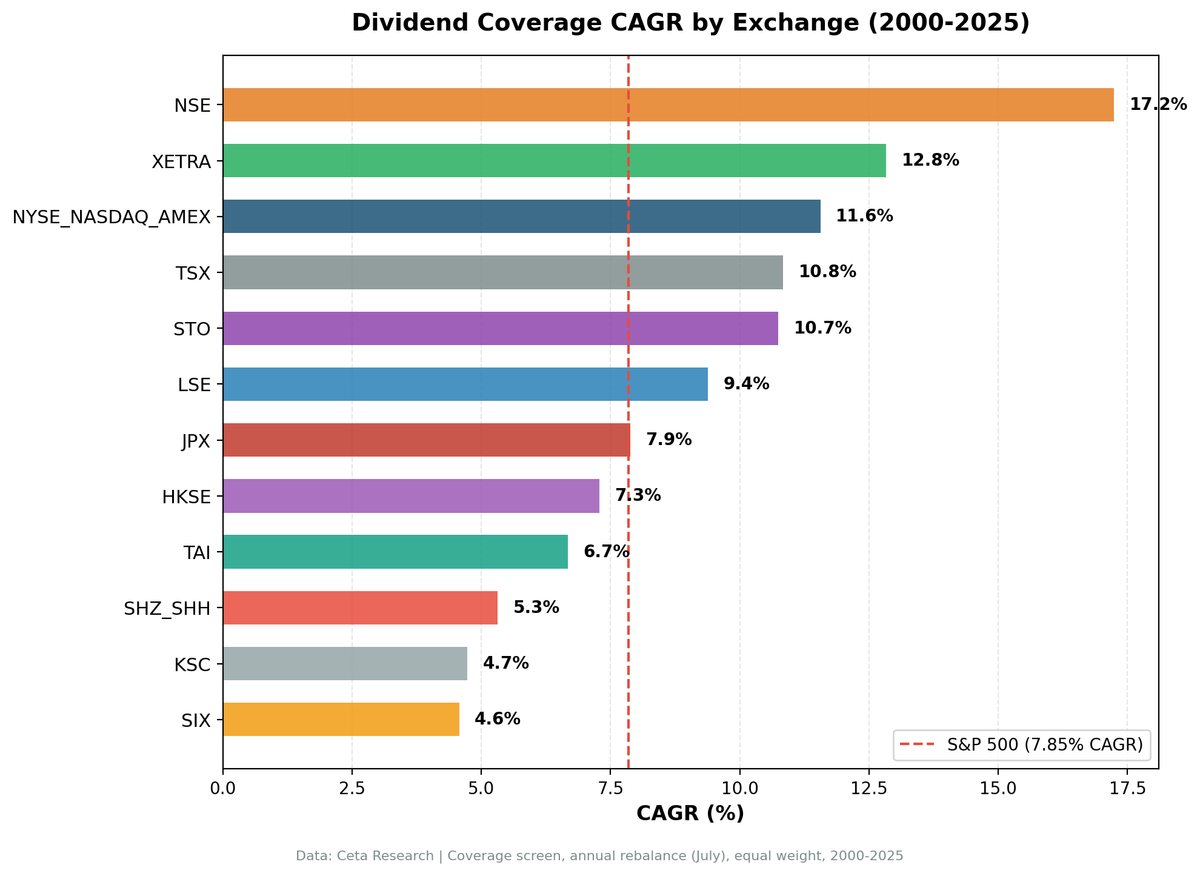
Sorted by CAGR, descending. Every exchange where the screen found enough qualifying stocks to deploy capital.
| Exchange | CAGR | Excess | Sharpe | MaxDD | Cash Periods | Avg Stocks | Vol | Win Rate |
|---|---|---|---|---|---|---|---|---|
| India (NSE) | 17.24% | +9.39% | 0.405 | -17.72% | 4/25 | 20.3 | 26.52% | 52%* |
| Germany (XETRA) | 12.83% | +4.98% | 0.519 | -47.63% | 0/25 | 21.1 | 20.85% | 80%* |
| US (NYSE+NAS+AMEX) | 11.56% | +3.71% | 0.427 | -43.32% | 0/25 | 23.6 | 22.38% | 64% |
| Canada (TSX) | 10.84% | +2.99% | 0.505 | -25.66% | 0/25 | 22.1 | 16.51% | 68%* |
| Sweden (STO) | 10.74% | +2.89% | 0.485 | -37.68% | 3/25 | 22.7 | 18.02% | 84%* |
| UK (LSE) | 9.38% | +1.53% | 0.336 | -23.46% | 0/25 | 12.2 | 17.50% | 80%* |
| Japan (JPX) | 7.88% | +0.03% | 0.350 | -43.59% | 2/25 | 24.8 | 22.25% | 56%* |
| Hong Kong (HKSE) | 7.28% | -0.57% | 0.221 | -29.91% | 0/25 | 21.6 | 19.38% | 68%* |
| Taiwan (TAI) | 6.67% | -1.18% | 0.404 | -14.82% | 6/25 | 28.2 | 14.05% | 56%* |
| China (SHZ+SHH) | 5.32% | -2.53% | 0.087 | -47.54% | 0/25 | 25.4 | 32.57% | 60%* |
| Korea (KSC) | 4.73% | -3.12% | 0.105 | -25.89% | 9/25 | 22.2 | 16.51% | 52%* |
| Switzerland (SIX) | 4.57% | -3.28% | 0.203 | -46.87% | 2/25 | 13.8 | 20.09% | 64%* |
SPY benchmark: 7.85% CAGR, -38.01% MaxDD.
*Win rates marked with asterisk are vs local benchmark (not SPY). For cross-market SPY comparison, ignore these.
The Winners
Six exchanges beat SPY's 7.85% CAGR. That's a 50% hit rate across global markets. For a single-factor dividend screen, that's unusually broad.
India (17.24% CAGR, +9.39% excess)
The standout by a wide margin. India produced the highest raw return, the highest excess return, and the lowest drawdown (-17.72%) in the entire study. Four cash periods early on (2000-2003) during the dot-com era dragged the number down. When the portfolio was invested, it compounded aggressively.
India's dividend culture is part of the explanation. Indian companies that pay dividends tend to do so deliberately, with high coverage ratios and family-founder oversight of capital allocation. The screen captured IT exporters, FMCG companies, and private-sector financials that generate strong free cash flow in rupees while serving stable domestic demand. That combination produced a portfolio with low correlation to SPY's worst years.
20.3 stocks on average, 52% win rate against local Sensex benchmark, and a max drawdown better than every other exchange in the study. 5,231% total return over the period. India was the best market for this screen by every metric. Note: vs local Sensex benchmark, the alpha is +5.18%. The larger excess vs SPY reflects both stock selection and India's stronger market performance over the period.
Germany (12.83% CAGR, +4.98% excess)
Germany produced the best Sharpe ratio among all exchanges at 0.519 and ran zero cash periods across all 25 years. The screen always found enough qualifying dividend payers. Germany's Mittelstand tradition helps here. Many mid-cap German industrials treat dividends as a fixed commitment funded from real operating cash flow. Coverage ratios tend to be genuine. When a German company reports 4x coverage, it usually means what it says.
The drawdown of -47.63% is the one blemish. The 2008 crisis hit German exporters hard, and dividend coverage didn't prevent that. But the recovery was fast enough that the 25-year number still cleared SPY by 4.98% annually. Note: vs local DAX price return, the excess is +7.79%. DAX price return excludes dividends, making the comparison less direct.
UK (9.38% CAGR, +1.53% excess)
The UK delivered the best drawdown protection of any developed market, just -23.46% across the full 25-year period, and an 80% win rate against the local FTSE 100 benchmark. That consistency matters, even though the raw CAGR sits in the middle of the pack.
The UK's dividend culture runs deep. British companies historically distribute a higher share of earnings than their US or continental European peers. That creates a pool of candidates for a coverage screen, and the quality of those dividends tends to be real. The screen stayed fully invested all 25 years.
At 12.2 stocks on average, the UK runs the thinnest universe of any market we tested, which creates real concentration risk. But the win rate and drawdown protection make the UK one of the most defensive implementations of this screen. Note: vs FTSE 100 price return, the excess is +8.16%, but FTSE 100 excludes dividends, making that comparison less direct.
US (11.56% CAGR, +3.71% excess)
The most consistent implementation. Zero cash periods, 23.6 qualifying stocks every year, 64% win rate against SPY. The US market is deep enough that a dividend coverage screen always finds 30 candidates with real cash flows backing their payouts.
The alpha came in waves. The strategy crushed the benchmark during the dot-com crash (2000-2001), outperformed during 2003-2006, and posted +67% in 2020 when beaten-down dividend payers snapped back. It struggled during growth rallies (2017 and 2019 were painful). Coverage stocks are boring by design. Utilities, consumer staples, industrials. They don't keep up when mega-cap tech drives the index.
The -43.32% max drawdown is the trade-off. Concentrated dividend portfolios swing hard during credit crises. The extra return came with extra volatility (22.38% vs SPY's ~16%).
Canada (10.84% CAGR, +2.99% excess)
Canada was the lowest-volatility winner at 16.51%. Zero cash periods. A 0.505 Sharpe that ranks second in the study. Canadian dividend payers, particularly pipelines, utilities, and REITs, tend to have high and stable coverage ratios. The TSX rewards income investors. The market structure aligns well with this screen.
Max drawdown of -25.66% was far better than SPY's -38.01%. The crisis protection comes naturally: Canadian dividend payers with high coverage tend to be regulated or commodity-linked businesses whose cash flows are more stable than their stock prices suggest. Note: vs TSX Composite price return, the excess is +6.89%.
Sweden (10.74% CAGR, +2.89% excess)
Sweden produced one of the highest Sharpe ratios in the entire study at 0.485, behind Germany and Canada. It also had a low 18.02% volatility. Nordic dividend culture rewards steady, predictable payouts. Swedish companies that pass the coverage screen tend to be mature industrials, real estate operators, and consumer businesses with disciplined capital allocation.
Three cash periods over 25 years. An 84% win rate against the local OMX Stockholm 30 benchmark, the highest win rate of any exchange we tested. Max drawdown of -37.68%. The combination of above-SPY returns and below-SPY volatility is rare in any backtest. Sweden delivered it. Note: vs OMX Stockholm 30 price return, the excess is +8.19%.
Borderline: Japan
Japan (7.88% CAGR, +0.03% excess)
Japan essentially matched SPY over the 25-year period. The +0.03% difference is statistically indistinguishable from zero. In apples-to-apples comparison against S&P 500 total return, Japan delivered the same result.
Against the local Nikkei 225 price return benchmark, the screen beat by +4.57%. But that's comparing total return strategy to a price-only index, which isn't apples-to-apples. The honest assessment: the dividend coverage screen in Japan delivered market-like returns relative to global equity benchmarks.
Japan's result reflects its dividend culture. Japanese companies have historically been reluctant dividend payers, preferring to hoard cash. The ones that do pay well-covered dividends tend to be mature and slow-growing. The coverage screen selected them reliably (24.8 average stocks, 2 cash periods), but the underlying businesses didn't generate enough return to separate from SPY.
The -43.59% max drawdown is severe, but it held up notably better than the Nikkei's own -50.38%, so the screen did cushion Japan's declines. The 0.350 Sharpe is the lowest among exchanges that matched or beat SPY.
Underperformers
Five exchanges trailed SPY's 7.85% CAGR. The reasons vary, but a pattern emerges: weak dividend culture, thin universes, or macro headwinds that overwhelm stock selection.
Hong Kong (7.28% CAGR, -0.57% excess)
The closest miss. Zero cash periods and a 0.221 Sharpe that barely clears zero. The HKD peg to USD makes this comparison clean on currency. The screen found plenty of stocks (21.6 average) but they didn't quite keep pace. Hong Kong's market has been in structural decline since 2018, weighed down by mainland regulatory risk, property sector stress, and capital outflows. Dividend coverage softened but didn't reverse these macro forces.
The -29.91% max drawdown and 68% win rate against local benchmark paint a picture of a portfolio that tracked broad market weakness despite selecting fundamentally sound dividend payers.
Taiwan (6.67% CAGR, -1.18% excess)
Taiwan is the most interesting underperformer. It has the lowest max drawdown in the entire study at -14.82% and the lowest volatility at 14.05%. Six cash periods suggest the screen went conservative during uncertain stretches, which protected capital but cost returns. The 28.2 average stocks (highest in the study) means plenty of candidates existed when the screen was active.
Taiwan's tech-heavy market means many dividend payers are semiconductor supply chain companies. Their coverage ratios are genuine, but the underlying businesses are cyclical. The screen protected downside exceptionally well. It just didn't generate enough upside to clear SPY. For a capital preservation mandate, Taiwan's result is actually compelling. A 0.404 Sharpe with a -14.82% max drawdown is a different kind of attractive.
China (5.32% CAGR, -2.53% excess)
The highest volatility in the study at 32.57% and a -47.54% max drawdown. A 0.087 Sharpe that is effectively zero. Zero cash periods and 25.4 average stocks mean plenty of Chinese companies pass the coverage filters. They just don't deliver returns.
Chinese dividend behavior is different from Western markets. Many state-owned enterprises pay dividends as a policy requirement, not because cash flows support it. Coverage ratios can look healthy on paper while the underlying cash flow quality is questionable. The screen selects companies that report high coverage, but the informational content of that coverage ratio is lower in China than in markets with stronger accounting standards.
A 60% win rate against local benchmark over 25 years, but the benchmark itself has underperformed global markets significantly. Against SPY, the signal has no edge here.
Korea (4.73% CAGR, -3.12% excess)
Among the worst-performing exchanges in the study. Nine cash periods out of 25 is the highest of any exchange, meaning the screen frequently couldn't find enough qualifying stocks. Korean chaebols historically paid low dividends despite generating substantial cash flow. The corporate governance structure favored reinvestment over distribution. That's been changing in recent years, but the 25-year track record reflects the old regime.
A 0.105 Sharpe and 52% win rate against local benchmark. When the screen found stocks, the results were mediocre. Korea's dividend culture is too thin for this screen to work consistently.
Switzerland (4.57% CAGR, -3.28% excess)
The thinnest universe alongside the UK at 13.8 average stocks. Two cash periods. Switzerland's market is dominated by a handful of mega-caps (Nestle, Novartis, Roche) that typically have moderate dividend yields and sky-high coverage. The screen captures the second tier of Swiss companies, which tend to be smaller and more cyclical.
The -46.87% max drawdown is among the worst in the study. A 0.203 Sharpe and 64% win rate against local benchmark. Switzerland has excellent data quality and a genuine dividend-paying culture, but the market is too concentrated and too small to give this screen room to work.
Excluded Exchanges
Three exchanges were excluded from the main results.
Australia (ASX): FMP's adjusted-close data for Australian stocks has systematic split-adjustment errors. Hundreds of ASX symbols show adjClose price ratios that swing by more than 1,000x, which corrupts any return calculation. This is a data-quality problem severe enough that we pulled the ASX from the study entirely. The screen is untestable here on current data, not proven bad.
France (PAR): FMP's dividendYield data for Paris-listed stocks has a systematic gap. The coverage screen requires dividendYield > 2% as a filter, and without reliable yield data, the screen produces unreliable results. This is a data problem, not a strategy problem. The screen is untestable here, not proven bad.
South Africa (JNB): 68% of periods went to cash. The screen couldn't find 10 qualifying stocks in most years. South Africa's exchange has enough dividend payers, but the combination of coverage, yield, and market cap filters produced too few candidates. The thin universe makes the backtest results statistically unreliable.
Key Insights
Dividend culture predicts screen performance
The strongest results came from markets with deep, established dividend-paying traditions: India, the UK, Germany, the US, Sweden, Canada. These are markets where companies view dividends as a commitment, where coverage ratios carry real information, and where a large pool of genuine payers gives the screen room to select.
The weakest results came from markets where dividends are an afterthought (Korea), a policy requirement disconnected from fundamentals (China), or structurally declining (Hong Kong). The signal is the same everywhere. The information content of that signal varies enormously.
Market depth matters
Zero cash periods in the US, Germany, Canada, Hong Kong, and China. Those markets always had 20+ qualifying stocks. Korea had 9 cash periods. Taiwan had 6. The screen needs a deep enough universe to function. When it goes to cash repeatedly, the opportunity cost accumulates.
The US, Germany, and Canada combined zero cash periods with above-SPY returns. That's the ideal: enough candidates every year and genuine alpha when invested.
Volatility is not proportional to returns
India produced the highest returns (17.24%) with moderate volatility (26.52%). China produced mediocre returns (5.32%) with the highest volatility (32.57%). Low volatility didn't guarantee low returns either. Canada's 16.51% vol came with 10.84% CAGR. Taiwan's 14.05% vol came with 6.67%.
The Sharpe ratio captures this: Germany (0.519), Canada (0.505), Sweden (0.485) all delivered better risk-adjusted returns than the raw CAGR ranking would suggest.
Crisis protection varies by market
India's -17.72% max drawdown and Taiwan's -14.82% show that dividend coverage can provide real downside protection in certain markets. The UK's -23.46% and Canada's -25.66% also delivered meaningful crisis protection. But Switzerland's -46.87%, Germany's -47.63%, and China's -47.54% show it doesn't work everywhere. The difference isn't the screen. It's whether the companies that pass the screen in a given market are genuinely insulated from the events that drive drawdowns.
Six out of twelve is a strong hit rate
Most single-factor screens beat SPY in 2-4 markets out of a global test. Dividend coverage beat SPY in 6 of 12. The signal has broad applicability. The strongest implementation is India. The best risk-adjusted are Germany and Canada. The most consistent are the US and Canada.
Currency Warning
Returns are in local currency for each exchange. SPY is in USD. Direct comparison overstates alpha for depreciating currencies and understates it for appreciating ones.
The biggest adjustments needed:
- India (INR): The rupee lost roughly 60% vs USD over this period. Subtract approximately 2.5-3% per year for a rough USD estimate. The 17.24% CAGR becomes approximately 14.5% in USD terms, with excess vs SPY narrowing from +9.39% to roughly +6.6%. Even adjusted, India still beats SPY by a meaningful margin.
- Japan (JPY): The yen depreciated significantly, especially after 2012. The marginal +0.03% excess likely turns negative after currency adjustment.
- UK (GBP): Sterling lost ground vs USD over the full period. The 9.38% CAGR is somewhat overstated in USD terms, and the UK's slim +1.53% edge over SPY may not survive adjustment.
- Sweden (SEK): The krona depreciated modestly. Sweden's alpha narrows but likely survives.
- Hong Kong (HKD): Pegged to USD. No adjustment needed. The 7.28% CAGR vs SPY comparison is apples-to-apples.
- Switzerland (CHF): The franc appreciated significantly vs USD. Switzerland's -3.28% excess would improve after currency adjustment, but the gap is too wide to clear SPY.
- China (RMB): Roughly stable vs USD over the full period. Small adjustment.
- Germany (EUR): EUR/USD swung both ways. Net effect over 25 years is modest.
- Canada (CAD): Roughly flat vs USD over the full period. The 10.84% stands approximately as-is.
- Korea (KRW): The won depreciated roughly 30% vs USD. The already-poor 4.73% CAGR gets worse.
- Taiwan (TWD): Modest depreciation. Adjustment is small.
Takeaway
The dividend coverage screen works across more global markets than most single-factor strategies. Six of twelve exchanges beat SPY over 25 years. The common thread among winners is a real dividend-paying culture: markets where companies treat dividends as a commitment, not a formality.
India is the standout. 17.24% CAGR, lowest drawdown in the study, and a portfolio of companies that genuinely generate cash to back their payouts. Germany and Canada offer the best risk-adjusted returns in developed markets. The US is the most consistent. Sweden delivers the highest win rate.
The screen fails where dividend culture is weak. Korea and China don't have the depth of genuine, well-covered dividend payers for this signal to work. Hong Kong's structural decline overwhelmed the stock selection. Japan matched SPY but didn't beat it.
The practical takeaway: if you're going to use a dividend coverage screen, use it in markets where dividends mean something. The math is the same everywhere. The culture behind the numbers is not.
Part of a Series
This is the global comparison post. Individual exchange analyses with year-by-year breakdowns, annual return tables, and charts:
- Dividend Coverage on US Stocks (NYSE + NASDAQ + AMEX) - 11.56% CAGR, the consistent baseline
- Dividend Coverage on Indian Stocks (NSE) - 17.24% CAGR, the standout
- Dividend Coverage on German Stocks (XETRA) - 12.83% CAGR, best European result
- Dividend Coverage on Canadian Stocks (TSX) - 10.84% CAGR, lowest volatility
- Dividend Coverage on Swedish Stocks (STO) - 10.74% CAGR, highest win rate
- Dividend Coverage on UK Stocks (LSE) - 9.38% CAGR, best drawdown protection
- Dividend Coverage on Japanese Stocks (JPX) - 7.88% CAGR, matched SPY
References
- Benartzi, S., Michaely, R. & Thaler, R. (1997). "Do Changes in Dividends Signal the Future or the Past?" Journal of Finance, 52(3), 1007-1034.
- DeAngelo, H., DeAngelo, L. & Skinner, D. (1996). "Reversal of Fortune: Dividend Signaling and the Disappearance of Sustained Earnings Growth." Journal of Financial Economics, 40(3), 341-371.
Run This Screen Yourself
All metrics used in this analysis (free cash flow, dividends paid, dividend yield, market cap) are queryable via SQL on Ceta Research. Filter by exchange and see what passes the coverage screen today.
The full backtest code (Python + DuckDB) is open source. Every exchange, every rebalance year, every cost assumption is documented.
github.com/ceta-research/backtests
Data: Ceta Research, FMP financial data warehouse. 12 exchanges, 2000-2025, annual July rebalance, equal weight (top 30 by FCF coverage descending), exchange-specific market cap thresholds. Returns in local currency. Benchmark: S&P 500 Total Return (SPY, USD). Excluded: France (dividendYield data gap), South Africa (68% cash periods), Australia (adjClose data quality). Past performance does not guarantee future results. This is research, not investment advice.


