
Dividend Sustainability on UK Stocks: 9.38% CAGR, Largest Local-Benchmark Excess
The dividend sustainability screen on LSE stocks returned 9.38% CAGR with 8.16% annual excess over the FTSE 100, the largest local-benchmark excess in the series. 8.07% Jensen alpha, 80% win rate, 9.2/10 average sustainability score (highest globally).

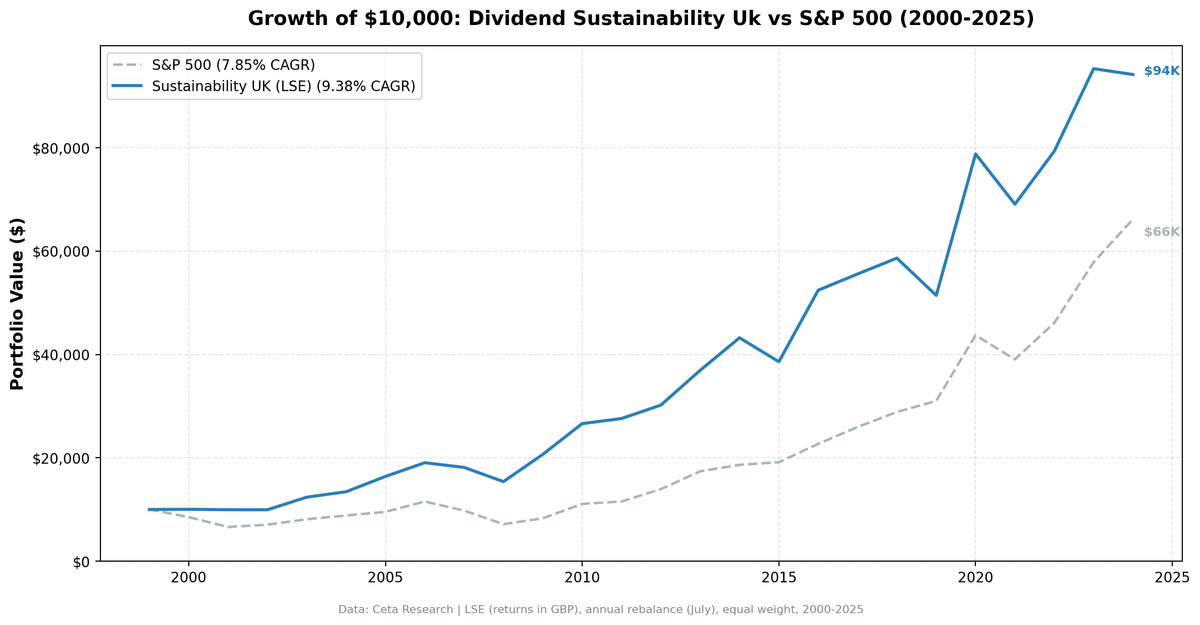
The UK sustainability screen returned 9.38% CAGR over 25 years, beating the FTSE 100 by 8.16% annually. That's the largest excess return vs a local benchmark in the entire 12-exchange series. The average sustainability score of 9.2/10 is the highest globally. LSE dividend payers that clear the 7+ threshold aren't just passing the bar. They're near-perfect across all five dimensions.
Contents
- Method
- The Screen (SQL)
- What We Found
- 25 years of data. 8.16% annual excess over FTSE 100. Largest local-benchmark excess in the series.
- Year-by-year returns
- 2000-2003: dot-com protection
- 2007-2009: the financial crisis advantage
- 2014: the energy crash divergence
- 2016 + 2020: snap-back rallies
- 2024: the one persistent miss
- Backtest Methodology
- Limitations
- Takeaway
- Part of a Series
- References
- Run This Screen Yourself
Against a FTSE 100 that returned only 1.23% CAGR over the 25-year period, this is a striking case of local-benchmark framing changing the picture entirely.
Data: FMP financial data warehouse, 2000–2025. Updated May 2026.
Method
We applied the same 5-component sustainability score used in our US dividend sustainability study. Five dimensions scored 0-2 each (payout ratio, debt/equity, FCF coverage, ROE, Piotroski F-Score), total 0-10. Minimum score 7, yield above 2%, top 30 by score, equal weight, annual July rebalance. See the US blog for full methodology and score breakdown.
Universe: LSE (London Stock Exchange), market cap > 500M GBP (~$635M USD) Period: 2000-2025 (25 years) Benchmark: FTSE 100 (GBP) Execution: Next-day close (market-on-close after signal)
The Screen (SQL)
WITH latest_ratios AS (
    SELECT r.symbol, r.dividendPayoutRatio, r.debtToEquityRatio,
           r.dividendYield, r.date,
        ROW_NUMBER() OVER (PARTITION BY r.symbol ORDER BY r.date DESC) AS rn
    FROM financial_ratios r
    JOIN profile p ON r.symbol = p.symbol
    WHERE r.period = 'FY'
      AND r.dividendPayoutRatio > 0
      AND r.dividendYield IS NOT NULL
      AND p.exchange IN ('LSE')
),
latest_cf AS (
    SELECT c.symbol, c.freeCashFlow, c.commonDividendsPaid, c.date,
        ROW_NUMBER() OVER (PARTITION BY c.symbol ORDER BY c.date DESC) AS rn
    FROM cash_flow_statement c
    JOIN profile p ON c.symbol = p.symbol
    WHERE c.period = 'FY'
      AND c.commonDividendsPaid < 0
      AND p.exchange IN ('LSE')
),
latest_metrics AS (
    SELECT k.symbol, k.returnOnEquity, k.marketCap, k.date,
        ROW_NUMBER() OVER (PARTITION BY k.symbol ORDER BY k.date DESC) AS rn
    FROM key_metrics k
    JOIN profile p ON k.symbol = p.symbol
    WHERE k.period = 'FY'
      AND k.marketCap IS NOT NULL
      AND p.exchange IN ('LSE')
),
latest_scores AS (
    SELECT symbol, piotroskiScore FROM scores
),
scored AS (
    SELECT r.symbol, r.date,
        ROUND(r.dividendPayoutRatio * 100, 1) AS payout_pct,
        ROUND(r.debtToEquityRatio, 2) AS debt_equity,
        ROUND(c.freeCashFlow / NULLIF(ABS(c.commonDividendsPaid), 0), 2) AS fcf_coverage,
        ROUND(k.returnOnEquity * 100, 1) AS roe_pct,
        s.piotroskiScore AS piotroski,
        ROUND(r.dividendYield * 100, 2) AS yield_pct,
        ROUND(k.marketCap / 1e9, 1) AS mktcap_bn,
        CASE WHEN r.dividendPayoutRatio < 0.5 THEN 2
             WHEN r.dividendPayoutRatio < 0.8 THEN 1 ELSE 0 END AS c_payout,
        CASE WHEN r.debtToEquityRatio >= 0 AND r.debtToEquityRatio < 0.5 THEN 2
             WHEN r.debtToEquityRatio >= 0 AND r.debtToEquityRatio < 1.5 THEN 1
             ELSE 0 END AS c_debt,
        CASE WHEN c.freeCashFlow > 0 AND c.commonDividendsPaid < 0
                  AND c.freeCashFlow / ABS(c.commonDividendsPaid) > 2 THEN 2
             WHEN c.freeCashFlow > 0 AND c.commonDividendsPaid < 0
                  AND c.freeCashFlow / ABS(c.commonDividendsPaid) > 1 THEN 1
             ELSE 0 END AS c_fcf,
        CASE WHEN k.returnOnEquity > 0.15 THEN 2
             WHEN k.returnOnEquity > 0.08 THEN 1 ELSE 0 END AS c_roe,
        CASE WHEN s.piotroskiScore >= 7 THEN 2
             WHEN s.piotroskiScore >= 5 THEN 1 ELSE 0 END AS c_piotroski
    FROM latest_ratios r
    JOIN latest_cf c ON r.symbol = c.symbol AND c.rn = 1
    JOIN latest_metrics k ON r.symbol = k.symbol AND k.rn = 1
    LEFT JOIN latest_scores s ON r.symbol = s.symbol
    WHERE r.rn = 1
      AND r.dividendYield > 0.02
      AND k.marketCap > 500e6
)
SELECT symbol, date, payout_pct, debt_equity, fcf_coverage, roe_pct, piotroski,
       yield_pct, mktcap_bn,
       c_payout + c_debt + c_fcf + c_roe + COALESCE(c_piotroski, 0) AS sustainability_score,
       c_payout, c_debt, c_fcf, c_roe, COALESCE(c_piotroski, 0) AS c_piotroski
FROM scored
WHERE c_payout + c_debt + c_fcf + c_roe + COALESCE(c_piotroski, 0) >= 7
ORDER BY sustainability_score DESC, yield_pct DESC
LIMIT 30
[Run this query on Ceta Research][SUSTAINABILITY_UK_QUERY_URL]
What We Found
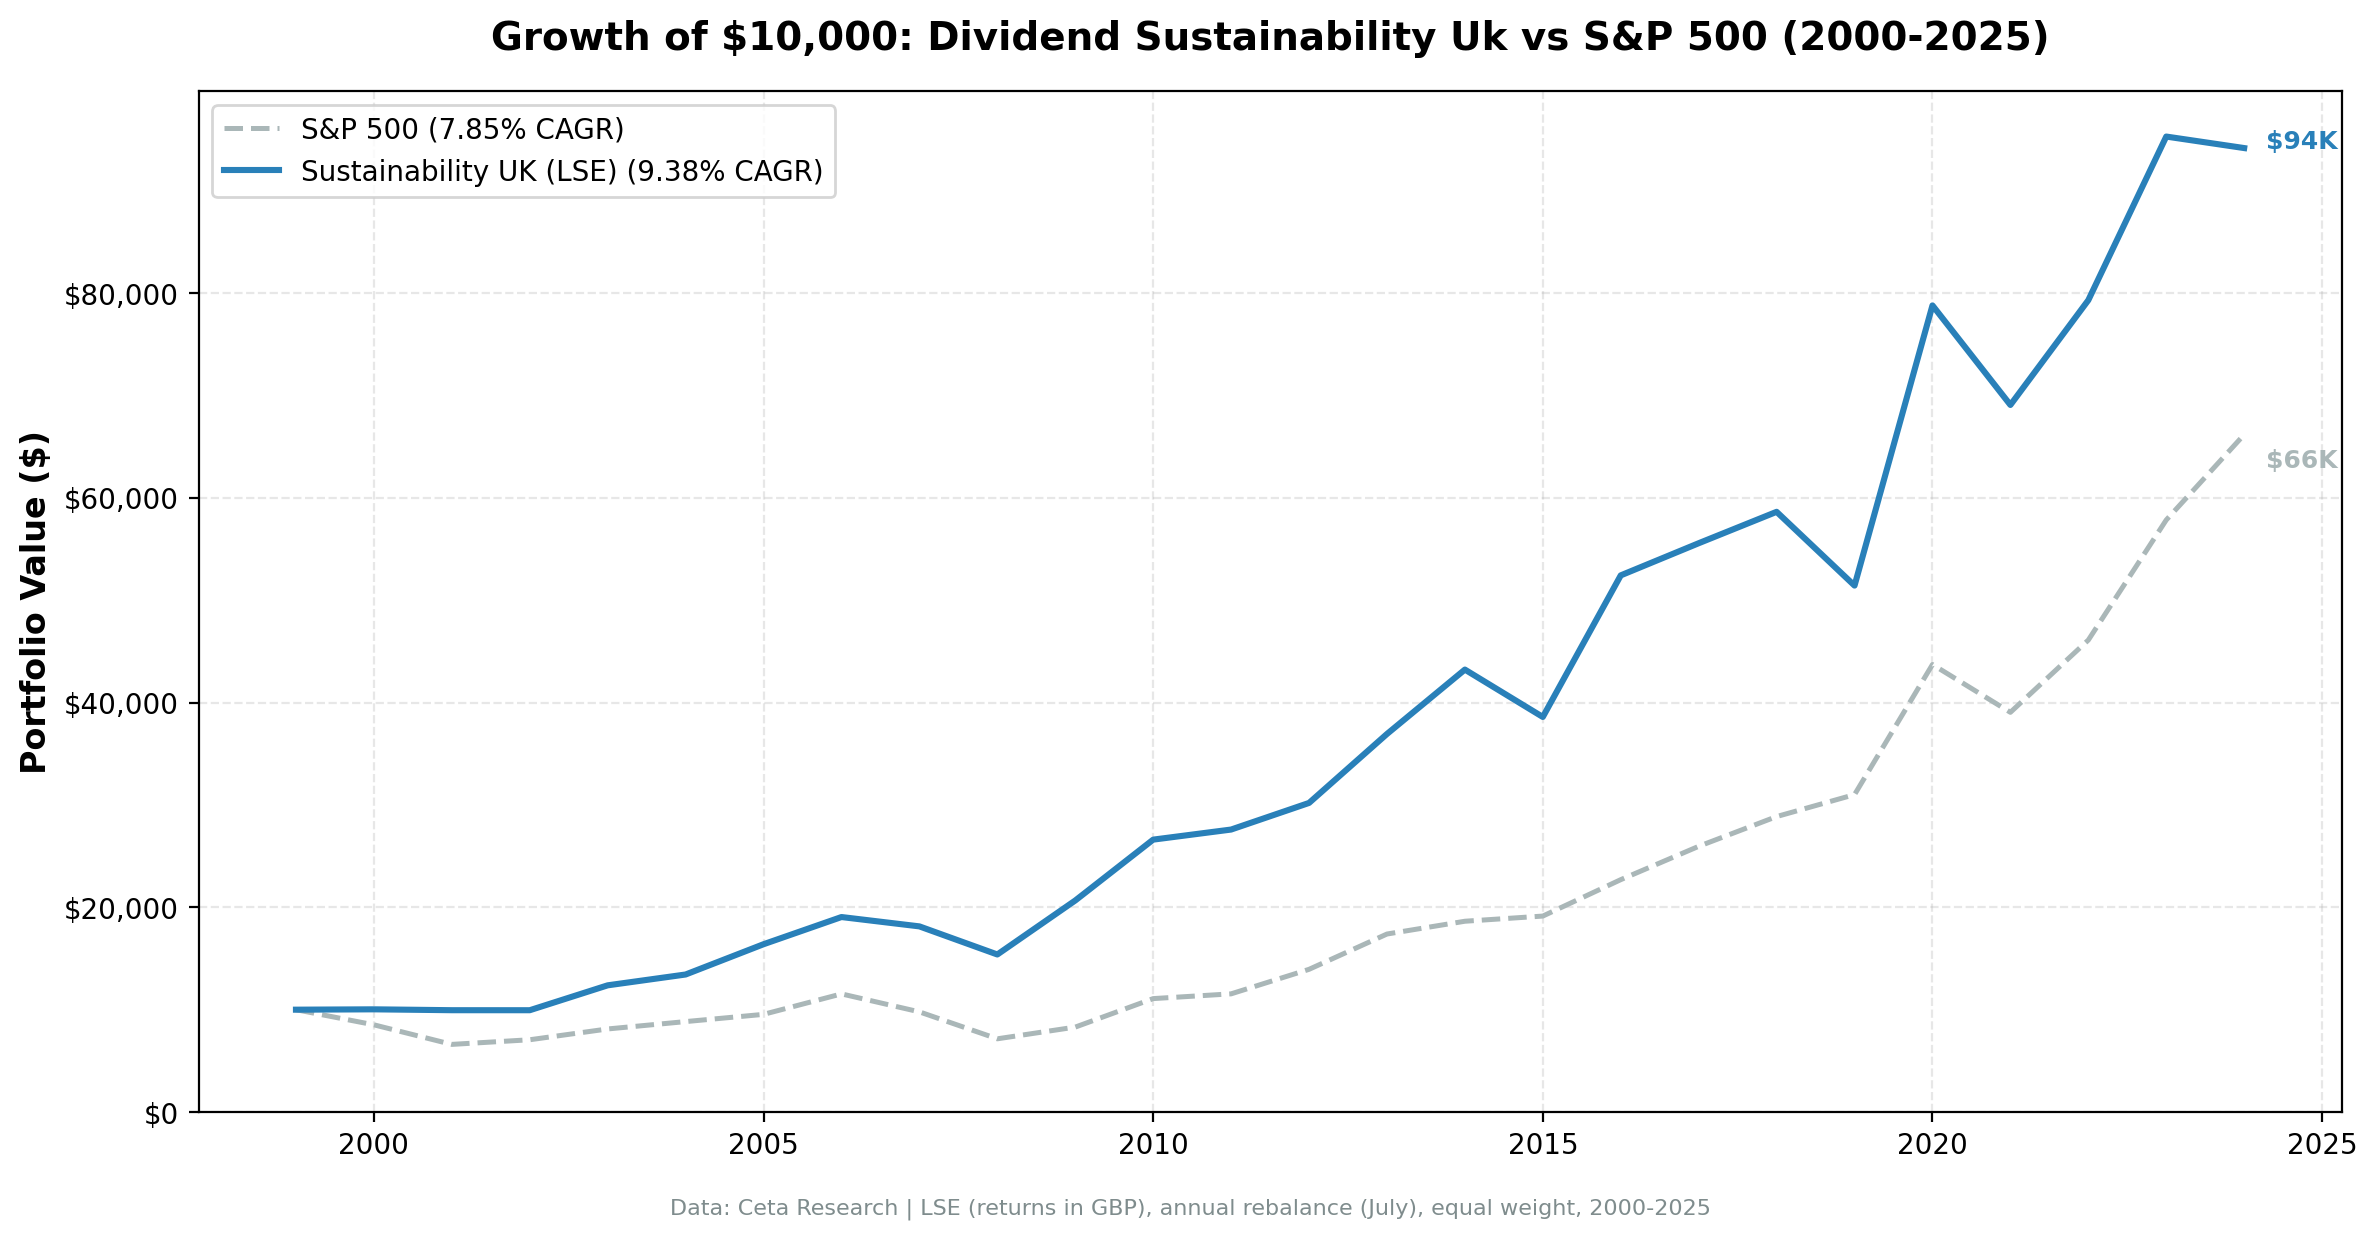
25 years of data. 8.16% annual excess over FTSE 100. Largest local-benchmark excess in the series.
| Metric | Sustainability (UK) | FTSE 100 |
|---|---|---|
| CAGR | 9.38% | 1.23% |
| Volatility | 17.05% | - |
| Max Drawdown | -19.21% | - |
| Sharpe Ratio | 0.345 | - |
| Sortino Ratio | 0.856 | - |
| Win Rate (annual) | 80% | - |
| Up Capture | 176.8% | - |
| Down Capture | 20.4% | - |
| Beta | 0.961 | - |
| Alpha | 8.07% | - |
| Avg Stocks per Period | 13.0 | - |
| Cash Periods | 0 of 25 | - |
| Avg Sustainability Score | 9.2/10 | - |
The FTSE 100 returned just 1.23% CAGR over this period, so the 8.07% Jensen alpha and 80% win rate vs the local benchmark tell the real story. The max drawdown of -19.21% is one of the shallowest in our 12-market series, second only to India (-11.36%). Down capture of 20.4% means the strategy absorbed about a fifth of the FTSE 100's downside over 25 years.
The average sustainability score of 9.2/10 is the highest globally. LSE companies that clear the 7+ bar tend to score near-perfect across all five dimensions. The UK's dividend culture, mature corporate governance, and deep pool of quality large-caps create a concentrated set of exceptionally sustainable payers. The portfolio averaged just 13 stocks per period, the thinnest universe in the series, but those 13 names were the cream of the LSE dividend pool.
Year-by-year returns
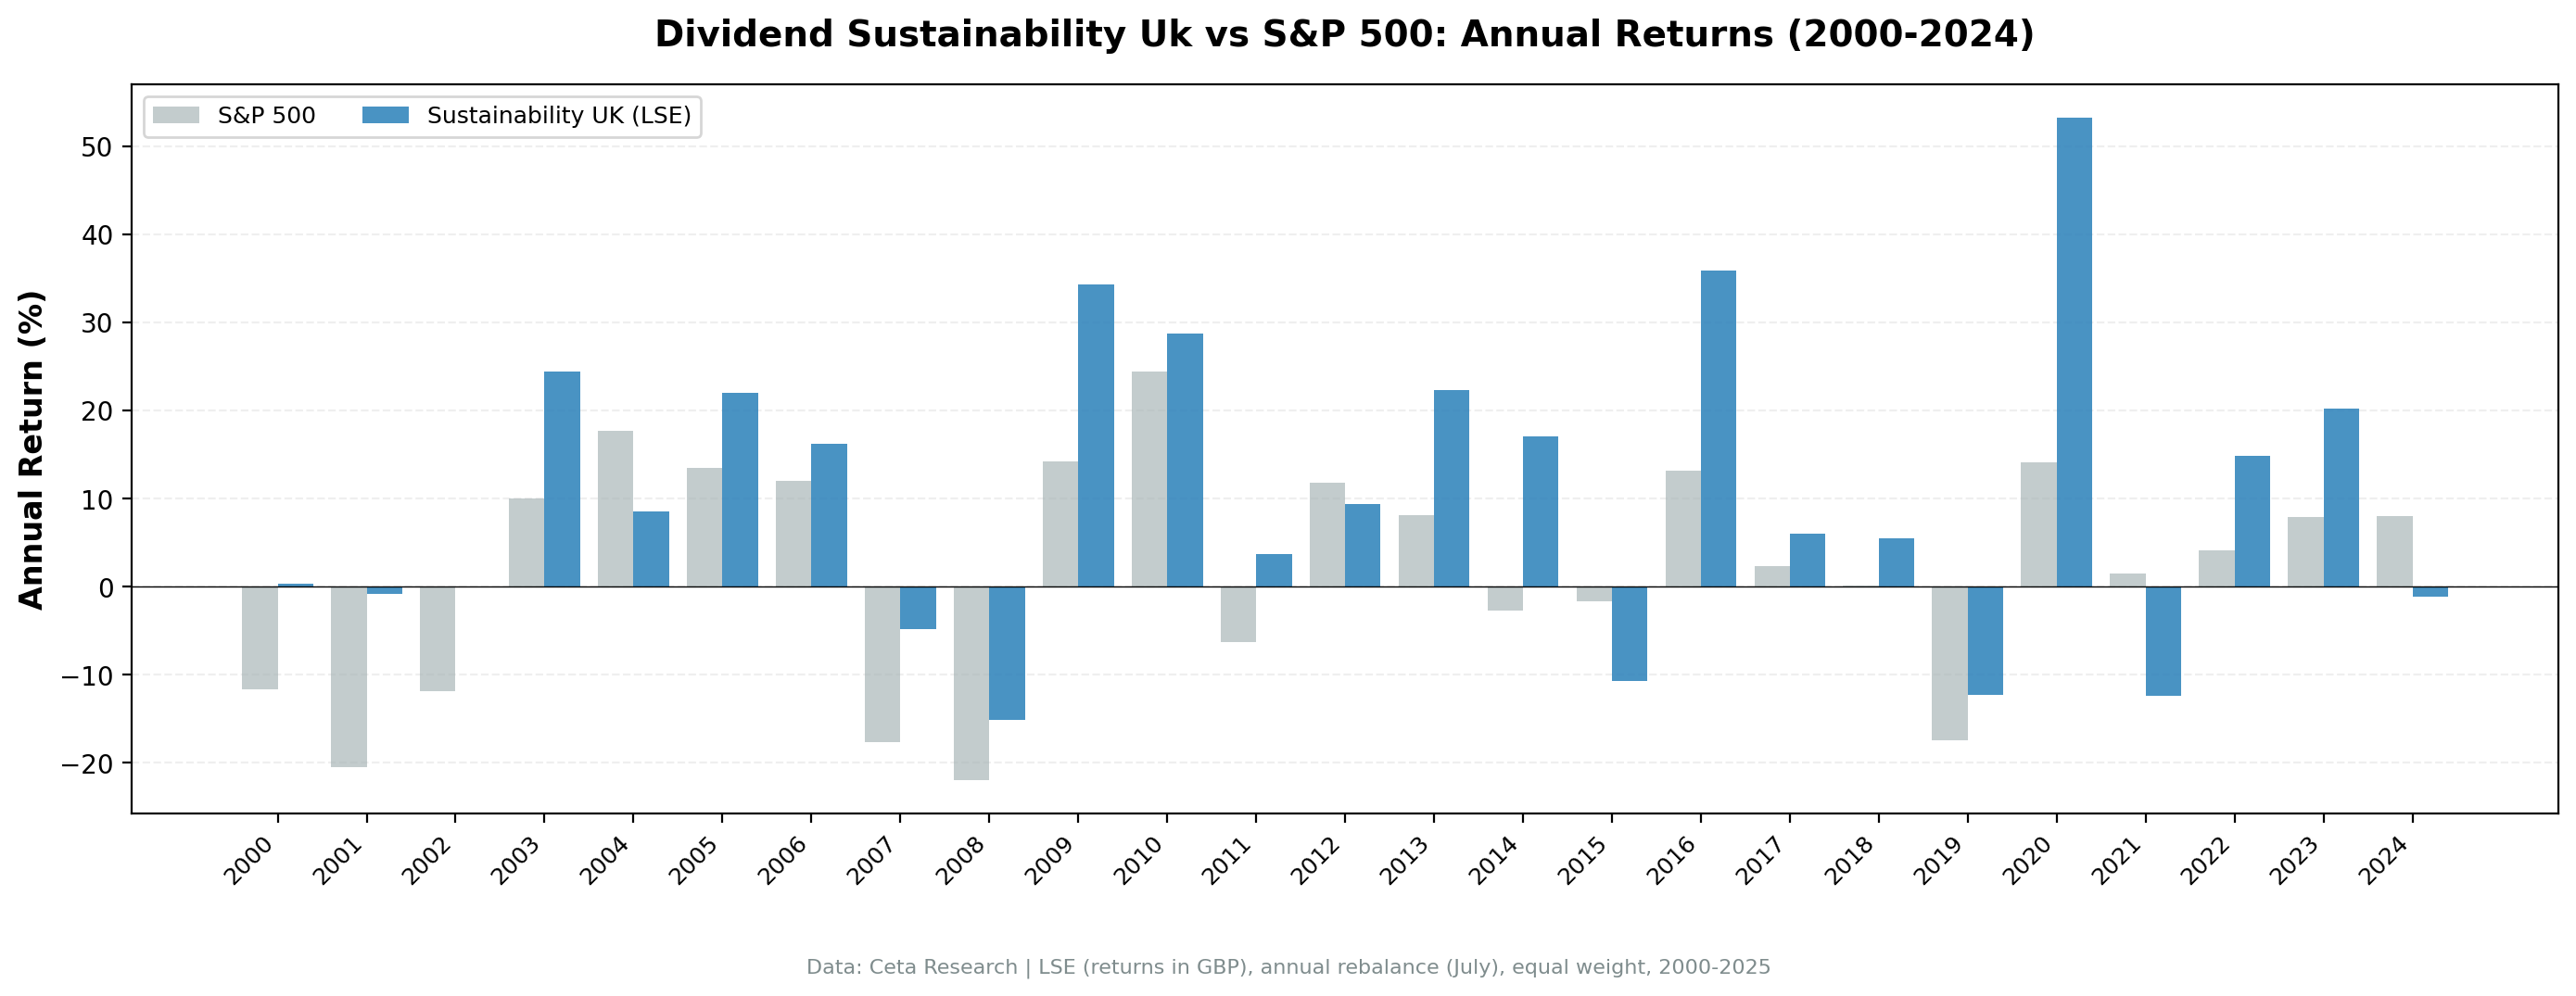
| Year | Sustainability | FTSE 100 | Excess |
|---|---|---|---|
| 2000 | +0.3% | -11.7% | +12.0% |
| 2001 | -0.9% | -20.5% | +19.6% |
| 2002 | -0.0% | -11.9% | +11.9% |
| 2003 | +24.5% | +10.0% | +14.5% |
| 2004 | +8.5% | +17.6% | -9.1% |
| 2005 | +22.0% | +13.5% | +8.5% |
| 2006 | +16.2% | +12.0% | +4.2% |
| 2007 | -4.8% | -17.7% | +12.9% |
| 2008 | -15.1% | -22.0% | +6.8% |
| 2009 | +34.3% | +14.3% | +20.0% |
| 2010 | +28.8% | +24.4% | +4.4% |
| 2011 | +3.7% | -6.3% | +10.0% |
| 2012 | +9.4% | +11.8% | -2.3% |
| 2013 | +22.3% | +8.1% | +14.2% |
| 2014 | +17.0% | -2.7% | +19.8% |
| 2015 | -10.7% | -1.6% | -9.1% |
| 2016 | +35.8% | +13.1% | +22.7% |
| 2017 | +6.0% | +2.3% | +3.7% |
| 2018 | +5.5% | +0.1% | +5.4% |
| 2019 | -12.3% | -17.5% | +5.2% |
| 2020 | +53.2% | +14.2% | +39.1% |
| 2021 | -12.3% | +1.5% | -13.9% |
| 2022 | +14.8% | +4.1% | +10.8% |
| 2023 | +20.2% | +7.9% | +12.3% |
| 2024 | -1.2% | +8.1% | -9.2% |
2000-2003: dot-com protection
Four consecutive years of positive excess. While the FTSE 100 lost roughly 40% from 2000 to 2002, UK sustainability stocks held flat (+0.3%, -0.9%, -0.0%) and then captured the 2003 recovery with +24.5%. Companies clearing the 7+ score requirement carried low debt, generated cash, and avoided the tech speculation entirely. The compounding advantage from these four years persisted through the rest of the series.
2007-2009: the financial crisis advantage
-4.8% in 2007 and -15.1% in 2008. While the FTSE 100 dropped 17.7% and 22.0% in those years, UK sustainability stocks held up far better. The D/E filter was crucial: it excluded UK banks running 20-40x leverage ratios. Northern Rock, HBOS, RBS. All were heavily leveraged and all failed or required bailouts. The sustainability filter kept them out entirely. The portfolio was loaded with consumer staples, pharmaceuticals, and utilities. The +34.3% bounce in 2009 captured the full recovery from a higher base.
2014: the energy crash divergence
+17.0% vs the FTSE's -2.7%. Crude oil collapsed from over $100 to below $50 across 2014, hammering the FTSE 100 (heavy in oil majors and miners). The sustainability screen had already excluded most cyclical commodity names because of their volatile FCF coverage and ROE. Consumer staples, pharma, and industrials carried the portfolio through unscathed.
2016 + 2020: snap-back rallies
+35.8% in 2016 and +53.2% in 2020. The 2016 surge came from the post-Brexit sterling crash, which boosted dividend yields for foreign investors and made UK exporters cheaper. The 2020 result is the headline: a 39-point gap over the FTSE 100 in a single year. UK sustainability stocks rotated hard into health care and consumer staples through the COVID period, then captured the recovery as cyclicals lagged.
2024: the one persistent miss
-1.2% vs the FTSE's +8.1%. The portfolio sat on quality names while the FTSE rallied on a mix of energy, defence, and financials. Years where the index rallies on sectors the sustainability score actively avoids (high leverage, volatile commodity exposure) are the screen's structural blind spot.
Backtest Methodology
| Parameter | Choice |
|---|---|
| Universe | LSE (London Stock Exchange), Market Cap > 500M GBP (~$635M USD) |
| Signal | 5-component sustainability score (0-10), minimum 7 |
| Components | Payout Ratio + D/E + FCF Coverage + ROE + Piotroski F-Score |
| Filters | Dividend Yield > 2%, Market Cap > 500M GBP |
| Portfolio | Top 30 by score descending (yield tiebreak), equal weight |
| Rebalancing | Annual (July) |
| Cash rule | Hold cash if < 10 qualify |
| Benchmark | FTSE 100 (GBP) |
| Execution | Next-day close (MOC after signal) |
| Period | 2000-2025 (25 years) |
| Data | Point-in-time (45-day lag for annual filings) |
| Costs | Size-tiered transaction costs applied |
| Piotroski | Computed from historical financial statements (9 binary signals) |
Limitations
Thin qualifying universe. Average 13 stocks per period is the thinnest in our series. The portfolio rarely fills all 30 slots. That concentration is part of the alpha story, but also a source of single-name risk.
Currency risk for foreign investors. Returns are in GBP. International investors face GBP/USD or other conversion effects. The numbers here reflect local-currency performance vs the local benchmark.
Sector concentration. The screen doesn't balance sectors. UK sustainability stocks skew toward consumer staples, pharmaceuticals, and industrials. In years when those sectors sell off together, there's no diversification buffer.
Survivorship bias. Exchange membership uses current company profiles. Companies that delisted, went bankrupt, or were acquired aren't fully captured.
The Piotroski component uses the scores table for live screening. The backtest computes Piotroski from historical financial statements to avoid look-ahead bias. The live screen uses the scores table for convenience. These may produce slightly different F-Score values for companies near the threshold.
Takeaway
The UK sustainability screen has the largest local-benchmark excess in the entire series. 9.38% CAGR, +8.16% annual excess, 8.07% Jensen alpha over the FTSE 100, 80% win rate, and a 9.2/10 average sustainability score (highest globally). The FTSE 100 itself only managed 1.23% CAGR over this period, making the UK a striking example of how local-benchmark framing changes the picture.
UK companies that pass the 5-factor filter at 7+ are exceptionally high quality. London's deep pool of global blue chips with long dividend histories means the sustainability screen selects from an already-elite universe. The result is a portfolio that compounds at 8 points above the local index while running with a beta near the market (0.961). It doesn't chase returns. It protects capital and compounds well above the local index.
If your priority is generating real alpha over the local market with a quality-tilted portfolio, the UK is one of the strongest results in the series.
Part of a Series
This analysis is part of our dividend sustainability global exchange comparison. We tested the same screen on 12 exchanges worldwide (plus Australia, kept from a prior run pending ASX data fixes): - Dividend Sustainability Score: US Stocks - 10.73% CAGR, full methodology - [Dividend Sustainability on Indian Stocks (NSE)][INDIA_BLOG_URL] - 15.86% CAGR, the standout - [Dividend Sustainability on German Stocks (XETRA)][GERMANY_BLOG_URL] - 12.27% CAGR, best Sharpe (0.652) - [Dividend Sustainability on Canadian Stocks (TSX)][CANADA_BLOG_URL] - 9.96% CAGR - [Dividend Sustainability: Global Exchange Comparison][COMPARISON_BLOG_URL] - full comparison table
References
- DeAngelo, H., DeAngelo, L. & Skinner, D. (1992). "Dividends and Losses." Journal of Finance, 47(5), 1837-1863.
- Piotroski, J. (2000). "Value Investing: The Use of Historical Financial Statement Information to Separate Winners from Losers." Journal of Accounting Research, 38, 1-41.
- Benartzi, S., Michaely, R. & Thaler, R. (1997). "Do Changes in Dividends Signal the Future or the Past?" Journal of Finance, 52(3), 1007-1034.
Run This Screen Yourself
Via web UI: [Run the sustainability screen on Ceta Research][SUSTAINABILITY_UK_QUERY_URL]. The query is pre-loaded. Hit "Run" and see what passes today.
Via Python:
import requests, time

API_KEY = "your_api_key"  # get one at cetaresearch.com
BASE = "https://tradingstudio.finance/api/v1"

resp = requests.post(f"{BASE}/data-explorer/execute", headers={
    "X-API-Key": API_KEY, "Content-Type": "application/json"
}, json={
    "query": """
        WITH latest_ratios AS (
            SELECT r.symbol, r.dividendPayoutRatio, r.debtToEquityRatio,
                   r.dividendYield, r.date,
                ROW_NUMBER() OVER (PARTITION BY r.symbol ORDER BY r.date DESC) AS rn
            FROM financial_ratios r
            JOIN profile p ON r.symbol = p.symbol
            WHERE r.period = 'FY' AND r.dividendPayoutRatio > 0
              AND r.dividendYield IS NOT NULL
              AND p.exchange IN ('LSE')
        ),
        latest_cf AS (
            SELECT c.symbol, c.freeCashFlow, c.commonDividendsPaid, c.date,
                ROW_NUMBER() OVER (PARTITION BY c.symbol ORDER BY c.date DESC) AS rn
            FROM cash_flow_statement c
            JOIN profile p ON c.symbol = p.symbol
            WHERE c.period = 'FY' AND c.commonDividendsPaid < 0
              AND p.exchange IN ('LSE')
        ),
        latest_metrics AS (
            SELECT k.symbol, k.returnOnEquity, k.marketCap, k.date,
                ROW_NUMBER() OVER (PARTITION BY k.symbol ORDER BY k.date DESC) AS rn
            FROM key_metrics k
            JOIN profile p ON k.symbol = p.symbol
            WHERE k.period = 'FY' AND k.marketCap IS NOT NULL
              AND p.exchange IN ('LSE')
        ),
        latest_scores AS (
            SELECT symbol, piotroskiScore FROM scores
        ),
        scored AS (
            SELECT r.symbol,
                CASE WHEN r.dividendPayoutRatio < 0.5 THEN 2
                     WHEN r.dividendPayoutRatio < 0.8 THEN 1 ELSE 0 END +
                CASE WHEN r.debtToEquityRatio >= 0 AND r.debtToEquityRatio < 0.5 THEN 2
                     WHEN r.debtToEquityRatio >= 0 AND r.debtToEquityRatio < 1.5 THEN 1
                     ELSE 0 END +
                CASE WHEN c.freeCashFlow > 0 AND c.commonDividendsPaid < 0
                     AND c.freeCashFlow / ABS(c.commonDividendsPaid) > 2 THEN 2
                     WHEN c.freeCashFlow > 0 AND c.commonDividendsPaid < 0
                     AND c.freeCashFlow / ABS(c.commonDividendsPaid) > 1 THEN 1
                     ELSE 0 END +
                CASE WHEN k.returnOnEquity > 0.15 THEN 2
                     WHEN k.returnOnEquity > 0.08 THEN 1 ELSE 0 END +
                COALESCE(CASE WHEN s.piotroskiScore >= 7 THEN 2
                     WHEN s.piotroskiScore >= 5 THEN 1 ELSE 0 END, 0)
                AS score,
                ROUND(r.dividendYield * 100, 2) AS yield_pct,
                ROUND(k.marketCap / 1e9, 1) AS mktcap_bn
            FROM latest_ratios r
            JOIN latest_cf c ON r.symbol = c.symbol AND c.rn = 1
            JOIN latest_metrics k ON r.symbol = k.symbol AND k.rn = 1
            LEFT JOIN latest_scores s ON r.symbol = s.symbol
            WHERE r.rn = 1 AND r.dividendYield > 0.02
              AND k.marketCap > 500e6
        )
        SELECT symbol, score, yield_pct, mktcap_bn
        FROM scored WHERE score >= 7
        ORDER BY score DESC, yield_pct DESC LIMIT 30
    """,
    "options": {"format": "json", "limit": 100}
})
task_id = resp.json()["taskId"]

while True:
    result = requests.get(f"{BASE}/tasks/data-query/{task_id}",
                          headers={"X-API-Key": API_KEY}).json()
    if result["status"] in ("completed", "failed"):
        break
    time.sleep(2)

for r in result["result"]["rows"][:10]:
    print(f"{r['symbol']:8s} score={r['score']}/10 yield={r['yield_pct']:.1f}%")
Get your API key at cetaresearch.com. The full backtest code (Python + DuckDB) is on GitHub.
Data: Ceta Research, FMP financial data warehouse. Universe: LSE, market cap > 500M GBP. Annual rebalance (July), equal weight top 30 by sustainability score, 2000-2025.
Past performance does not guarantee future results. This is educational content, not investment advice.

