
Dividend Sustainability Score: A 5-Factor Screen on 25 Years of US Stock Data
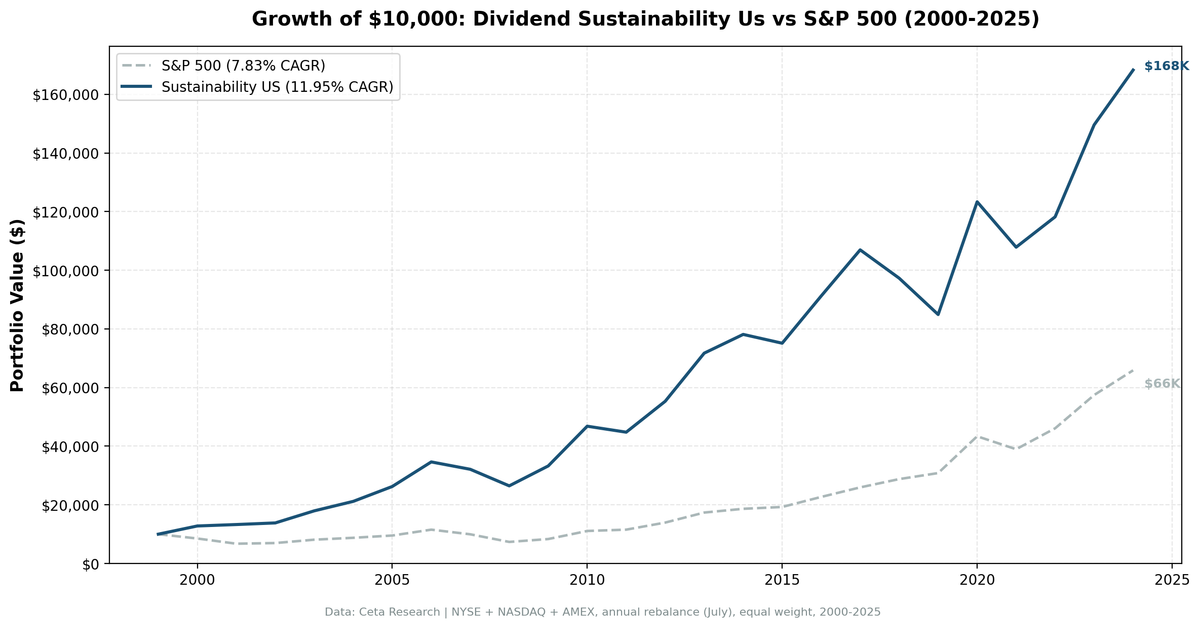
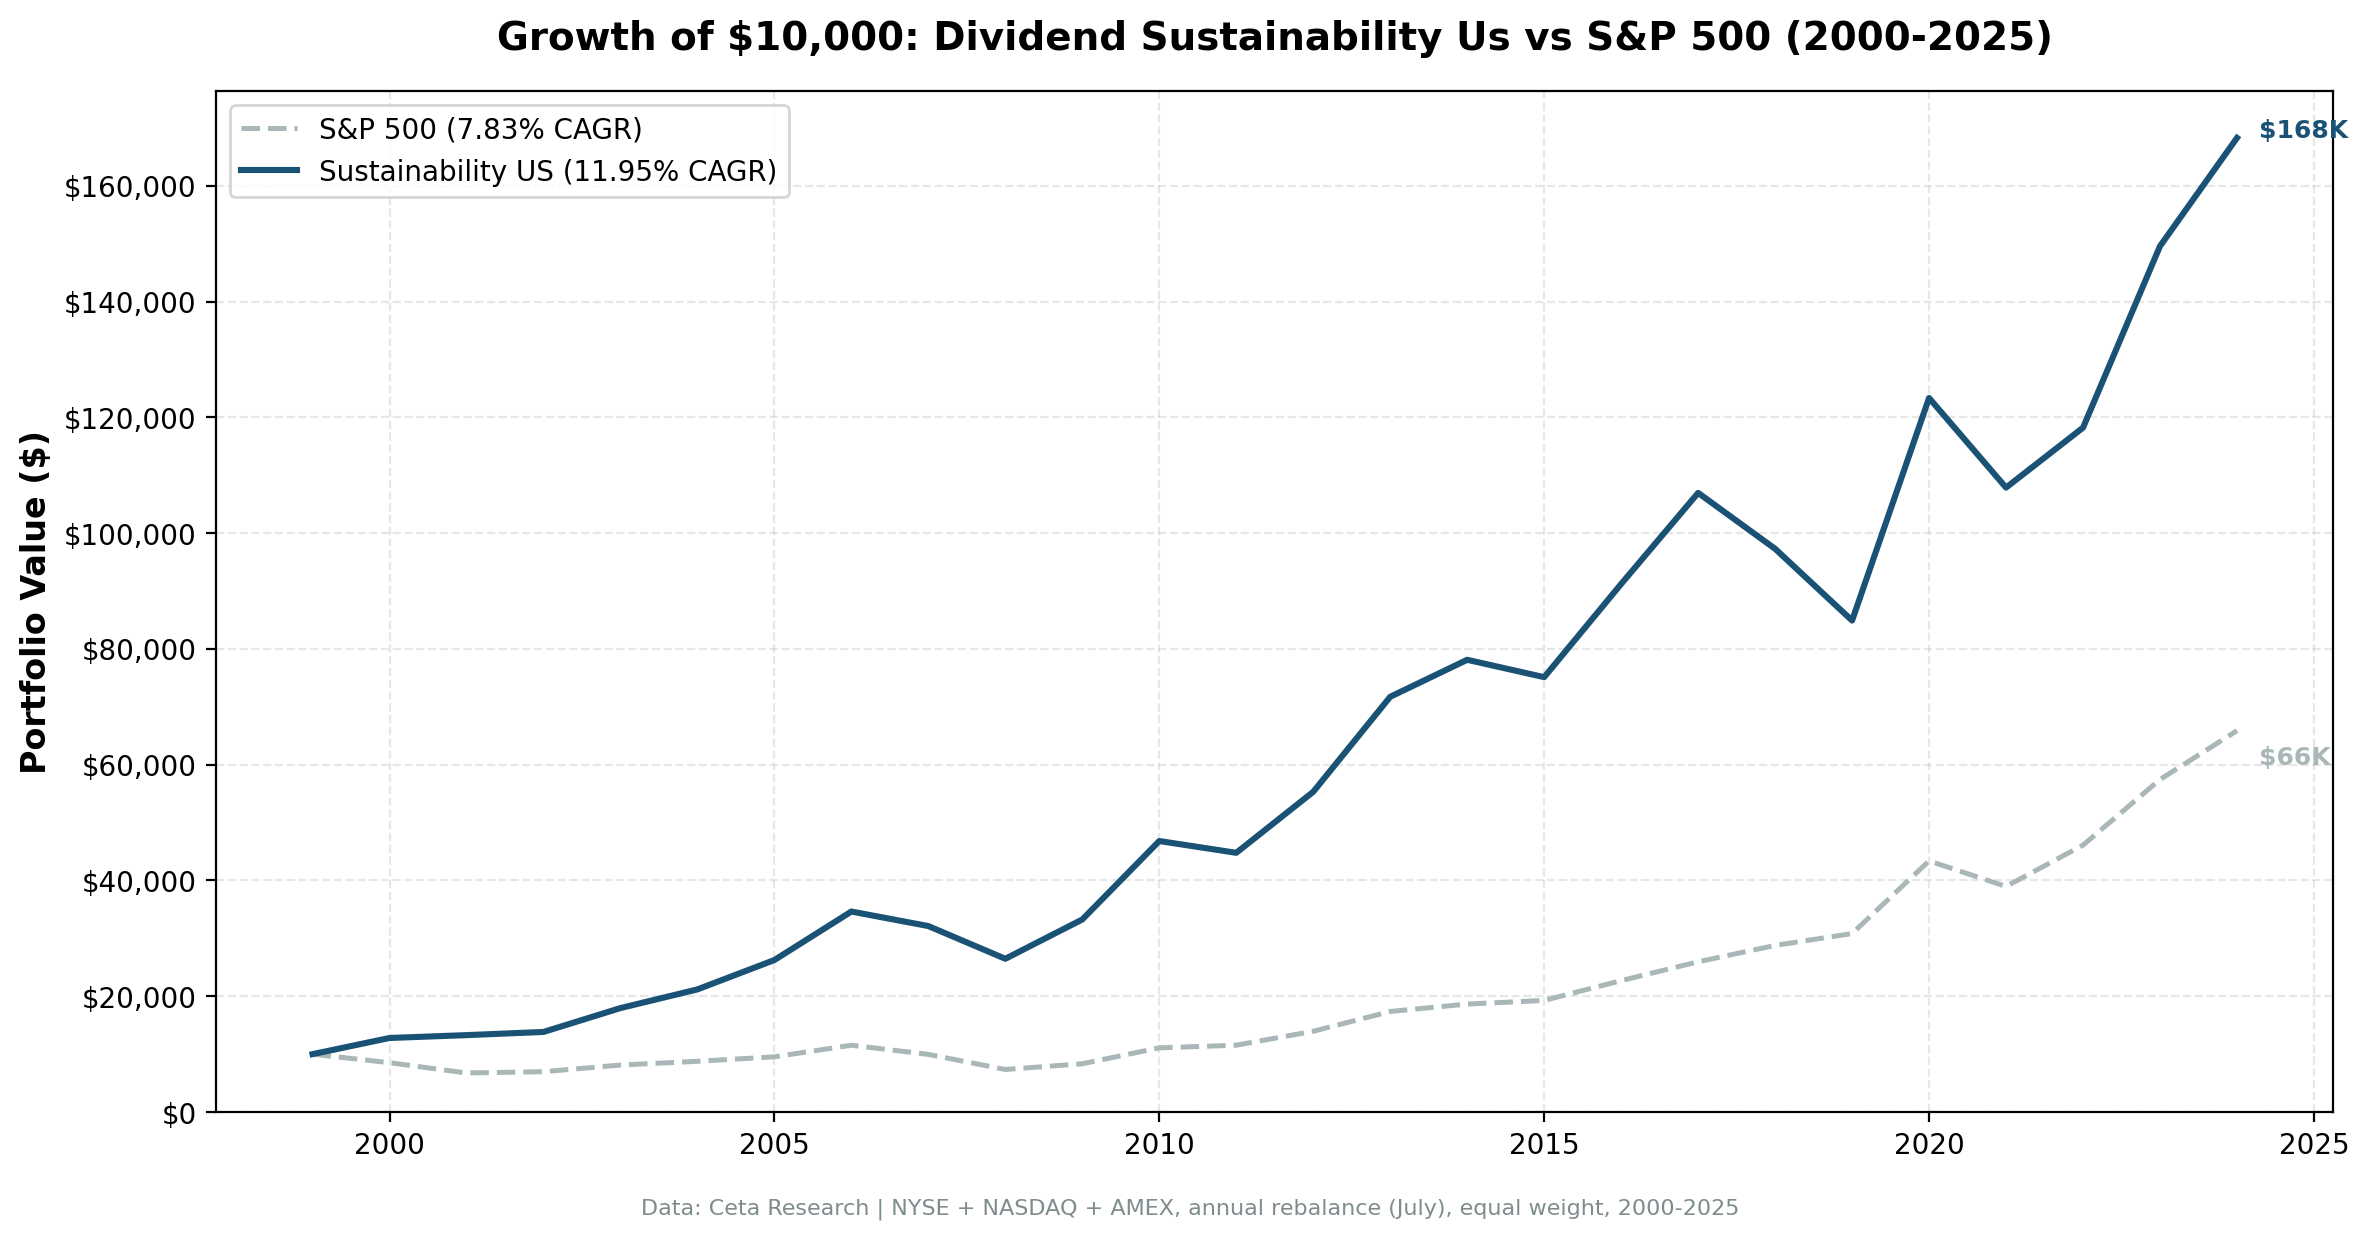
We built a 5-component sustainability score combining payout ratio, debt/equity, FCF coverage, ROE, and Piotroski F-Score. 12.03% CAGR over 25 years vs 7.85% for the S&P 500. Down capture of 12.9%.

Most dividend screens check one thing: can the company afford its current payment? That tells you about today. It doesn't tell you whether the dividend survives the next recession, debt cycle, or competitive shift.
Contents
- Method
- The Sustainability Score
- The Screen (SQL)
- What We Found
- 25 years of data. 4.18% annual alpha over the S&P 500.
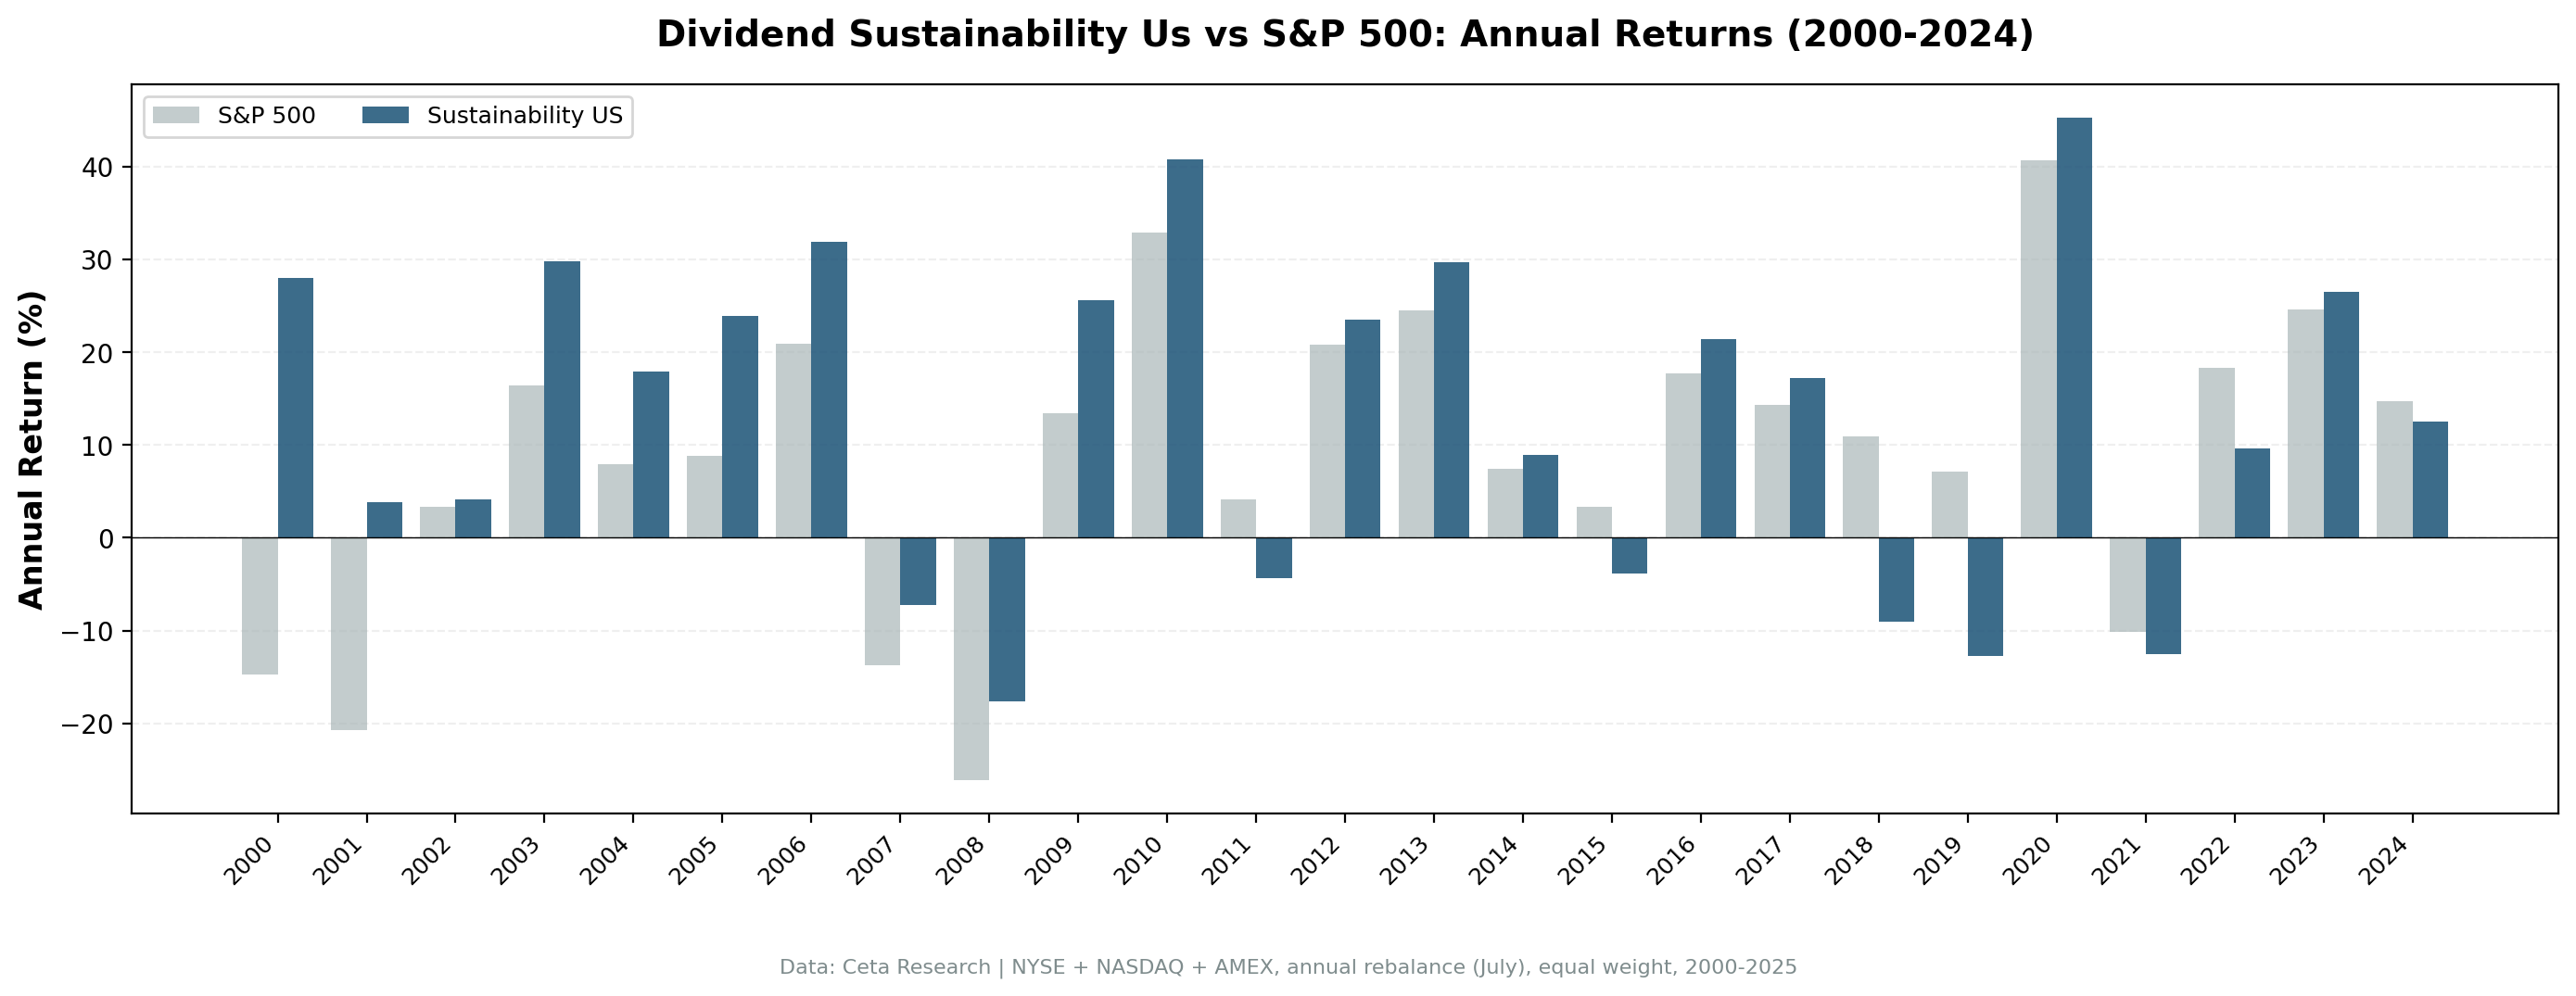
- Year-by-year returns
- The dot-com era: multi-factor quality dominance
- The 2003-2006 bull run
- 2008 financial crisis: genuine protection
- 2018-2019: the weak spot
- 2020: recovery and snap-back
- Backtest Methodology
- Limitations
- Takeaway
- Part of a Series
- References
- Run This Screen Yourself
We built a composite score from five financial dimensions that collectively predict dividend durability. Payout ratio, leverage, free cash flow coverage, profitability, and fundamental health (Piotroski F-Score). Each component scored 0-2, total 0-10. Stocks scoring 7+ with yield above 2%, top 30 by score, equal weight, annual rebalance. The result: 12.03% CAGR over 25 years vs 7.85% for the S&P 500. A 72% win rate and 12.9% down capture, meaning the strategy captured only a fraction of the market's downside.
Data: FMP financial data warehouse, 2000–2025. Updated March 2026.
Method
Data source: Ceta Research (FMP financial data warehouse) Universe: All US exchanges (NYSE, NASDAQ, AMEX), market cap > $1B USD Period: 2000-2025 (25 years, 25 annual periods) Rebalancing: Annual (July), equal weight top 30 by sustainability score descending (yield tiebreak) Benchmark: S&P 500 Total Return (SPY) Execution: Next-day close (market-on-close after signal) Cash rule: Hold cash if fewer than 10 stocks qualify Transaction costs: Size-tiered model (0.1-0.5% one-way based on market cap)
Financial data uses a 45-day lag to prevent look-ahead bias. July rebalance ensures fiscal year filings are available. Entry and exit prices use the next trading day's close after rebalance, eliminating same-day execution bias.
The Sustainability Score
Five components, each scored 0-2 points, total 0-10:
| # | Component | What it measures | Score 2 | Score 1 | Score 0 |
|---|---|---|---|---|---|
| 1 | Payout Ratio | Can earnings cover dividends? | < 50% | 50-80% | > 80% |
| 2 | Debt/Equity | Is leverage manageable? | < 0.5 | 0.5-1.5 | > 1.5 |
| 3 | FCF Coverage | Does cash flow back the dividend? | > 2x | 1-2x | < 1x |
| 4 | ROE | Is the business profitable enough? | > 15% | 8-15% | < 8% |
| 5 | Piotroski F-Score | Is fundamental health improving? | >= 7 | 5-6 | < 5 |
Each component captures a different failure mode. A company can have low payout and still cut because leverage is unsustainable. It can have strong ROE and still cut because cash flow doesn't match reported earnings. The Piotroski F-Score adds trend information: is profitability improving, is leverage declining, are margins expanding?
Academic basis: DeAngelo, DeAngelo & Skinner (1992) showed that companies cutting dividends exhibited multi-dimensional deterioration beforehand, not just one bad metric. Piotroski (2000) demonstrated that composite scores from simple binary signals outperform individual metrics for separating winners from losers.
The F-Score is computed from historical income statements, balance sheets, and cash flow statements (9 binary signals). This avoids look-ahead bias from using snapshot score tables that lack a date dimension.
Minimum score: 7/10. A stock must score well on at least four of five dimensions with strong marks on multiple. Yield must exceed 2% to filter out token dividends. The portfolio holds the top 30 by score with yield as the tiebreaker.
The Screen (SQL)
WITH latest_ratios AS (
    SELECT r.symbol, r.dividendPayoutRatio, r.debtToEquityRatio,
           r.dividendYield, r.date,
        ROW_NUMBER() OVER (PARTITION BY r.symbol ORDER BY r.date DESC) AS rn
    FROM financial_ratios r
    JOIN profile p ON r.symbol = p.symbol
    WHERE r.period = 'FY'
      AND r.dividendPayoutRatio > 0
      AND r.dividendYield IS NOT NULL
      AND p.exchange IN ('NYSE', 'NASDAQ', 'AMEX')
),
latest_cf AS (
    SELECT c.symbol, c.freeCashFlow, c.commonDividendsPaid, c.date,
        ROW_NUMBER() OVER (PARTITION BY c.symbol ORDER BY c.date DESC) AS rn
    FROM cash_flow_statement c
    JOIN profile p ON c.symbol = p.symbol
    WHERE c.period = 'FY'
      AND c.commonDividendsPaid < 0
      AND p.exchange IN ('NYSE', 'NASDAQ', 'AMEX')
),
latest_metrics AS (
    SELECT k.symbol, k.returnOnEquity, k.marketCap, k.date,
        ROW_NUMBER() OVER (PARTITION BY k.symbol ORDER BY k.date DESC) AS rn
    FROM key_metrics k
    JOIN profile p ON k.symbol = p.symbol
    WHERE k.period = 'FY'
      AND k.marketCap IS NOT NULL
      AND p.exchange IN ('NYSE', 'NASDAQ', 'AMEX')
),
latest_scores AS (
    SELECT symbol, piotroskiScore
    FROM scores
),
scored AS (
    SELECT r.symbol, r.date,
        ROUND(r.dividendPayoutRatio * 100, 1) AS payout_pct,
        ROUND(r.debtToEquityRatio, 2) AS debt_equity,
        ROUND(c.freeCashFlow / NULLIF(ABS(c.commonDividendsPaid), 0), 2) AS fcf_coverage,
        ROUND(k.returnOnEquity * 100, 1) AS roe_pct,
        s.piotroskiScore AS piotroski,
        ROUND(r.dividendYield * 100, 2) AS yield_pct,
        ROUND(k.marketCap / 1e9, 1) AS mktcap_bn,
        CASE WHEN r.dividendPayoutRatio < 0.5 THEN 2
             WHEN r.dividendPayoutRatio < 0.8 THEN 1 ELSE 0 END AS c_payout,
        CASE WHEN r.debtToEquityRatio >= 0 AND r.debtToEquityRatio < 0.5 THEN 2
             WHEN r.debtToEquityRatio >= 0 AND r.debtToEquityRatio < 1.5 THEN 1
             ELSE 0 END AS c_debt,
        CASE WHEN c.freeCashFlow > 0 AND c.commonDividendsPaid < 0
                  AND c.freeCashFlow / ABS(c.commonDividendsPaid) > 2 THEN 2
             WHEN c.freeCashFlow > 0 AND c.commonDividendsPaid < 0
                  AND c.freeCashFlow / ABS(c.commonDividendsPaid) > 1 THEN 1
             ELSE 0 END AS c_fcf,
        CASE WHEN k.returnOnEquity > 0.15 THEN 2
             WHEN k.returnOnEquity > 0.08 THEN 1 ELSE 0 END AS c_roe,
        CASE WHEN s.piotroskiScore >= 7 THEN 2
             WHEN s.piotroskiScore >= 5 THEN 1 ELSE 0 END AS c_piotroski
    FROM latest_ratios r
    JOIN latest_cf c ON r.symbol = c.symbol AND c.rn = 1
    JOIN latest_metrics k ON r.symbol = k.symbol AND k.rn = 1
    LEFT JOIN latest_scores s ON r.symbol = s.symbol
    WHERE r.rn = 1
      AND r.dividendYield > 0.02
      AND k.marketCap > 1e9
)
SELECT symbol, date, payout_pct, debt_equity, fcf_coverage, roe_pct, piotroski,
       yield_pct, mktcap_bn,
       c_payout + c_debt + c_fcf + c_roe + COALESCE(c_piotroski, 0) AS sustainability_score,
       c_payout, c_debt, c_fcf, c_roe, COALESCE(c_piotroski, 0) AS c_piotroski
FROM scored
WHERE c_payout + c_debt + c_fcf + c_roe + COALESCE(c_piotroski, 0) >= 7
ORDER BY sustainability_score DESC, yield_pct DESC
LIMIT 30
Run this query on Ceta Research
What We Found
25 years of data. 4.18% annual alpha over the S&P 500.
| Metric | Sustainability (US) | S&P 500 |
|---|---|---|
| CAGR | 12.03% | 7.85% |
| Total Return | 1,613% | 562% |
| Volatility | 18.1% | 16.6% |
| Max Drawdown | -26.07% | -38.01% |
| Sharpe Ratio | 0.556 | 0.352 |
| Sortino Ratio | 1.461 | 0.628 |
| Win Rate (annual) | 72% | - |
| Down Capture | 12.9% | - |
| Up Capture | 109.1% | - |
| Avg Stocks per Period | 27.3 | - |
| Cash Periods | 0 of 25 | - |
| Avg Sustainability Score | 9.4/10 | - |
$10,000 invested in 2000 grew to roughly $171,000. The same amount in the S&P 500 grew to $66,000. The portfolio was fully invested every single year. 27 stocks on average, zero cash drag.
The standout metric is down capture at 12.9%. The strategy captured only a fraction of the market's downside over 25 years. When SPY fell, sustainability stocks moved far less. The max drawdown confirms this: -26.07% vs -38.01% for the benchmark. This is consistent with the academic hypothesis: multi-factor sustainability scores identify companies built to weather recessions.
The Sharpe ratio (0.556 vs 0.352) and Sortino (1.461 vs 0.628) both show meaningfully better risk-adjusted returns. The portfolio had only 7 negative years out of 25 (28% negative periods).
Year-by-year returns
| Year | Sustainability | S&P 500 | Excess |
|---|---|---|---|
| 2000 | +27.9% | -14.8% | +42.7% |
| 2001 | +1.4% | -22.4% | +23.9% |
| 2002 | +7.3% | +6.9% | +0.4% |
| 2003 | +28.9% | +14.9% | +14.0% |
| 2004 | +19.2% | +8.9% | +10.3% |
| 2005 | +23.4% | +8.0% | +15.4% |
| 2006 | +31.9% | +20.9% | +11.0% |
| 2007 | -9.6% | -15.2% | +5.6% |
| 2008 | -18.3% | -26.9% | +8.6% |
| 2009 | +28.4% | +16.0% | +12.5% |
| 2010 | +41.1% | +33.5% | +7.5% |
| 2011 | -4.0% | +4.2% | -8.2% |
| 2012 | +22.6% | +20.7% | +1.8% |
| 2013 | +30.3% | +24.7% | +5.5% |
| 2014 | +8.2% | +7.2% | +1.1% |
| 2015 | -5.2% | +2.7% | -7.9% |
| 2016 | +23.5% | +18.6% | +4.9% |
| 2017 | +17.2% | +14.3% | +2.9% |
| 2018 | -9.5% | +11.2% | -20.7% |
| 2019 | -11.7% | +7.4% | -19.1% |
| 2020 | +45.0% | +41.0% | +4.0% |
| 2021 | -13.1% | -10.7% | -2.4% |
| 2022 | +10.9% | +18.1% | -7.1% |
| 2023 | +26.4% | +25.4% | +1.0% |
| 2024 | +14.2% | +14.4% | -0.2% |
The dot-com era: multi-factor quality dominance
| Year | Sustainability | S&P 500 | Excess |
|---|---|---|---|
| 2000 | +27.9% | -14.8% | +42.7% |
| 2001 | +1.4% | -22.4% | +23.9% |
While the S&P 500 lost 35% over two years, sustainability stocks returned +28% in 2000 and stayed positive in 2001. Companies scoring 7+/10 on the sustainability composite were generating cash, carrying low debt, and maintaining strong fundamentals. They were the anti-dot-com portfolio. The 5-component filter didn't just avoid the bubble. It selected the exact companies investors rotated into.
The 2003-2006 bull run
Four consecutive years of double-digit alpha. The strategy returned +28.9%, +19.2%, +23.4%, and +31.9% vs SPY's +14.9%, +8.9%, +8.0%, +20.9%. Sustainable dividend payers benefited from the post-crash recovery and the return to fundamentals-based investing. The companies that survived 2000-2002 with high sustainability scores were the ones that led the recovery.
2008 financial crisis: genuine protection
Sustainability stocks dropped 18.3% vs 26.9% for SPY. That's 8.6% of cushion during the worst crisis since the Great Depression. The sustainability score weeded out overleveraged financials. The D/E component penalized banks with debt-to-equity above 1.5. The Piotroski component caught deteriorating fundamentals. Companies in the portfolio had low leverage, strong cash flows, and improving margins. They still fell, but meaningfully less.
2018-2019: the weak spot
Two consecutive years of nearly -20% excess. Growth-oriented markets where mega-cap tech dominates the index are the strategy's blind spot. Sustainability stocks are dividend payers with modest growth. They don't keep up when FAANG names are doing 30-40% years. This is the cost of down capture protection. You give up upside participation in momentum-driven rallies.
2020: recovery and snap-back
+45.0% vs +41.0%. After two weak years, sustainability stocks loaded up on beaten-down quality names in the July 2020 rebalance. Companies with low debt, strong cash flows, and healthy fundamentals recovered aggressively from COVID lows.
Backtest Methodology
| Parameter | Choice |
|---|---|
| Universe | NYSE + NASDAQ + AMEX, Market Cap > $1B USD |
| Signal | 5-component sustainability score (0-10), minimum 7 |
| Components | Payout Ratio + D/E + FCF Coverage + ROE + Piotroski F-Score |
| Filters | Dividend Yield > 2%, Market Cap > $1B |
| Portfolio | Top 30 by score descending (yield tiebreak), equal weight |
| Rebalancing | Annual (July) |
| Cash rule | Hold cash if < 10 qualify |
| Benchmark | S&P 500 Total Return (SPY) |
| Period | 2000-2025 (25 years) |
| Data | Point-in-time (45-day lag for annual filings) |
| Execution | Next-day close (MOC after signal) |
| Costs | Size-tiered transaction costs applied |
| Piotroski | Computed from historical financial statements (9 binary signals) |
Limitations
The 7/10 threshold is arbitrary. A cutoff of 6 or 8 would produce different results. We chose 7 because it requires strength across at least four of five dimensions. Lower thresholds dilute signal quality. Higher thresholds reduce the investable universe.
Annual rebalancing is slow. A company's sustainability score can deteriorate between July rebalances. Monthly rebalancing would catch problems faster but increase turnover and costs.
Component weights are equal. Each dimension contributes 0-2 points. In practice, D/E and Piotroski might be more predictive than payout ratio. We didn't optimize weights because that introduces overfitting risk.
Sector concentration. The screen doesn't balance sectors. Some years skew heavily toward industrials, consumer staples, or utilities. When those sectors sell off, the portfolio has no diversification buffer.
Survivorship bias. Exchange membership uses current company profiles. Companies that delisted, went bankrupt, or were acquired aren't fully captured.
The Piotroski component uses the scores table for live screening. The backtest computes Piotroski from historical financial statements to avoid look-ahead bias. The live screen uses the scores table for convenience. These may produce slightly different F-Score values for companies near the threshold.
Takeaway
The dividend sustainability score works on US stocks. 12.03% CAGR over 25 years, 4.18% annual alpha, zero cash periods, and 12.9% down capture. The strategy identifies companies where the dividend payment is backed by multiple financial dimensions, not just one ratio.
The edge comes from combining signals that individually are mediocre but together create a comprehensive picture of dividend health. Low payout means room to grow. Low debt means the company can survive recessions. High FCF coverage means the dividend is funded from real cash. Strong ROE means the business generates attractive returns. A high Piotroski score means fundamentals are trending in the right direction.
The 72% win rate is unusually high for a factor strategy. The 12.9% down capture is strong. The cost: multi-year underperformance during growth rallies (2018-2019 were painful). Sustainability stocks are boring by design. They protect capital and compound steadily. They don't chase momentum.
Part of a Series
This analysis is part of our dividend sustainability global exchange comparison. We tested the same screen on 13 exchanges worldwide: - [Dividend Sustainability on Indian Stocks (NSE)][INDIA_BLOG_URL] - 15.81% CAGR, +3.75% vs Sensex - [Dividend Sustainability on German Stocks (XETRA)][GERMANY_BLOG_URL] - 11.53% CAGR, +6.49% vs DAX - [Dividend Sustainability on Canadian Stocks (TSX)][CANADA_BLOG_URL] - 9.54% CAGR, +5.59% vs TSX Composite - [Dividend Sustainability on UK Stocks (LSE)][UK_BLOG_URL] - 8.52% CAGR, +7.29% vs FTSE 100 - [Dividend Sustainability: 13-Exchange Global Comparison][COMPARISON_BLOG_URL] - full comparison table
References
- DeAngelo, H., DeAngelo, L. & Skinner, D. (1992). "Dividends and Losses." Journal of Finance, 47(5), 1837-1863.
- Piotroski, J. (2000). "Value Investing: The Use of Historical Financial Statement Information to Separate Winners from Losers." Journal of Accounting Research, 38, 1-41.
- Benartzi, S., Michaely, R. & Thaler, R. (1997). "Do Changes in Dividends Signal the Future or the Past?" Journal of Finance, 52(3), 1007-1034.
Run This Screen Yourself
Via web UI: Run the sustainability screen on Ceta Research. The query is pre-loaded. Hit "Run" and see what passes today.
Via Python:
import requests, time

API_KEY = "your_api_key"  # get one at cetaresearch.com
BASE = "https://tradingstudio.finance/api/v1"

resp = requests.post(f"{BASE}/data-explorer/execute", headers={
    "X-API-Key": API_KEY, "Content-Type": "application/json"
}, json={
    "query": """
        WITH latest_ratios AS (
            SELECT r.symbol, r.dividendPayoutRatio, r.debtToEquityRatio,
                   r.dividendYield, r.date,
                ROW_NUMBER() OVER (PARTITION BY r.symbol ORDER BY r.date DESC) AS rn
            FROM financial_ratios r
            WHERE r.period = 'FY' AND r.dividendPayoutRatio > 0
              AND r.dividendYield IS NOT NULL
        ),
        latest_cf AS (
            SELECT c.symbol, c.freeCashFlow, c.commonDividendsPaid, c.date,
                ROW_NUMBER() OVER (PARTITION BY c.symbol ORDER BY c.date DESC) AS rn
            FROM cash_flow_statement c
            WHERE c.period = 'FY' AND c.commonDividendsPaid < 0
        ),
        latest_metrics AS (
            SELECT k.symbol, k.returnOnEquity, k.marketCap, k.date,
                ROW_NUMBER() OVER (PARTITION BY k.symbol ORDER BY k.date DESC) AS rn
            FROM key_metrics k WHERE k.period = 'FY' AND k.marketCap IS NOT NULL
        ),
        latest_scores AS (
            SELECT symbol, piotroskiScore FROM scores
        ),
        scored AS (
            SELECT r.symbol,
                CASE WHEN r.dividendPayoutRatio < 0.5 THEN 2
                     WHEN r.dividendPayoutRatio < 0.8 THEN 1 ELSE 0 END +
                CASE WHEN r.debtToEquityRatio >= 0 AND r.debtToEquityRatio < 0.5 THEN 2
                     WHEN r.debtToEquityRatio >= 0 AND r.debtToEquityRatio < 1.5 THEN 1
                     ELSE 0 END +
                CASE WHEN c.freeCashFlow > 0 AND c.commonDividendsPaid < 0
                     AND c.freeCashFlow / ABS(c.commonDividendsPaid) > 2 THEN 2
                     WHEN c.freeCashFlow > 0 AND c.commonDividendsPaid < 0
                     AND c.freeCashFlow / ABS(c.commonDividendsPaid) > 1 THEN 1
                     ELSE 0 END +
                CASE WHEN k.returnOnEquity > 0.15 THEN 2
                     WHEN k.returnOnEquity > 0.08 THEN 1 ELSE 0 END +
                COALESCE(CASE WHEN s.piotroskiScore >= 7 THEN 2
                     WHEN s.piotroskiScore >= 5 THEN 1 ELSE 0 END, 0)
                AS score,
                ROUND(r.dividendYield * 100, 2) AS yield_pct,
                ROUND(k.marketCap / 1e9, 1) AS mktcap_bn
            FROM latest_ratios r
            JOIN latest_cf c ON r.symbol = c.symbol AND c.rn = 1
            JOIN latest_metrics k ON r.symbol = k.symbol AND k.rn = 1
            LEFT JOIN latest_scores s ON r.symbol = s.symbol
            WHERE r.rn = 1 AND r.dividendYield > 0.02 AND k.marketCap > 1e9
        )
        SELECT symbol, score, yield_pct, mktcap_bn
        FROM scored WHERE score >= 7
        ORDER BY score DESC, yield_pct DESC LIMIT 30
    """,
    "options": {"format": "json", "limit": 100}
})
task_id = resp.json()["taskId"]

while True:
    result = requests.get(f"{BASE}/tasks/data-query/{task_id}",
                          headers={"X-API-Key": API_KEY}).json()
    if result["status"] in ("completed", "failed"):
        break
    time.sleep(2)

for r in result["result"]["rows"][:10]:
    print(f"{r['symbol']:8s} score={r['score']}/10 yield={r['yield_pct']:.1f}%")
Get your API key at cetaresearch.com. The full backtest code (Python + DuckDB) is on GitHub.
Data: Ceta Research, FMP financial data warehouse. Universe: NYSE + NASDAQ + AMEX. Annual rebalance (July), equal weight top 30 by sustainability score, 2000-2025.


