
Earnings Surprise Drift in Brazil: Beats Drift, Misses Barely Move

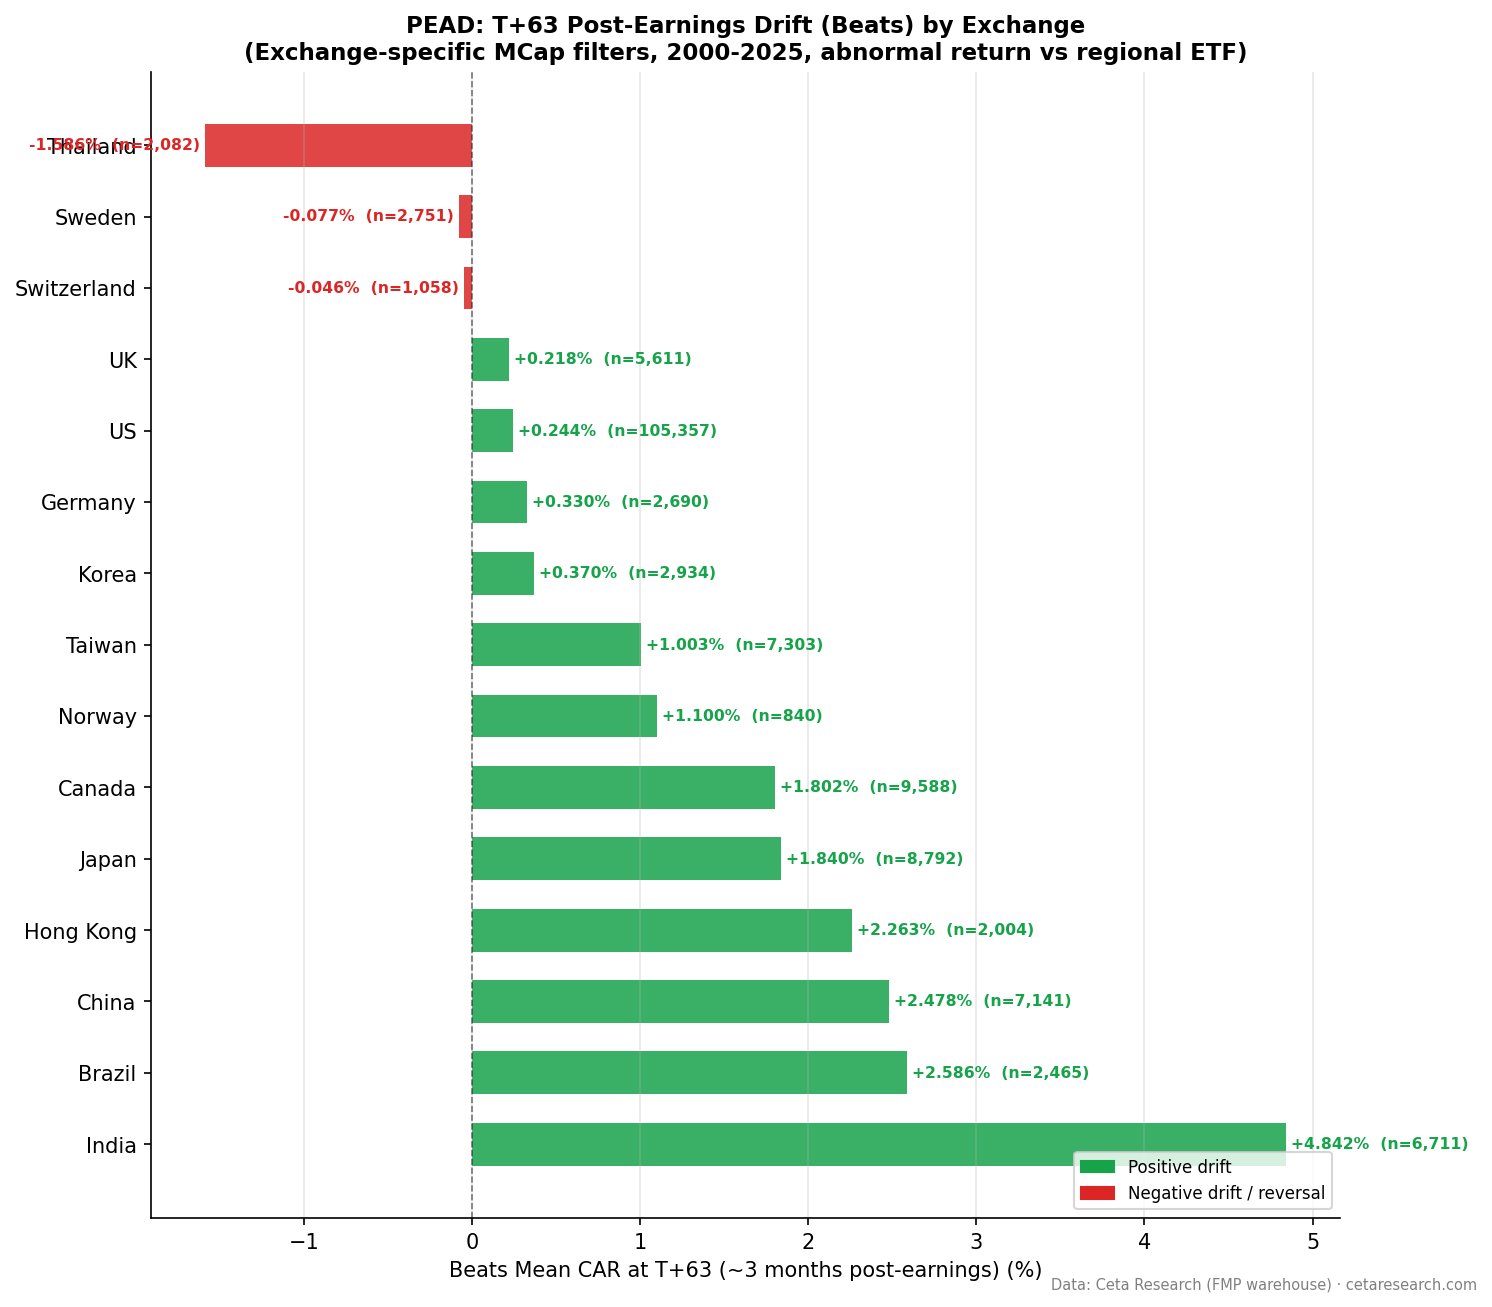
Brazil is a positive-side PEAD market. Earnings beats produce +2.59% cumulative abnormal return at T+63. Misses produce just -0.24%, which isn't statistically significant. The Q5-Q1 spread of +3.38% is driven almost entirely by the positive tail. If you want to implement PEAD in Brazil, following the beats is where the signal lives.
Contents
- Method
- The Strategy
- What We Found
- Positive vs Negative Surprise Drift
- Quintile Analysis at T+63
- Brazil vs India (Both Positive-Side Markets)
- When It Works and When It Struggles
- Run It Yourself
- Limitations
- Part of a Series
- References
Method
| Parameter | Details |
|---|---|
| Data source | FMP earnings_surprises + stock_eod (Ceta Research warehouse) |
| Universe | SAO (B3, Brazil) — market cap threshold applied per exchange |
| Period | 2000–2025 (26 years) |
| Events | 5,292 total (deduplicated per symbol/date) |
| Benchmark | Equal-weighted SAO market return |
| Surprise metric | (epsActual − epsEstimated) / ABS(epsEstimated) |
| Windows | T+1, T+5, T+21, T+63 trading days |
The Strategy
Post-Earnings Announcement Drift (PEAD) documents that stocks continue drifting in the direction of their earnings surprise for weeks after announcement. Ball and Brown (1968) first established this. Bernard and Thomas (1989) confirmed the drift persists for up to 60 trading days. Foster, Olsen, and Shevlin (1984) analyzed different earnings windows.
Brazil presents an interesting case for PEAD: an emerging market with meaningful institutional participation, active sell-side coverage for large caps, but higher macro volatility than developed markets. Interest rates, commodity cycles, and currency moves regularly dominate earnings news. This creates an environment where earnings beats may carry more sustained signal than in markets where macro noise is lower.
What We Found
Positive vs Negative Surprise Drift
| Direction | Events | Beat% | T+1 | T+5 | T+21 | T+63 |
|---|---|---|---|---|---|---|
| Positive surprises | 2,465 | 46.6% | +0.57% | +1.13% | +1.99% | +2.59% |
| Negative surprises | 2,827 | 53.4% | -0.70% | -0.74% | -0.46% | -0.24% |
The positive drift is the story. Beats build steadily from T+1 (+0.57%) through T+5 (+1.13%), T+21 (+1.99%), and reach +2.59% at T+63. This is a genuine, sustained drift that compounds over the full window. There's no sign of mean reversion.
The negative side barely drifts. The sharpest negative reaction is at T+1 (-0.70%), but it fades. By T+21 the drift is -0.46%, and at T+63 it's essentially zero (-0.24%). Earnings misses in Brazil are absorbed quickly and don't persist.
Quintile Analysis at T+63
| Quintile | Description | Events | CAR T+63 | t-stat | Hit Rate |
|---|---|---|---|---|---|
| Q5 | Biggest beats | 1,015 | +2.44% | +3.8 | 53.7% |
| Q4 | Moderate beats | — | +2.65% | — | — |
| Q3 | Near-consensus | — | +2.03% | — | — |
| Q2 | Moderate misses | — | -0.93% | — | — |
| Q1 | Worst misses | 985 | -0.94% | -1.4 | 44.7% |
Q5 (t=3.8, hit rate 53.7%) is statistically significant with a positive majority of events. Q4 (+2.65%) actually exceeds Q5 slightly, which is within normal sampling variation given the smaller event counts in this market.
Q1's t-stat is -1.4. That's below the conventional 5% significance threshold. The -0.94% at T+63 for the worst misses is economically modest and statistically unreliable. This isn't a short-the-miss market.
The entire positive half of the distribution (Q3 through Q5) produces meaningful positive CAR at T+63, suggesting that even near-consensus outcomes in Brazil carry some positive drift. This may reflect a general positive relationship between earnings announcements and stock performance in the B3 universe during this period, or the benchmark construction. The Q5-Q1 spread (+3.38%) remains meaningful as a signal, but the source is the beat side, not the miss side.
Brazil vs India (Both Positive-Side Markets)
Both Brazil and India show positive-side PEAD without meaningful miss-side drift. India's signal is larger and more statistically robust (14,360 events vs Brazil's 5,292), but the structural similarity is notable.
| Metric | Brazil | India |
|---|---|---|
| Events | 5,292 | 14,360 |
| Beat rate | 46.6% | 46.7% |
| Q5 CAR T+63 | +2.44% | +6.67% |
| Q1 CAR T+63 | -0.94% (ns) | -0.92% |
| Q5-Q1 spread | +3.38% | +7.59% |
The similarity in beat rate (46.6% vs 46.7%) is striking. Both markets produce analyst estimates that aren't systematically conservative, yet both show strong positive drift for genuine beats. India's Q5 drift is more than 2.5x Brazil's, which likely reflects differences in market depth, analyst coverage density, and the historical return environment.
When It Works and When It Struggles
The positive drift in Brazil builds gradually over all four windows. There's no concentration at T+1 or a brief pop that fades. This suggests Brazilian institutional investors incorporate positive earnings information slowly, providing a relatively wide capture window.
Brazil's high nominal interest rate environment (Selic rate has ranged from 7.25% to 13.75% during our sample period) creates a different discount rate backdrop than developed markets. Earnings beats may compound more when nominal rates are lower (cheaper cost of capital for growth reinvestment) and less when rates are high. We don't control for this in the aggregate analysis.
The 5,292 total events is the smallest sample among the markets profiled in this series (excluding Thailand's 4,540). Individual year results will have wider variance. The Q5 t-stat of 3.8 is solid but not dominant. Practitioners should size positions conservatively relative to larger-sample markets.
Run It Yourself
python3 earnings-surprise/screen.py --preset brazil
-- Recent large positive earnings surprises on B3
WITH deduped AS (
 SELECT
 es.symbol,
 es.date,
 es.epsActual,
 es.epsEstimated,
 (es.epsActual - es.epsEstimated) / NULLIF(ABS(es.epsEstimated), 0) AS std_surprise,
 ROW_NUMBER() OVER (PARTITION BY es.symbol, es.date ORDER BY es.lastUpdated DESC) AS rn
 FROM earnings_surprises es
 JOIN profile p ON es.symbol = p.symbol
 WHERE p.exchange = 'SAO'
 AND p.isActivelyTrading = true
 AND es.date >= CURRENT_DATE - INTERVAL '90 days'
 AND ABS(es.epsEstimated) > 0.01
)
SELECT
 symbol,
 date,
 epsActual,
 epsEstimated,
 ROUND(std_surprise * 100, 1) AS surprise_pct
FROM deduped
WHERE rn = 1
 AND std_surprise > 0.10
ORDER BY date DESC, std_surprise DESC
LIMIT 50
Run this query on Ceta Research →
Limitations
5,292 events over 26 years is a relatively thin sample. Brazil had fewer listed companies with systematic analyst consensus coverage in the early 2000s. Coverage density on B3 has improved post-2010. Results from the first decade carry wider confidence intervals.
Currency volatility is a confounding factor for international investors. The BRL/USD exchange rate has moved substantially over the sample period (from ~2.3 in 2000 to ~5.0+ at points in the 2020s). The CAR computation uses BRL-denominated returns against a BRL benchmark, so within-study FX effects cancel, but USD-denominated investors will face additional variance.
The Q1 t-stat of -1.4 should be treated as a limitation, not a finding. We can't claim statistical evidence of miss-side drift in Brazil. The -0.94% figure is reported for completeness, but it shouldn't be the basis for a short-side strategy.
Part of a Series
- PEAD Across 14 Global Exchanges: The Drift Is Universal
- Earnings Surprise Drift on US Stocks: 170,000 Events, 26 Years
References
- Ball, R. & Brown, P. (1968). An empirical evaluation of accounting income numbers. Journal of Accounting Research.
- Bernard, V. & Thomas, J. (1989). Post-earnings-announcement drift: Delayed price response or risk premium? Journal of Accounting Research.
- Foster, G., Olsen, C. & Shevlin, T. (1984). Earnings releases, anomalies, and the behavior of security returns. The Accounting Review.
Run It Yourself
Explore the data behind this analysis on Ceta Research. Query our financial data warehouse with SQL, build custom screens, and run your own backtests across 70,000+ stocks on 20 exchanges.
Data: Ceta Research, FMP financial data warehouse


