
Earnings Surprise Drift in Taiwan: Big Misses, Big Drift

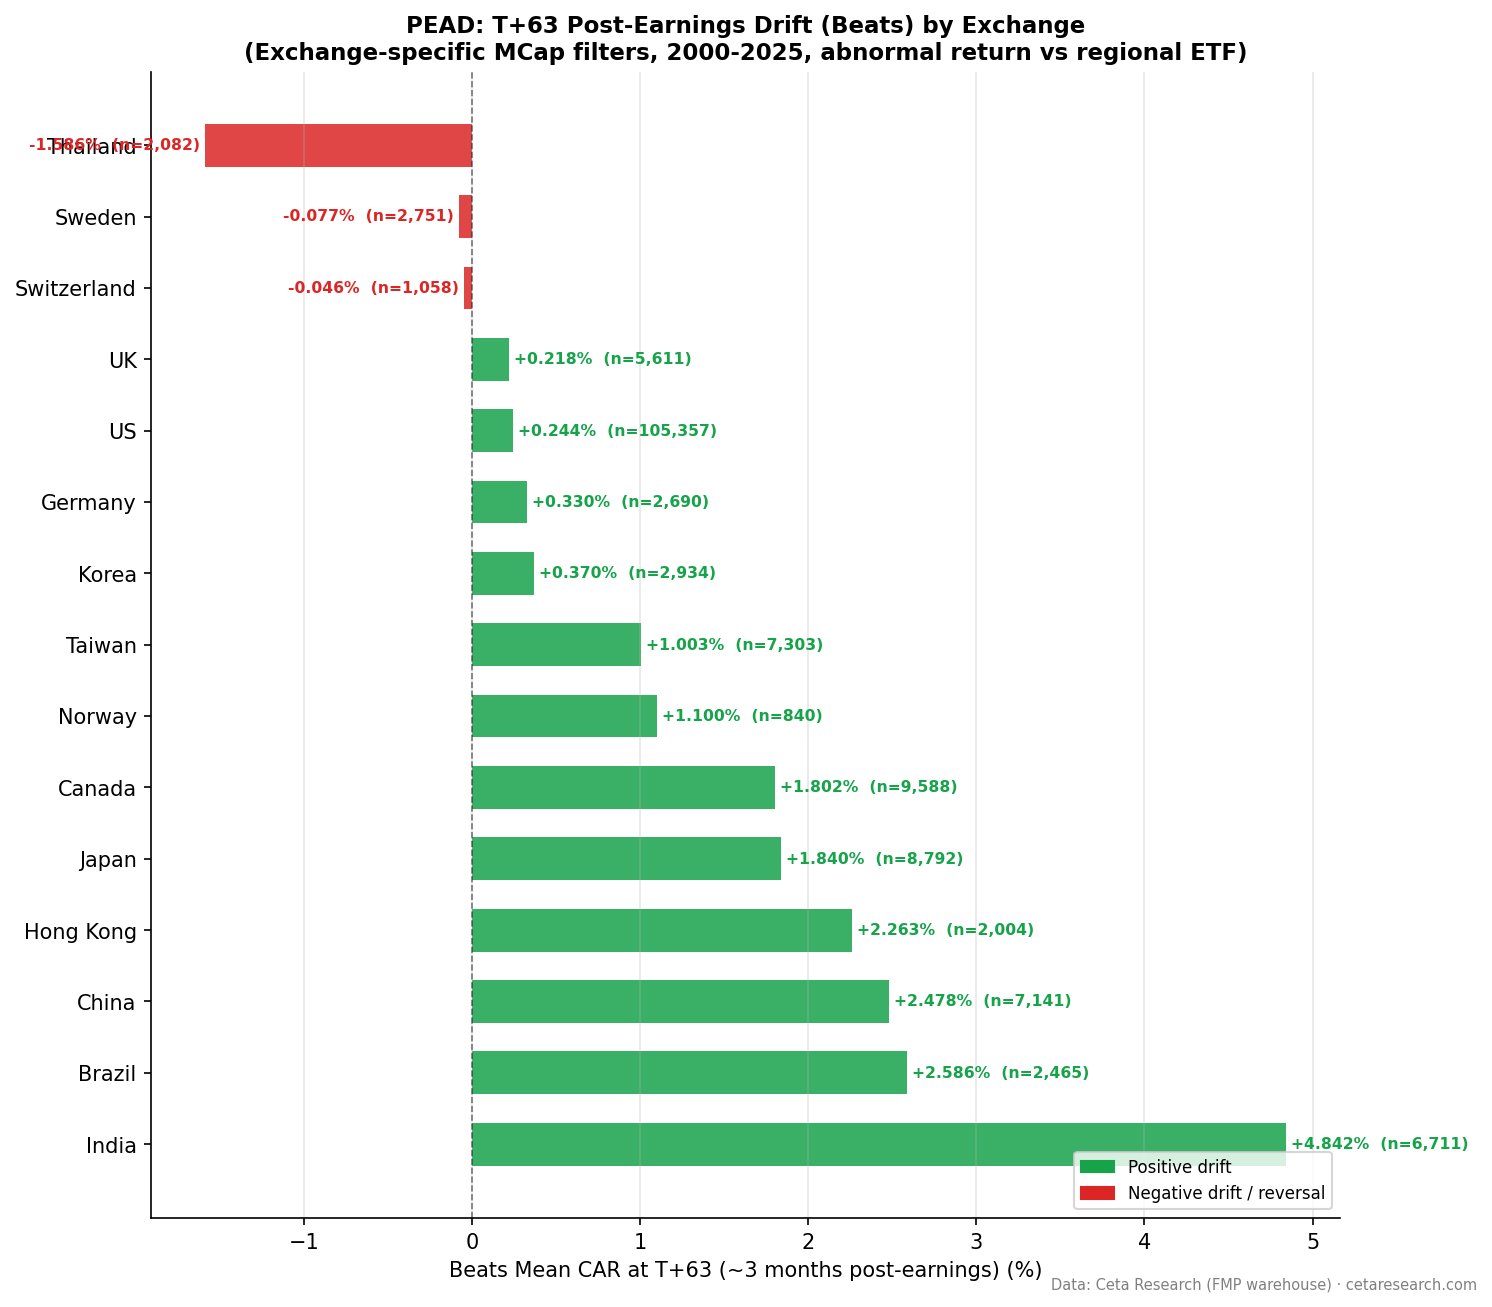
Taiwan's Q5-Q1 earnings drift spread of +5.47% at T+63 is the second-largest globally in our study. But the story here is driven by the miss side. Biggest misses produce -3.71% CAR at T+63 (t=-11.4). Biggest beats produce a more modest +1.76%. Taiwan's PEAD is structurally miss-dominated: if you want to exploit the signal, avoiding Q1 companies is the edge, not chasing Q5 beats.
Contents
- Method
- The Strategy
- What We Found
- Positive vs Negative Surprise Drift
- Quintile Analysis at T+63
- The Asymmetry in Context
- When It Works and When It Struggles
- Run It Yourself
- Limitations
- Part of a Series
- References
Method
| Parameter | Details |
|---|---|
| Data source | FMP earnings_surprises + stock_eod (Ceta Research warehouse) |
| Universe | TAI + TWO (Taiwan exchanges) — market cap threshold applied per exchange |
| Period | 2000–2025 (26 years) |
| Events | 16,696 total (deduplicated per symbol/date) |
| Benchmark | Equal-weighted TAI+TWO market return |
| Surprise metric | (epsActual − epsEstimated) / ABS(epsEstimated) |
| Windows | T+1, T+5, T+21, T+63 trading days |
The Strategy
Post-Earnings Announcement Drift (PEAD) documents that stocks continue drifting in the direction of their earnings surprise for weeks after announcement. Ball and Brown (1968) first established this pattern. Bernard and Thomas (1989) confirmed the drift persists for up to 60 trading days. Foster, Olsen, and Shevlin (1984) analyzed different earnings windows.
Taiwan's market has a heavy technology concentration, dominated by semiconductor and electronics manufacturers. Analyst coverage is meaningful, with a significant domestic sell-side community. The market's retail participation is high relative to most developed markets, which can affect how quickly information is priced in.
What We Found
Positive vs Negative Surprise Drift
| Direction | Events | Beat% | T+1 | T+5 | T+21 | T+63 |
|---|---|---|---|---|---|---|
| Positive surprises | 7,303 | 43.7% | +0.57% | +0.80% | +1.63% | +1.00% |
| Negative surprises | 9,393 | 56.3% | -0.54% | -1.05% | -0.70% | -2.38% |
Taiwan's beat rate is 43.7%: more companies miss than beat. The negative surprise drift is the dominant signal. Misses produce -2.38% at T+63, which is nearly 2.4x the magnitude of the positive surprise drift (+1.00%). The T+21 positive drift (+1.63%) actually exceeds the T+63 figure (+1.00%), suggesting some mean reversion in the beat drift after three weeks.
The negative drift pattern is unusual: -0.54% at T+1, -1.05% at T+5, then -0.70% at T+21, then -2.38% at T+63. The drift accelerates late. This is consistent with a market that partially prices in the miss immediately, stabilizes briefly, then resumes drifting as institutional investors reduce positions over the following months.
Quintile Analysis at T+63
| Quintile | Description | Events | CAR T+63 | t-stat | Hit Rate |
|---|---|---|---|---|---|
| Q5 | Biggest beats | 2,998 | +1.76% | +4.9 | 46.4% |
| Q4 | Moderate beats | — | +0.55% | — | — |
| Q3 | Near-consensus | — | -1.17% | — | — |
| Q2 | Moderate misses | — | -1.94% | — | — |
| Q1 | Worst misses | 3,042 | -3.71% | -11.4 | 33.0% |
The Q5-Q1 spread is +5.47% at T+63, the second-largest globally after India (+7.59%). Q1's t-stat of -11.4 is among the strongest in our global study. Q5 is significant (t=4.9) but less dominant.
The Q5 hit rate of 46.4% is below 50%. The median Q5 event in Taiwan produces a slightly negative outcome. The positive Q5 average (+1.76%) is carried by a subset of large positive outliers. This contrasts with Japan's Q5 hit rate of 56.6%, where the majority of big-beat events produce positive drift.
Q3 (near-consensus surprises) produces -1.17% at T+63, which is unusual. This further confirms a general downward bias in the Taiwan sample, likely reflecting a market where missing estimates is the norm and even "fair" results can disappoint.
The Asymmetry in Context
| Metric | Taiwan | Japan | India |
|---|---|---|---|
| Beat rate | 43.7% | 57.3% | 46.7% |
| Q5 CAR T+63 | +1.76% | +3.02% | +6.67% |
| Q1 CAR T+63 | -3.71% | -2.00% | -0.92% |
| Q5-Q1 spread | +5.47% | +5.01% | +7.59% |
Taiwan's miss-side dominance is clear relative to Japan and India. The Q1 miss magnitude (-3.71%) is nearly double Japan's Q1 (-2.00%) and far larger than India's Q1 (-0.92%). This makes Taiwan's spread more comparable to a negative screening signal than a long-short momentum signal.
When It Works and When It Struggles
Taiwan's technology concentration means earnings surprises often carry supply chain information. A semiconductor company missing estimates isn't just company-specific news. It can signal industry-wide demand weakness that takes time to propagate through analyst forecasts. This may explain the late-accelerating negative drift pattern.
The beat side is real but modest. Q5 beats (+1.76%) are statistically significant but the hit rate (46.4%) suggests below-median individual event outcomes. Long-only PEAD strategies in Taiwan face a tougher hit rate than in Japan or India.
Q1 miss avoidance (or shorting) is the cleaner signal. The Q1 t-stat of -11.4 is very high, the drift is strong (-3.71%), and the hit rate (33.0%) confirms most worst-miss events in Taiwan produce sustained negative drift.
Run It Yourself
python3 earnings-surprise/screen.py --preset taiwan
-- Recent earnings surprises on Taiwan exchanges
WITH deduped AS (
  SELECT
    es.symbol,
    es.date,
    es.epsActual,
    es.epsEstimated,
    (es.epsActual - es.epsEstimated) / NULLIF(ABS(es.epsEstimated), 0) AS std_surprise,
    ROW_NUMBER() OVER (PARTITION BY es.symbol, es.date ORDER BY es.lastUpdated DESC) AS rn
  FROM earnings_surprises es
  JOIN profile p ON es.symbol = p.symbol
  WHERE p.exchange IN ('TAI', 'TWO')
    AND p.isActivelyTrading = true
    AND es.date >= CURRENT_DATE - INTERVAL '90 days'
    AND ABS(es.epsEstimated) > 0.01
)
SELECT
  symbol,
  date,
  epsActual,
  epsEstimated,
  ROUND(std_surprise * 100, 1) AS surprise_pct
FROM deduped
WHERE rn = 1
  AND ABS(std_surprise) > 0.10
ORDER BY date DESC, std_surprise ASC
LIMIT 50
Run this query on Ceta Research →
Limitations
16,696 events provides solid statistical power, but the miss-heavy event distribution (9,393 negative vs 7,303 positive) means the quintiles aren't perfectly balanced. Q5 has 2,998 events vs Q1's 3,042.
Taiwan's heavy technology sector weighting means the results may be partially capturing sector dynamics rather than pure earnings surprise drift. A sector-controlled version of this analysis might show different quintile patterns.
The Q5 hit rate of 46.4% is worth emphasizing. Practitioners running a long-only Q5 strategy in Taiwan face a below-coin-flip probability of positive outcomes at the individual event level. The positive average is real but driven by tail events. Position sizing matters more here than in markets with stronger hit rates.
Part of a Series
- PEAD Across 14 Global Exchanges: The Drift Is Universal
- Earnings Surprise Drift on US Stocks: 170,000 Events, 26 Years
References
- Ball, R. & Brown, P. (1968). An empirical evaluation of accounting income numbers. Journal of Accounting Research.
- Bernard, V. & Thomas, J. (1989). Post-earnings-announcement drift: Delayed price response or risk premium? Journal of Accounting Research.
- Foster, G., Olsen, C. & Shevlin, T. (1984). Earnings releases, anomalies, and the behavior of security returns. The Accounting Review.
Run It Yourself
Explore the data behind this analysis on Ceta Research. Query our financial data warehouse with SQL, build custom screens, and run your own backtests across 70,000+ stocks on 20 exchanges.
Data: Ceta Research, FMP financial data warehouse


