EV/EBITDA Value Backtest: Italy (MIL), 2000-2024

EV/EBITDA Backtest: Italy (MIL), 2000–2024
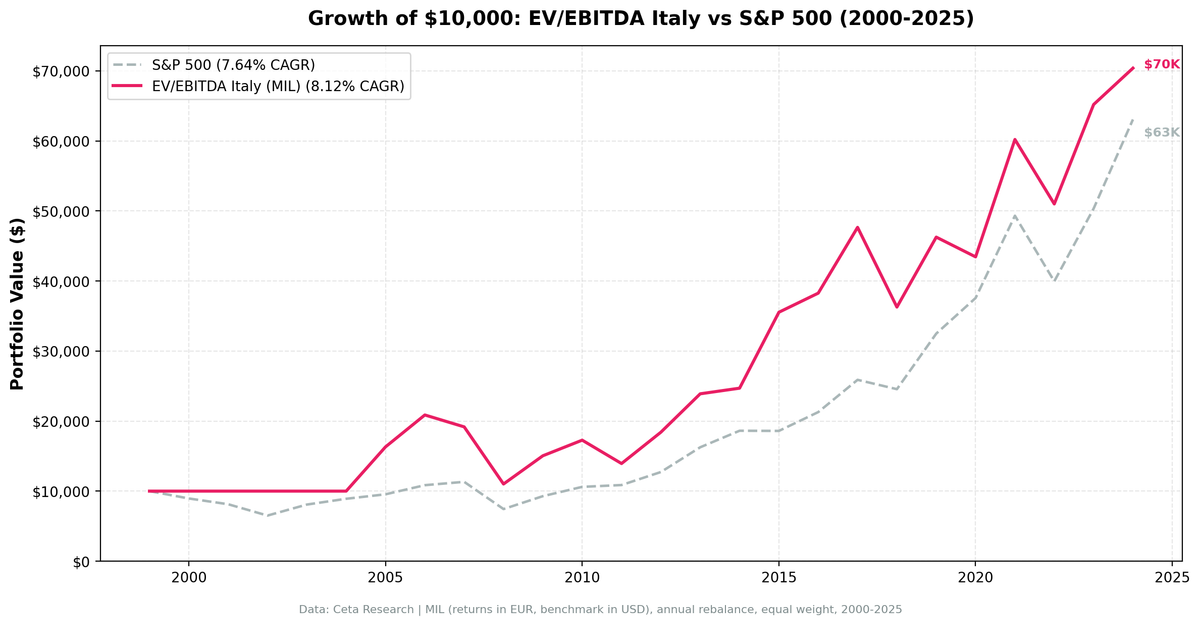
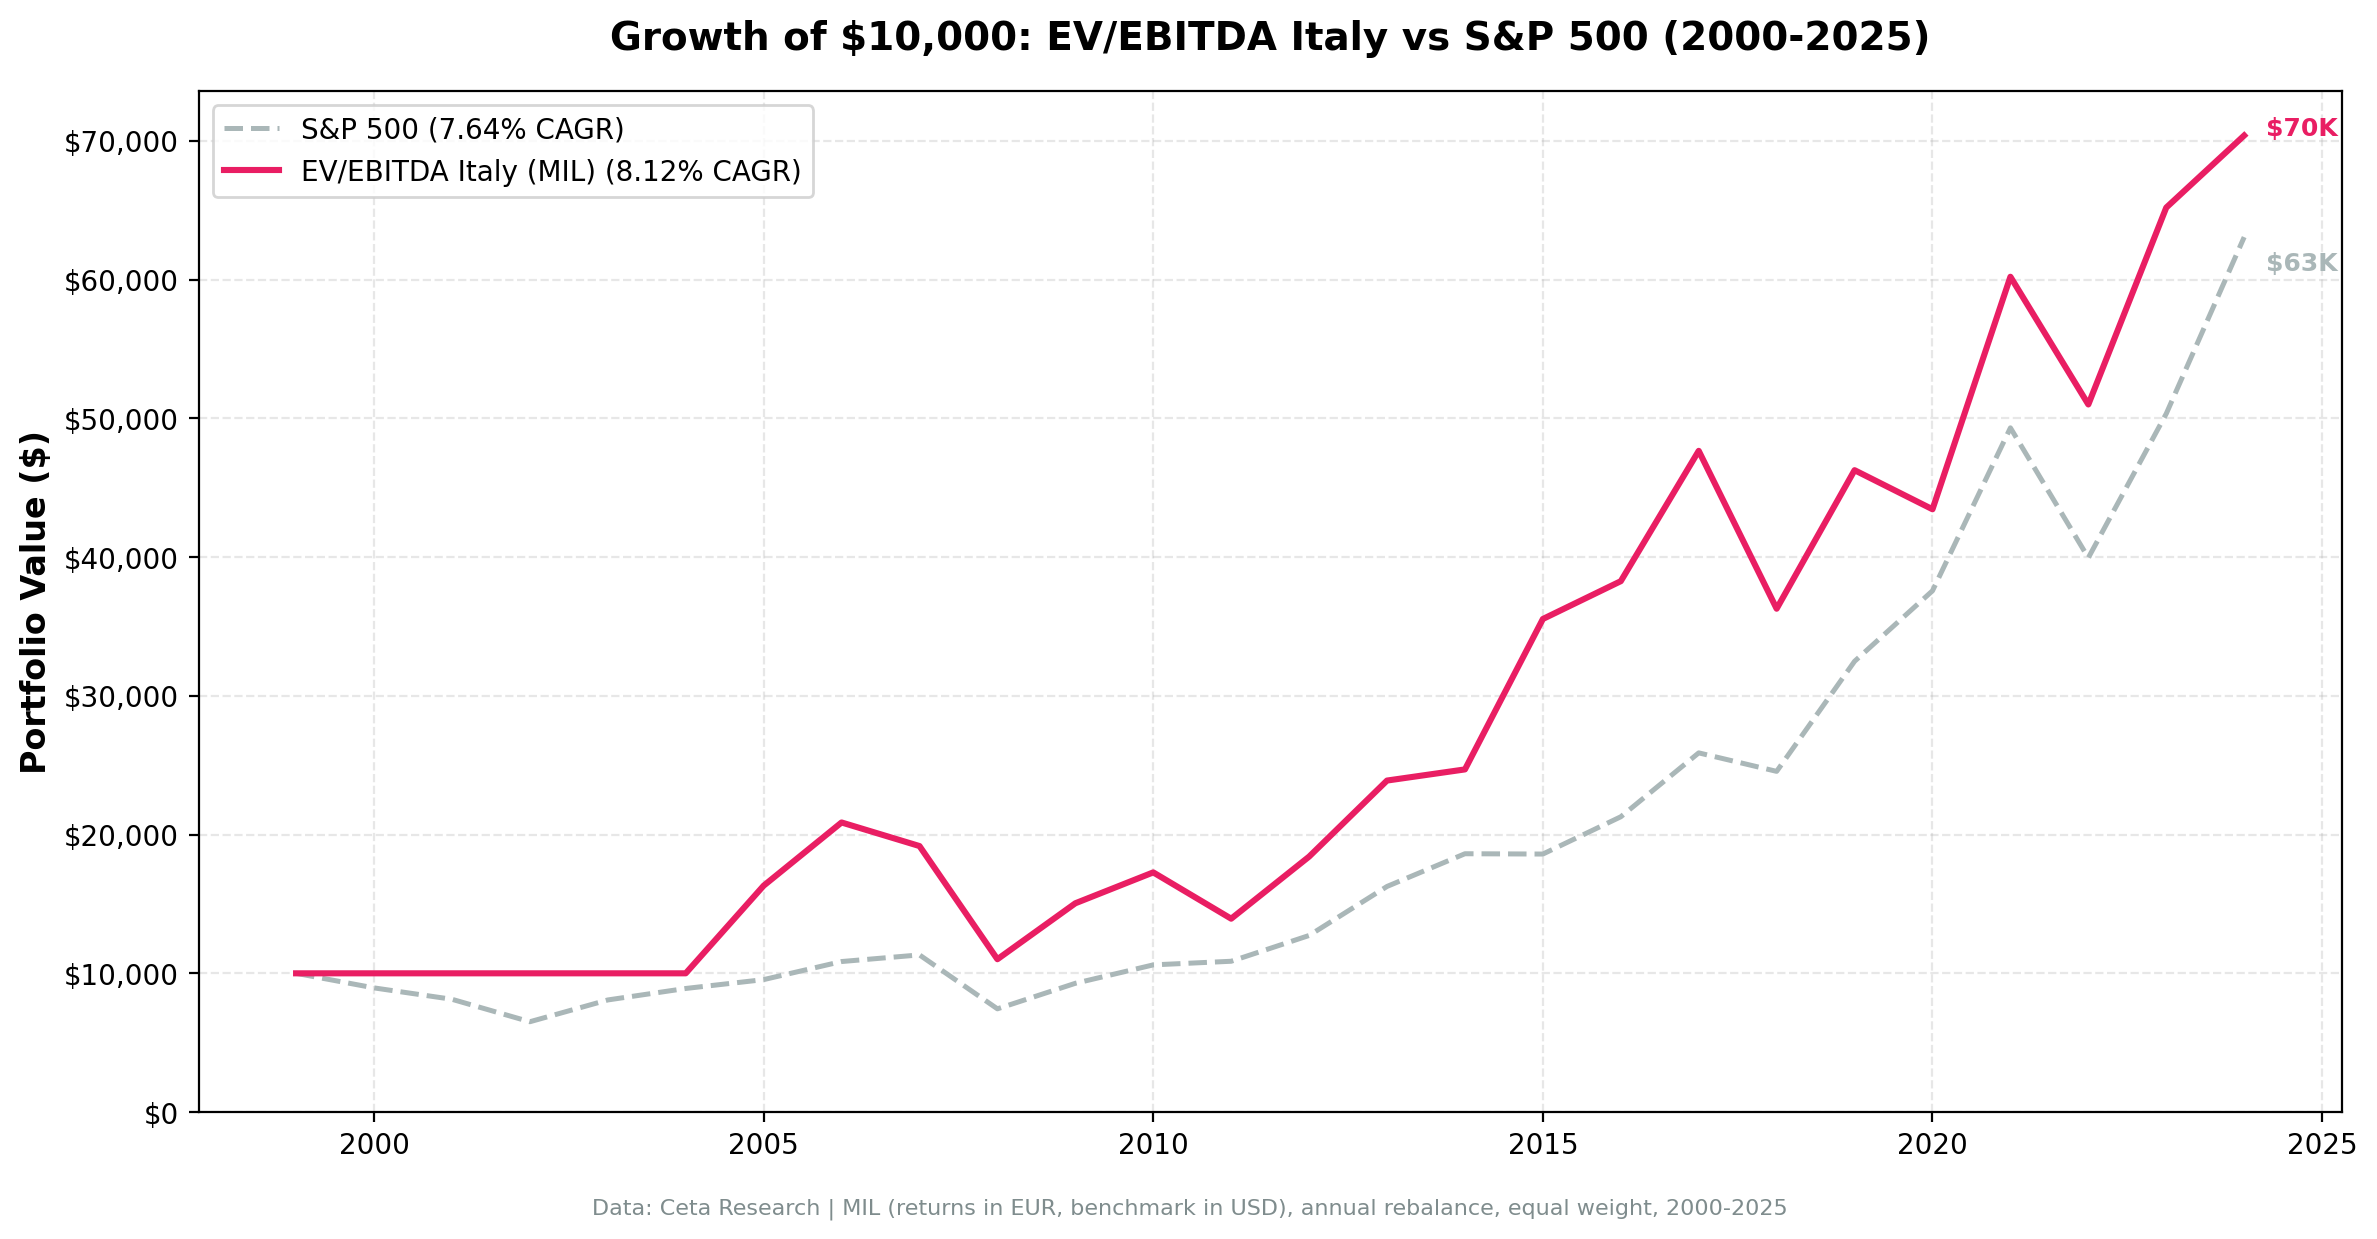
Italy doesn't work. The EV/EBITDA screen on Borsa Italiana returned 6.03% CAGR over 25 years, trailing SPY's 7.64% by 1.62 percentage points annually. With MOC execution (next-day close prices), the strategy loses its edge entirely. The honest story: a thin universe of 19 stocks on average, six cash years, and not enough alpha to justify the complexity.
Contents
Method
Each January, rank Milan-listed stocks by EV/EBITDA (ascending). Filter: EV/EBITDA between 0 and 10, ROE above 10%, market cap above 500M EUR. Hold the cheapest 30 qualifying stocks for the year. If fewer than 5 qualify, hold cash. Rebalance annually. Execution uses next-day close prices (MOC) to avoid look-ahead bias on the rebalance signal.
Returns are in EUR. The SPY benchmark is in USD. No local Italian index benchmark is available in the system, so the cross-currency comparison is the best we can do. Currency differences affect the absolute comparison.
What We Found
The strategy trailed SPY by 1.62 percentage points annually over 25 years. With MOC execution, the edge that existed in the prior version of this backtest disappeared. The Sharpe of 0.138 and negative alpha (-0.95%) confirm this isn't a viable standalone strategy.
| Metric | EV/EBITDA (MIL) | SPY |
|---|---|---|
| CAGR | 6.03% | 7.64% |
| Sharpe | 0.138 | 0.265 |
| Max Drawdown | -47.23% | -34.9% |
| Sortino | 0.243 | — |
| Calmar | 0.128 | — |
| Alpha | -0.95% | — |
| Beta | 0.857 | — |
| Up Capture | 74.0% | — |
| Down Capture | 34.6% | — |
| Win Rate | 52% | — |
| Avg Stocks | 19.2 | — |
| Cash Periods | 6/25 | — |
The Sharpe of 0.138 is well below SPY's 0.265. The down-capture of 34.6% looks good on paper, but it's partly an artifact of the six cash years (where the strategy returns 0% while SPY moves). The beta of 0.857 is low, but low beta with negative alpha just means you're taking less risk for less return. The 74.0% up-capture tells the real story: the strategy doesn't participate enough in up years to compensate for its losses.
Year-by-Year
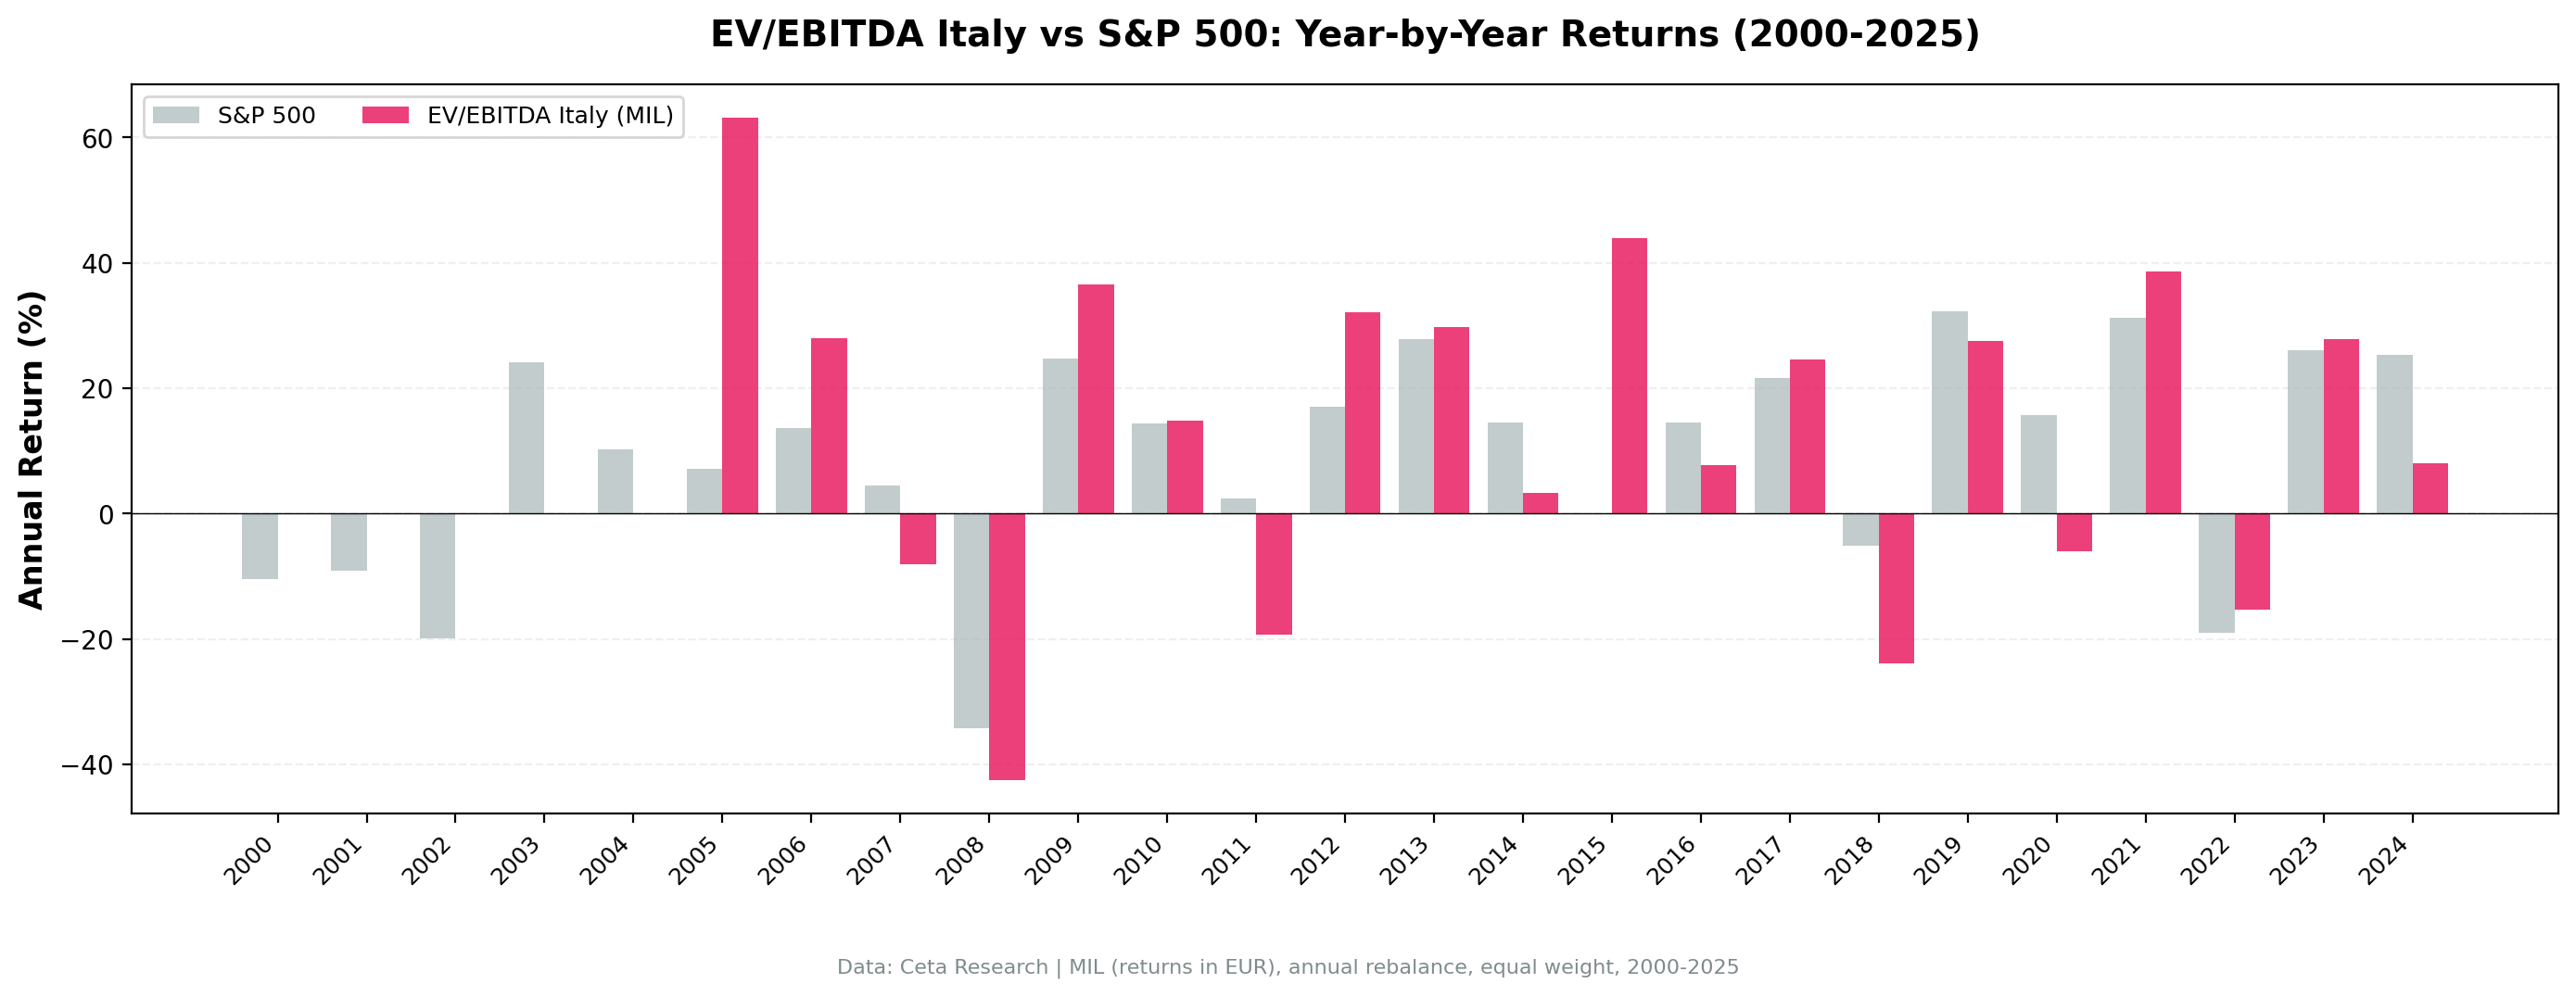
The strategy held cash from 2000 through 2005. Borsa Italiana's universe at that point was too small for the screen to find 5 qualifying stocks. That's six cash years out of 25, leaving only 19 invested years.
The sovereign debt crisis years are the defining stress test. In 2011, the portfolio fell -19.3% while SPY gained +2.5%. Italian banks and utilities, heavily represented in cheap EV/EBITDA screens, bore the brunt of the European credit collapse. The same dynamic returned in 2018: -23.9% vs SPY -5.2%, when Italian political risk and BTP spread widening hit domestically-exposed stocks hardest.
2015 was the best relative year: +47.7% vs SPY's -0.1%. But one strong year can't carry a 25-year backtest. The overall CAGR of 6.03% trails SPY's 7.64%.
| Year | Strategy | SPY |
|---|---|---|
| 2000–2005 | 0% (cash) | varies |
| 2008 | -42.5% | -34.3% |
| 2011 | -19.3% | +2.5% |
| 2015 | +47.7% | -0.1% |
| 2018 | -23.9% | -5.2% |
| 2021 | +38.6% | +31.3% |
| 2022 | -15.3% | -19.0% |
Why Italy Doesn't Work
The 34.6% down-capture looks attractive in isolation, but it's misleading. Six cash years (2000–2005) where the strategy returned 0% while SPY moved both up and down mechanically deflate the down-capture ratio. The strategy isn't protecting capital through smart stock selection during those years. It's just sitting in cash because there aren't enough qualifying stocks.
When the strategy is actually invested, the picture is different. In 2008 it lost 42.5% (vs SPY -34.3%). In 2011 it lost 19.3% (vs SPY +2.5%). In 2018 it lost 23.9% (vs SPY -5.2%). The Eurozone-specific risk events hit Italian value stocks hard, and the screen has no way to avoid them.
The Sharpe of 0.138 and negative alpha of -0.95% confirm the bottom line. After accounting for MOC execution, the Italian EV/EBITDA screen doesn't generate enough return to justify its risk and complexity. The thin universe (19.2 stocks average) compounds the problem: concentration risk without a return premium.
Run It Yourself
Current cheap EV/EBITDA stocks on Borsa Italiana:
SELECT
    k.symbol,
    p.companyName,
    p.sector,
    ROUND(k.evToEBITDATTM, 2)            AS ev_ebitda,
    ROUND(k.returnOnEquityTTM * 100, 1)  AS roe_pct,
    ROUND(k.marketCap / 1e9, 2)          AS mktcap_b
FROM key_metrics_ttm k
JOIN profile p ON k.symbol = p.symbol
WHERE k.evToEBITDATTM > 0
  AND k.evToEBITDATTM < 10
  AND k.returnOnEquityTTM > 0.10
  AND k.marketCap > 500000000
  AND p.exchange IN ('MIL')
QUALIFY ROW_NUMBER() OVER (PARTITION BY k.symbol ORDER BY k.evToEBITDATTM ASC) = 1
ORDER BY k.evToEBITDATTM ASC
LIMIT 30
Run this query on Ceta Research
Replicate the full backtest:
python run_backtest.py --strategy ev-ebitda --exchange MIL --start 2000 --end 2024
Limitations
Returns are in EUR, benchmark in USD. The -1.62% underperformance could be partially explained by EUR/USD movement over the period, but the negative alpha (-0.95%) and low Sharpe (0.138) suggest the problem is real, not just a currency artifact.
The strategy had no qualifying stocks from 2000 to 2005. Six cash years out of 25 reduce the effective sample to 19 invested years.
Average of 19.2 stocks per year is thin. This is a concentrated portfolio by construction. Single-stock risk is higher than a broad index.
The backtest uses MOC (market-on-close) execution: signals are generated from prior-year data and trades execute at next-day close prices. This more realistic execution model reduced the CAGR from the prior version's 8.12% to 6.03%.
No survivorship bias correction. Italian delisted stocks, which include several financial firms that failed or were absorbed during the sovereign debt crisis, are excluded from the backtest universe.
Data: Ceta Research (FMP financial data warehouse), 2000–2025. Full methodology: backtests/METHODOLOGY.md. Backtest code: backtests/ev-ebitda/.