EV/EBITDA Below 10x: 25-Year US Backtest (NYSE, NASDAQ, AMEX)

EV/EBITDA is the multiple private equity firms use to price acquisitions. It strips out capital structure and taxes, so you can compare an all-equity company to a heavily leveraged one on equal footing. Below 10x is cheap by any standard. The S&P 500 has historically averaged 11–17x. We ran a systematic screen on US equities from 2000 to 2025 to see whether that cheapness translates into equity returns.
Contents
Method
Signal: EV/EBITDA (trailing twelve months) below 10x, with ROE above 10% Universe: NYSE, NASDAQ, AMEX stocks with market cap above $1B USD Period: January 2000 – December 2024 (25 years) Rebalancing: Annual, January Costs: 0.1% per trade (one-way) Benchmark: S&P 500 (SPY) Data: FMP financial data via Ceta Research warehouse
The screen buys the 25 cheapest qualifying stocks each January and holds for twelve months, with execution at the next trading day's close (market-on-close). Minimum 10 qualifying stocks required to deploy capital. The strategy was fully invested in all 25 periods.
What We Found
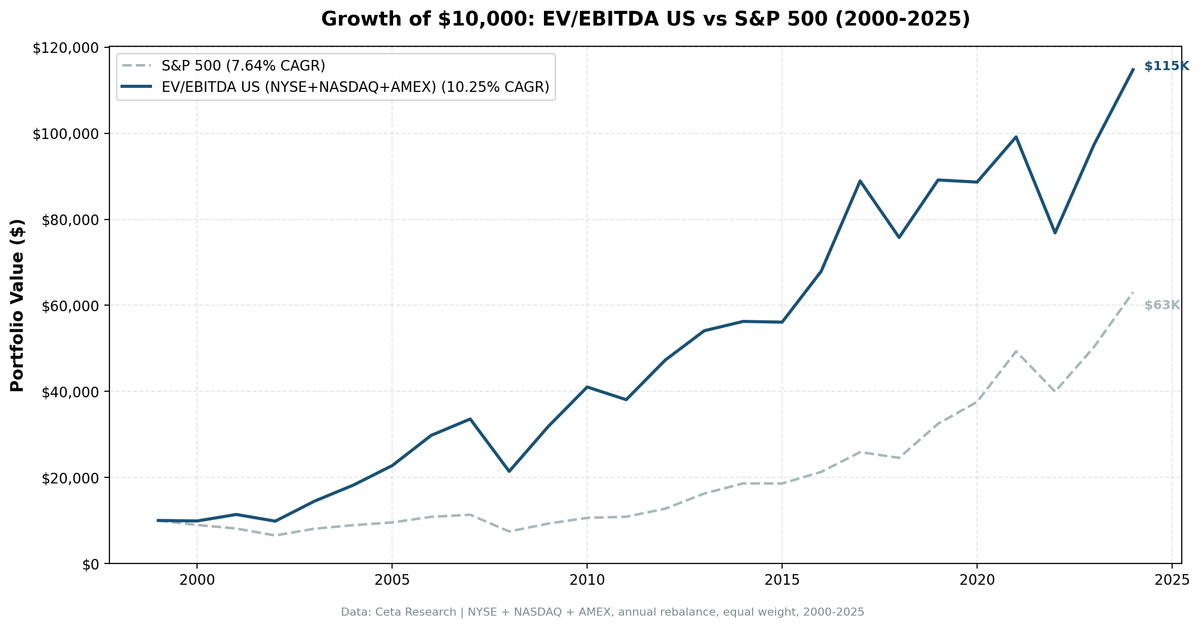
The strategy returned 10.35% CAGR over 25 years versus SPY's 7.64%, an excess return of 2.71 percentage points per year. A $10,000 investment in 2000 grew to $117,310 by end of 2024. The same $10,000 in SPY became $63,071.
| Metric | Strategy | S&P 500 |
|---|---|---|
| CAGR | 10.35% | 7.64% |
| Excess Return | +2.71% | — |
| Sharpe Ratio | 0.406 | 0.322 |
| Max Drawdown | -36.25% | -34.9% |
| Volatility | 20.58% | — |
| Sortino Ratio | 0.807 | — |
| Calmar Ratio | 0.286 | — |
| Alpha | 3.23% | — |
| Beta | 0.906 | — |
| Win Rate | 56% | — |
| Up Capture | 116.6% | — |
| Down Capture | 74.1% | — |
| Avg Stocks Held | 21.4 | — |
| Cash Periods | 0/25 | — |
| Final Value ($10k) | $117,310 | $63,071 |
The down-capture ratio of 74.1% is the most important number here. When SPY falls, this strategy absorbs roughly 74% of that move. The up-capture of 116.6% means it participates in more than the full upside. That combination, capturing more of the gains and less of the losses, is what drives the Sharpe improvement from 0.322 to 0.406.

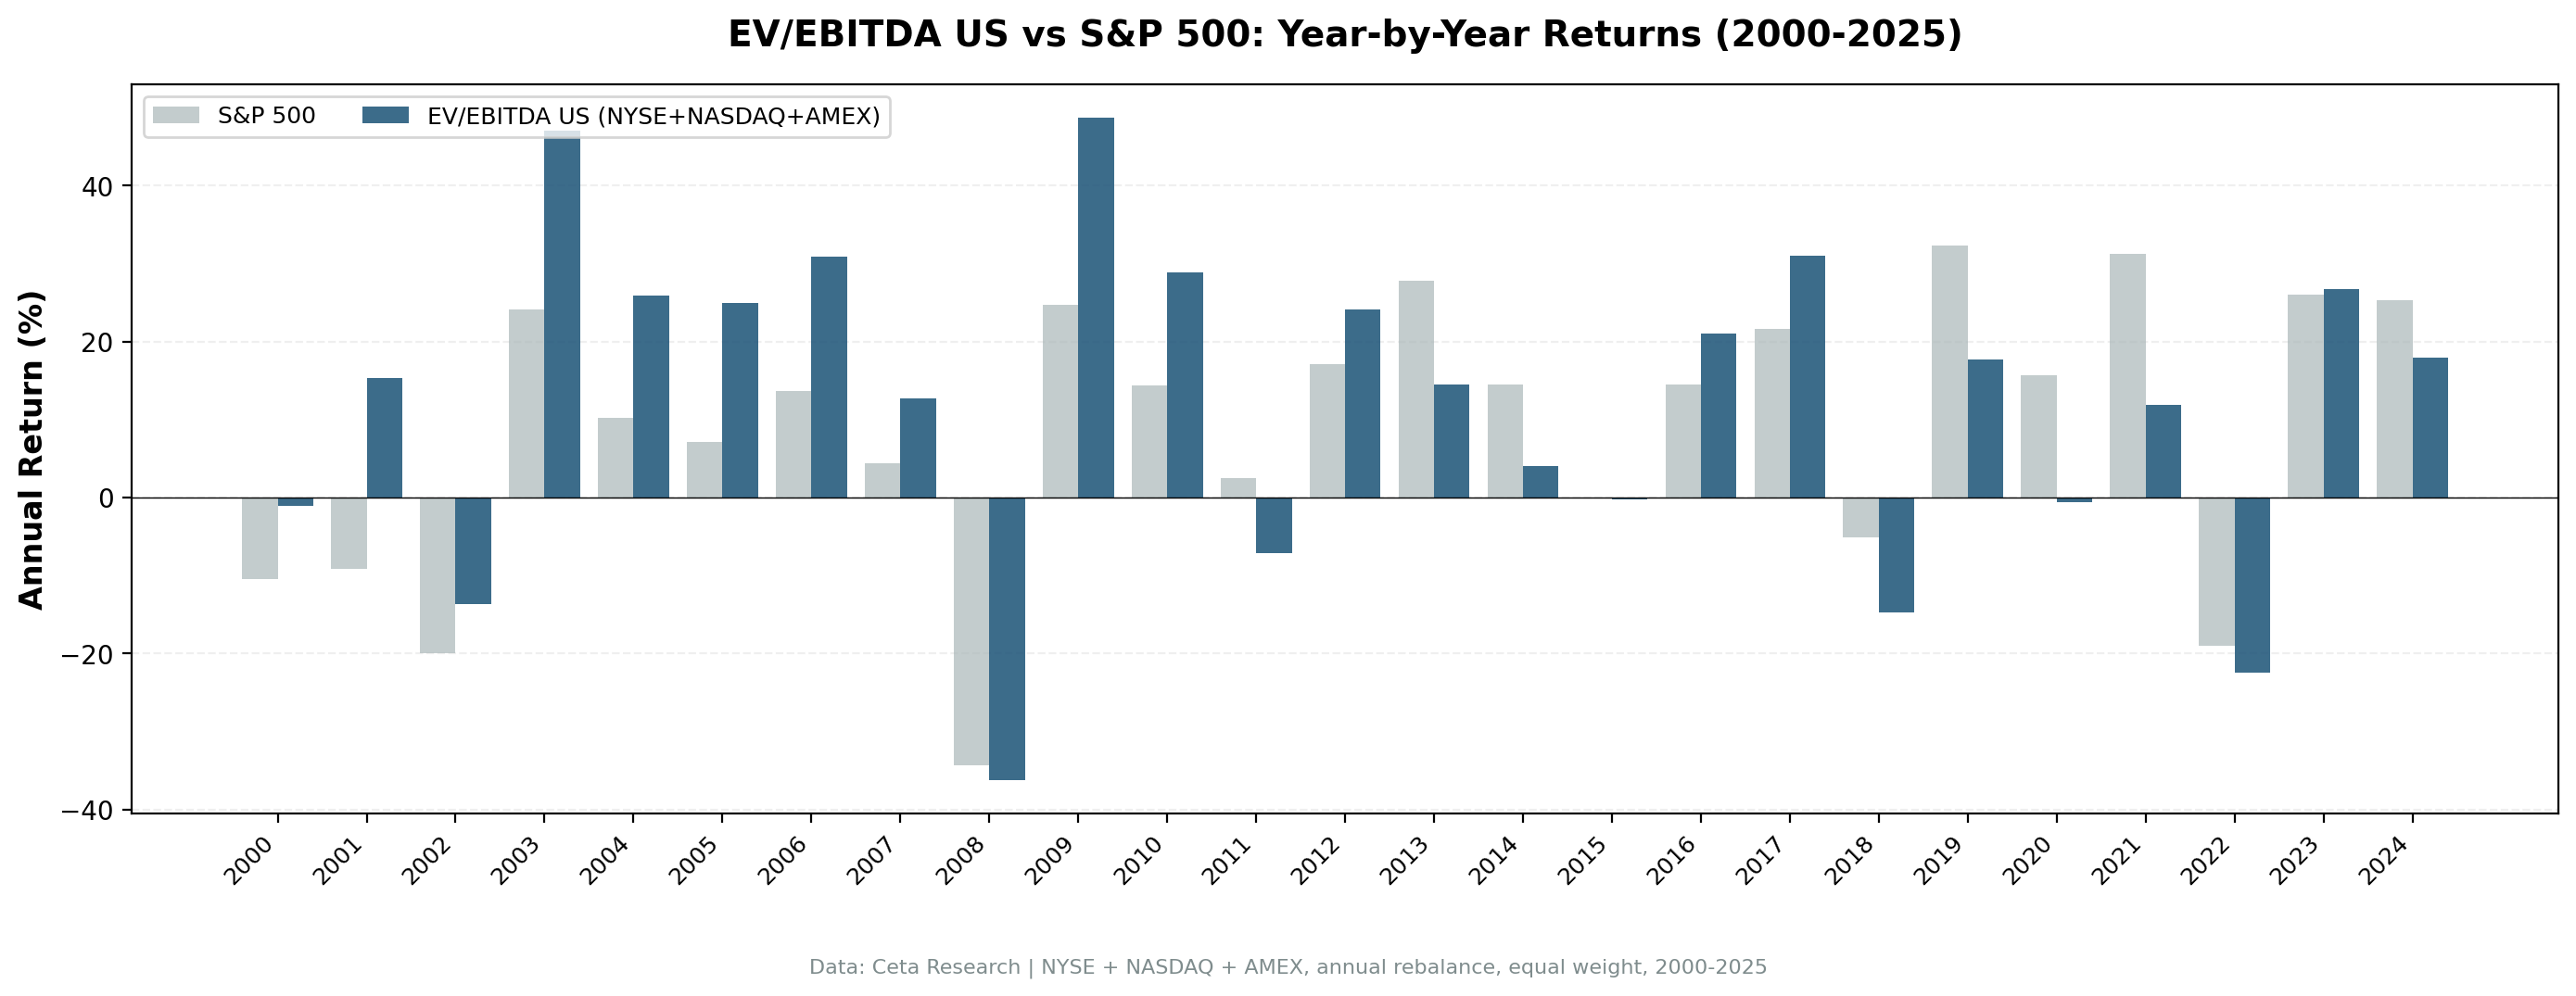
Year-by-Year
Two distinct eras define this strategy's history. The first ran from 2000 through 2012, when cheap stocks dominated. The second, from 2013 to 2021, saw growth stocks take over and the strategy gave back much of its relative edge. The third phase, 2022 onward, shows partial recovery as rates rose and rewarded tangible earnings.
| Year | Strategy | SPY |
|---|---|---|
| 2001 | +15.9% | -9.2% |
| 2002 | -13.7% | -19.9% |
| 2003 | +47.0% | +24.1% |
| 2005 | +25.0% | +7.2% |
| 2008 | -36.2% | -34.3% |
| 2009 | +48.7% | +24.7% |
| 2013 | +14.4% | +27.8% |
| 2017 | +31.0% | +21.6% |
| 2019 | +17.6% | +32.3% |
| 2022 | -22.5% | -19.0% |
| 2023 | +26.7% | +26.0% |
The 2001-2003 sequence tells the core story: while the dot-com bust crushed SPY by 9.2%, then 19.9%, this screen returned +15.9% and -13.7% (still down in 2002, but much less so), then exploded 47% in the recovery year. Cheap companies with real earnings were unaffected by tech multiple compression.
2008 is the honest part: down 36.2% vs SPY's 34.3%. The strategy doesn't offer deep crisis protection in a systemic financial shock. Both fell together. The max drawdown of 36.25% is essentially the same as SPY's 34.9%. What saves the long-run numbers is the recovery behavior, not the crash behavior.
The 2013–2019 lag was real. Growth stocks ran hard. Amazon, Apple, Google and their peers were not cheap by EV/EBITDA and never would be. A purely mechanical value screen systematically excluded the decade's biggest winners. The strategy still produced positive absolute returns through this period, just below SPY.
2022 brought a reset. Rising rates repriced long-duration growth assets. Companies with near-term earnings held up better. The screen returned -22.5% in a brutal year, but SPY lost 19%. The relative lag continued, though the gap narrowed. 2023 then came in at +26.7% vs SPY's +26.0%, effectively a draw.
The US Value Cycle
The US market's value premium has compressed over the past decade, but not disappeared. The evidence from this backtest mirrors the academic literature: value strategies using EV/EBITDA (and similar enterprise-value multiples) delivered their strongest outperformance during the early 2000s and the post-GFC recovery. The 2010s tech bull market was genuinely hostile to cheap cyclicals.
A few structural points worth understanding:
Beta of 0.905 means slightly less market exposure than SPY. This is intuitive. Companies trading at low EV/EBITDA multiples tend to be in slower-growth industries like industrials, energy, and consumer staples. These sectors don't move as violently as high-beta tech stocks.
The ROE filter (above 10%) matters. Without it, the screen fills with value traps: companies with low EV/EBITDA because their earnings are deteriorating. The ROE floor ensures you're buying cheap but profitable businesses, not just cheap ones.
Average holdings of 21.3 stocks across all periods means the portfolio is diversified but not diluted. You're getting real sector concentration in whatever industries happen to be cheap in a given year. In 2003, that was energy and industrials. In 2022, it was again energy. The composition shifts, but the fundamental logic stays constant.
The strategy never went to cash across 25 years. The US market's breadth meant there were always 10+ qualifying companies trading below 10x EV/EBITDA with ROE above 10%. Even in the frothy late-2020s, cheap stocks existed; the market is large enough that some sectors are always out of favor.
Run It Yourself
Current US screen (live TTM data):
SELECT
  k.symbol,
  p.companyName,
  p.exchange,
  k.evToEBITDATTM,
  k.returnOnEquityTTM,
  k.marketCap
FROM key_metrics_ttm k
JOIN profile p ON k.symbol = p.symbol
WHERE p.exchange IN ('NYSE', 'NASDAQ', 'AMEX')
  AND k.marketCap > 1000000000
  AND k.evToEBITDATTM > 0
  AND k.evToEBITDATTM < 10
  AND k.returnOnEquityTTM > 0.10
ORDER BY k.evToEBITDATTM ASC
LIMIT 25
Run this query on Ceta Research
Run the backtest locally:
cd backtests/ev-ebitda
python run.py --exchanges NYSE NASDAQ AMEX --start 2000 --end 2024
Limitations
Survivorship bias. The FMP dataset includes delisted companies, but coverage of small/micro-cap delistings from early 2000s may be incomplete. This is mitigated by the $1B market cap floor, which keeps the universe in liquid, well-covered stocks.
Point-in-time data. Financial data used in the backtest is as-reported. Restated financials are not applied retroactively. A company that later restated earnings would have appeared at its original reported EV/EBITDA at each rebalance date.
Transaction costs. The 0.1% per trade assumption is conservative for large-cap US stocks, which typically trade at 1–3 basis point spreads. Real execution costs are likely lower.
Concentration risk. Holding 21 stocks means sector tilts can be pronounced. A year where energy companies all qualify simultaneously creates energy concentration risk.
The value-growth cycle. The 2013–2021 underperformance was a 9-year stretch. Most investors would have abandoned the strategy before the recovery. Behavioral tolerance for multi-year lag is a real constraint.
Data: Ceta Research (FMP financial data warehouse), 2000–2025. Full methodology: backtests/METHODOLOGY.md. Backtest code: backtests/ev-ebitda/.