
FCF Growth in Canada: 8.98% CAGR and the Best Alpha in a 13-Market Study
Canada FCF growth stocks produced 8.98% CAGR over 25 years, beating the TSX Composite by 5.03 percentage points per year. 21.2% down capture means the portfolio absorbed only a fifth of the TSX downside in down years.

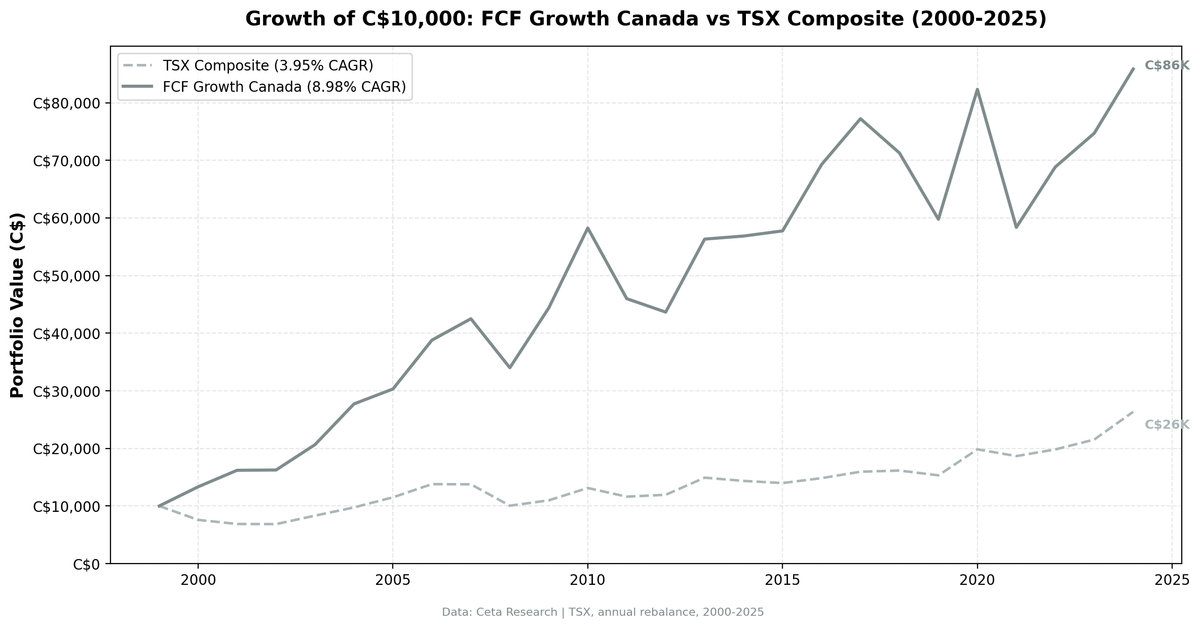
The FCF growth screen in Canada produced 8.98% annualized returns from 2000 to 2025, beating the TSX Composite by 5.03 percentage points per year. C$10,000 grew to C$85,857. The portfolio absorbed only 21.2% of the TSX Composite's downside in down years while capturing 134% of the upside.
Contents
- Method
- The Screen
- Simple Screen
- Advanced Screen
- Results
- When It Works
- When It Fails
- The 2008 Result
- Annual Returns
- Limitations
- Global Context
- Run It Yourself
Data: FMP financial data warehouse (TSX), 2000–2025. Returns in CAD. Updated August 2026.
Method
The strategy screens for TSX-listed stocks with accelerating free cash flow. FCF must grow by more than 15% year-over-year, and operating cash flow must also grow. That second condition prevents false positives where a company cuts capex to inflate FCF without growing the underlying business.
Quality filters keep the portfolio in profitable, moderately leveraged companies: ROE above 10% and debt-to-equity below 1.5. The top 30 stocks by FCF growth rate get equal-weighted and held for a year.
| Parameter | Setting |
|---|---|
| Universe | TSX (Toronto Stock Exchange) |
| Market cap | >C$500M |
| Signal | FCF growth YoY >15%, OCF growth YoY >0% |
| Quality | ROE >10%, D/E <1.5 |
| Selection | Top 30 by FCF growth, equal weight |
| Cash rule | Hold cash if <10 qualify |
| Rebalancing | Annual (July), 45-day data lag |
| Execution | MOC (next-day close after rebalance signal) |
| Costs | Size-tiered transaction costs |
| Benchmark | S&P/TSX Composite (^GSPTSE, price index) |
| Period | 2000–2025 (25 periods) |
| Currency | CAD (both portfolio and benchmark) |
| Code | github.com/ceta-research/backtests |
The 45-day lag ensures that annual filings are publicly available before they enter the screen. A fiscal year-end in May doesn't enter the July rebalance until statements are filed. Entry and exit prices use the next trading day's close (MOC execution).
One convention to note before reading any annual figure below. Each period runs July to July and is labelled by the year it begins, so "2008" means July 2008 through July 2009, not the calendar year. Period returns therefore won't match calendar-year figures you may have seen elsewhere. Portfolio and benchmark are measured over identical windows, so excess returns are consistent.
The market cap threshold of C$500M, roughly $360M USD, filters out small-caps where liquidity becomes a constraint for most portfolios. The TSX has fewer listed companies than US exchanges, so a lower threshold than the US $1B makes sense. The live screens below use a higher C$750M floor.
The academic grounding comes from Sloan (1996), who showed that cash-backed earnings outperform accrual-heavy earnings. Companies that report cash generation tend to continue generating cash. This screen isolates companies where cash generation is accelerating.
The Screen
Simple Screen
Ranks TSX-listed stocks by year-over-year FCF growth with a 15% minimum threshold and C$750M market cap floor. Run it: cetaresearch.com/data-explorer?q=j8-47BGKfY
WITH cf AS (
    SELECT symbol, freeCashFlow AS fcf, reportedCurrency,
        ROW_NUMBER() OVER (PARTITION BY symbol ORDER BY dateEpoch DESC) AS rn
    FROM cash_flow_statement WHERE period = 'FY'
)
SELECT cc.symbol, p.companyName,
    ROUND((cc.fcf - cp.fcf) / ABS(cp.fcf) * 100, 1) AS fcf_growth_pct,
    ROUND(cc.fcf / 1000000, 1) AS fcf_m,
    ROUND(p.marketCap / 1000000000, 2) AS mktcap_bn
FROM cf cc
JOIN cf cp ON cc.symbol = cp.symbol AND cp.rn = 2
JOIN profile p ON cc.symbol = p.symbol
WHERE cc.rn = 1
  AND cc.fcf > 0 AND cp.fcf > 0
  AND (cc.fcf - cp.fcf) / ABS(cp.fcf) > 0.15
  AND p.marketCap > 750000000
  AND p.exchange = 'TSX'
  -- data-quality guards
  AND p.isFund = false AND p.isEtf = false AND p.isActivelyTrading = true
  AND cc.reportedCurrency = p.currency
  AND p.industry <> 'Asset Management'
  AND cc.fcf < p.marketCap
  AND cp.fcf >= 0.002 * p.marketCap
QUALIFY ROW_NUMBER() OVER (PARTITION BY COALESCE(p.cik, p.symbol)
                           ORDER BY p.averageVolume DESC) = 1
ORDER BY fcf_growth_pct DESC
LIMIT 30
Advanced Screen
Adds the capex-cut guard (OCF must also grow), ROE quality filter, and leverage check. cetaresearch.com/data-explorer?q=wRm8hnX0OG
WITH cf AS (
    SELECT symbol, freeCashFlow AS fcf, operatingCashFlow AS ocf, reportedCurrency,
        ROW_NUMBER() OVER (PARTITION BY symbol ORDER BY dateEpoch DESC) AS rn
    FROM cash_flow_statement WHERE period = 'FY'
)
SELECT cc.symbol, p.companyName,
    ROUND((cc.fcf - cp.fcf) / ABS(cp.fcf) * 100, 1) AS fcf_growth_pct,
    ROUND((cc.ocf - cp.ocf) / ABS(cp.ocf) * 100, 1) AS ocf_growth_pct,
    ROUND(k.returnOnEquityTTM * 100, 1) AS roe_pct,
    ROUND(f.debtToEquityRatioTTM, 2) AS debt_equity,
    ROUND(p.marketCap / 1000000000, 2) AS mktcap_bn
FROM cf cc
JOIN cf cp ON cc.symbol = cp.symbol AND cp.rn = 2
JOIN key_metrics_ttm k ON cc.symbol = k.symbol
JOIN financial_ratios_ttm f ON cc.symbol = f.symbol
JOIN profile p ON cc.symbol = p.symbol
WHERE cc.rn = 1
  AND cc.fcf > 0 AND cp.fcf > 0
  AND (cc.fcf - cp.fcf) / ABS(cp.fcf) > 0.15
  AND (cc.ocf - cp.ocf) / ABS(cp.ocf) > 0.0
  AND k.returnOnEquityTTM > 0.10
  AND f.debtToEquityRatioTTM < 1.5
  AND p.marketCap > 750000000
  AND p.exchange = 'TSX'
  -- data-quality guards
  AND p.isFund = false AND p.isEtf = false AND p.isActivelyTrading = true
  AND cc.reportedCurrency = p.currency
  AND p.industry <> 'Asset Management'
  AND cc.fcf < p.marketCap
  AND cp.fcf >= 0.002 * p.marketCap
QUALIFY ROW_NUMBER() OVER (PARTITION BY COALESCE(p.cik, p.symbol)
                           ORDER BY p.averageVolume DESC) = 1
ORDER BY fcf_growth_pct DESC
LIMIT 30
Reading the output. Growth rate is a ratio, so the top of both lists is companies rebounding off a small prior-year base rather than the largest cash generators. The 0.2%-of-market-cap floor on last year's free cash flow keeps the millions-of-percent cases out, but a company going from $2M to $85M of free cash flow still outranks one going from $2B to $3B. That's the strategy as specified rather than a data problem: the backtest ranks by the same rate and buys the same names. Sort by the FCF column when you want scale rather than rate.
Results
| Metric | FCF Growth | TSX Composite |
|---|---|---|
| CAGR | 8.98% | 3.95% |
| Total Return | 758.57% | 163.55% |
| Max Drawdown | -29.11% | -31.44% |
| Volatility | 19.29% | — |
| Sharpe | 0.336 | — |
| Sortino | 0.638 | — |
| Beta | 0.780 | 1.00 |
| Up Capture | 133.9% | — |
| Down Capture | 21.2% | — |
| Win Rate vs TSX | 68% (17/25 years) | — |
| C$10,000 grew to | C$85,857 | C$26,355 |
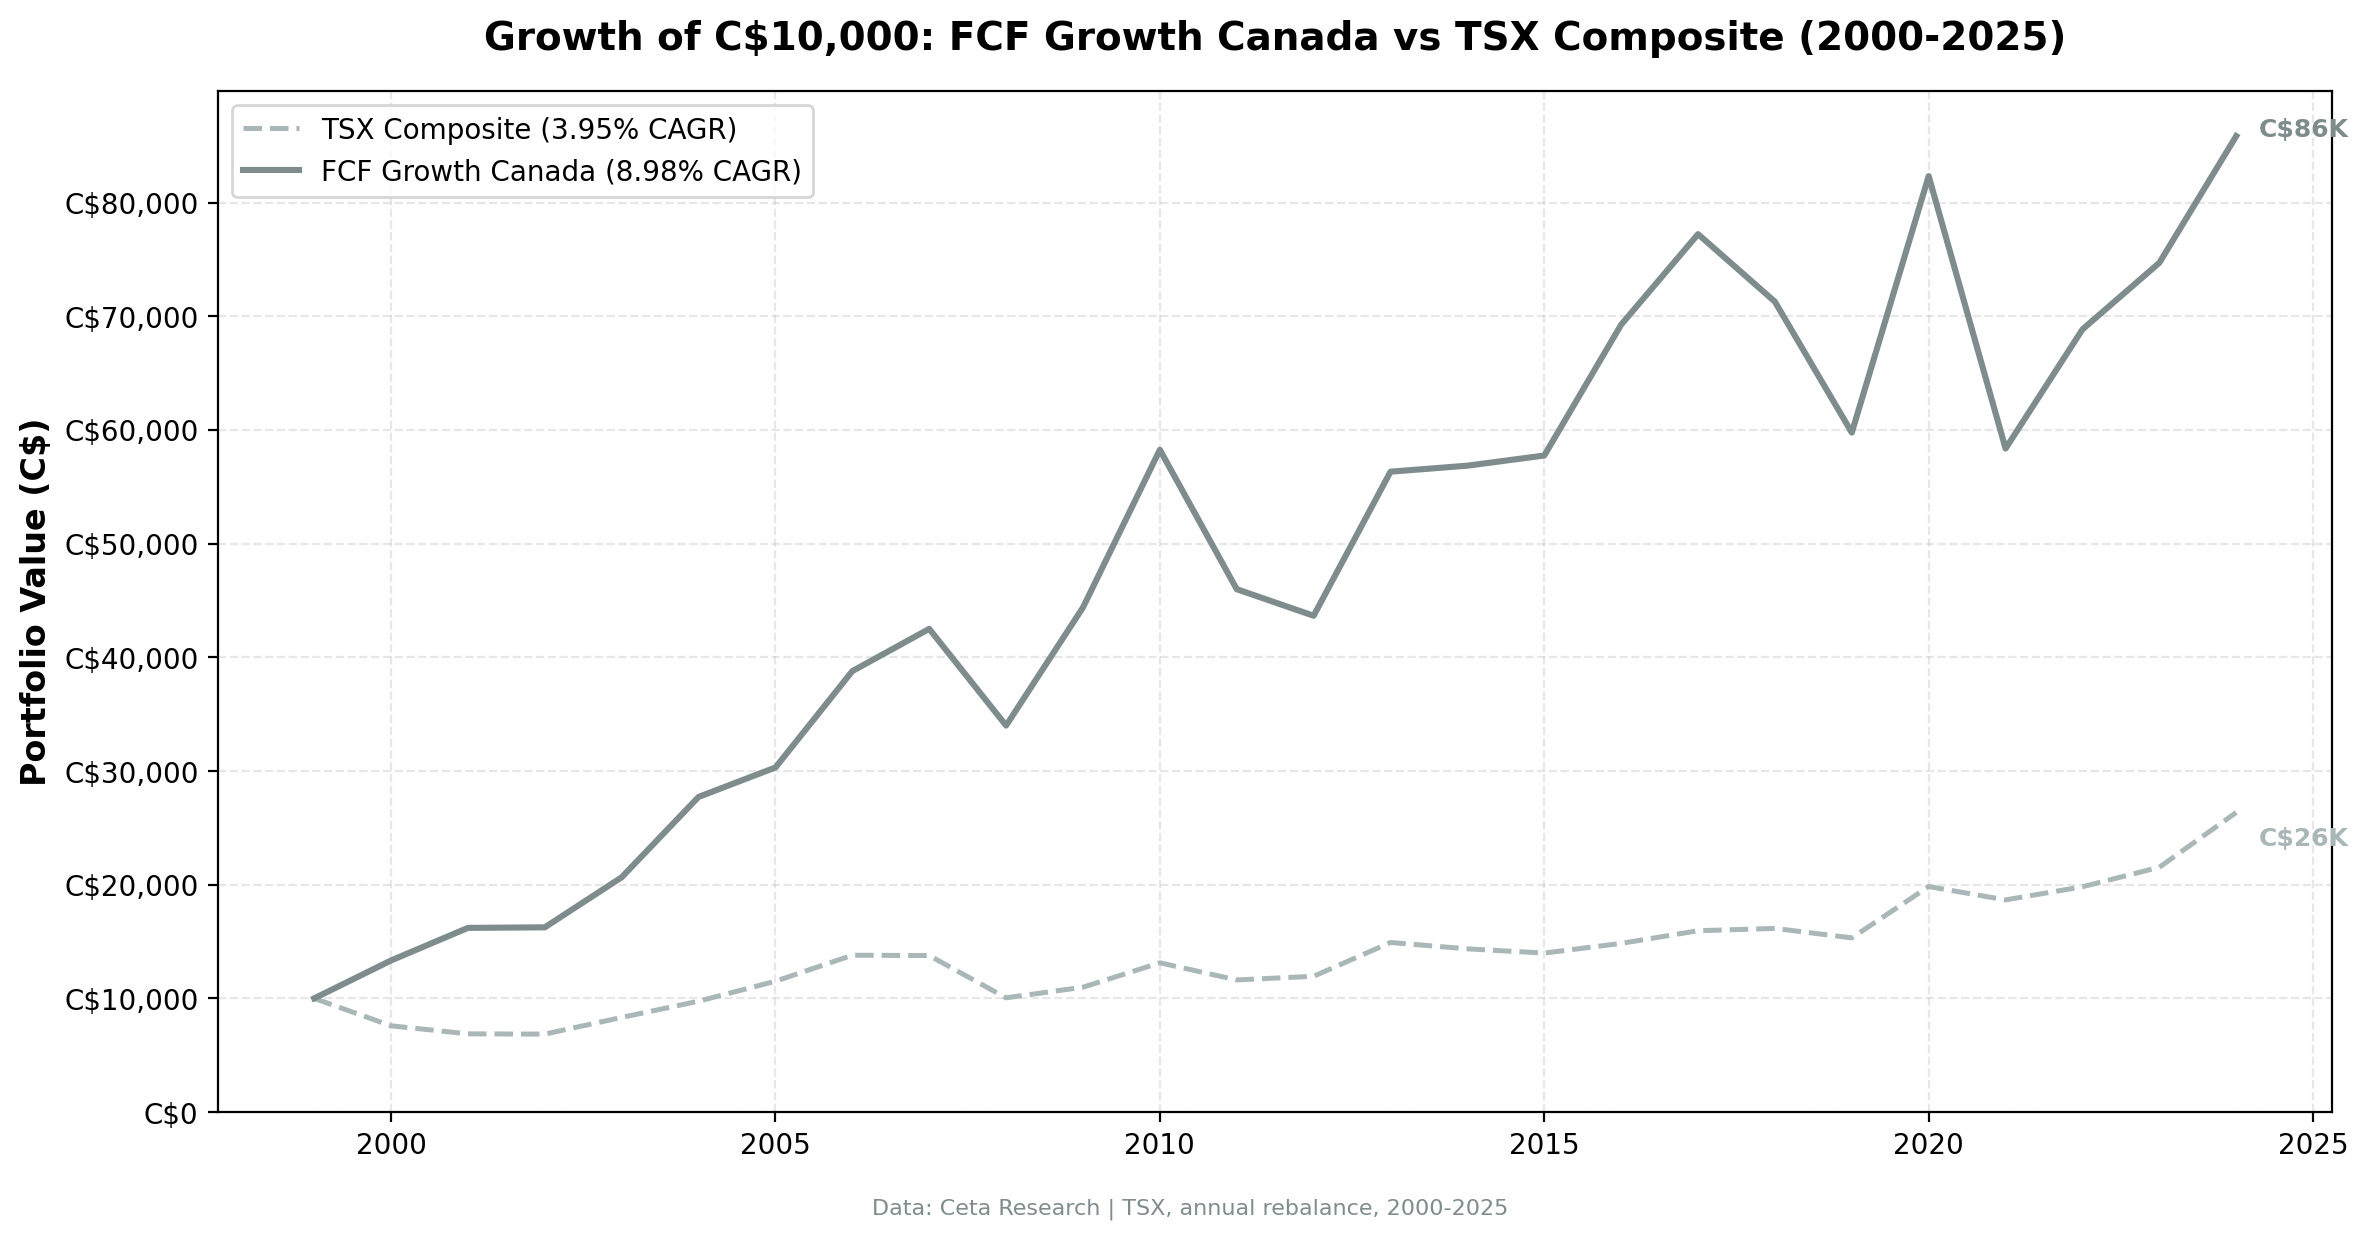
The portfolio returned 8.98% annually over 25 years. The TSX Composite returned 3.95%. C$10,000 grew to C$85,857 in the portfolio versus C$26,355 in the TSX Composite. That's a +5.03% annualized excess return.
The down capture ratio is 21.2%, meaning the portfolio absorbed only about a fifth of the TSX Composite's downside in down years. When the index fell 10%, the portfolio fell roughly 2.1%. The max drawdown of -29.11% is close to the index's own -31.44%, so the protection shows up year to year rather than at the single worst point.
The up capture of 133.9% is notable: the portfolio captured a third more upside than the index in rising years. Combined with the low down capture, this asymmetry drives the strong Sortino ratio (0.638).
The win rate is 68% (17 out of 25 years). The portfolio beat the TSX Composite in more than two-thirds of years.
When It Works
The FCF growth screen in Canada works best during market transitions and recovery periods when cash quality matters more than thematic plays.
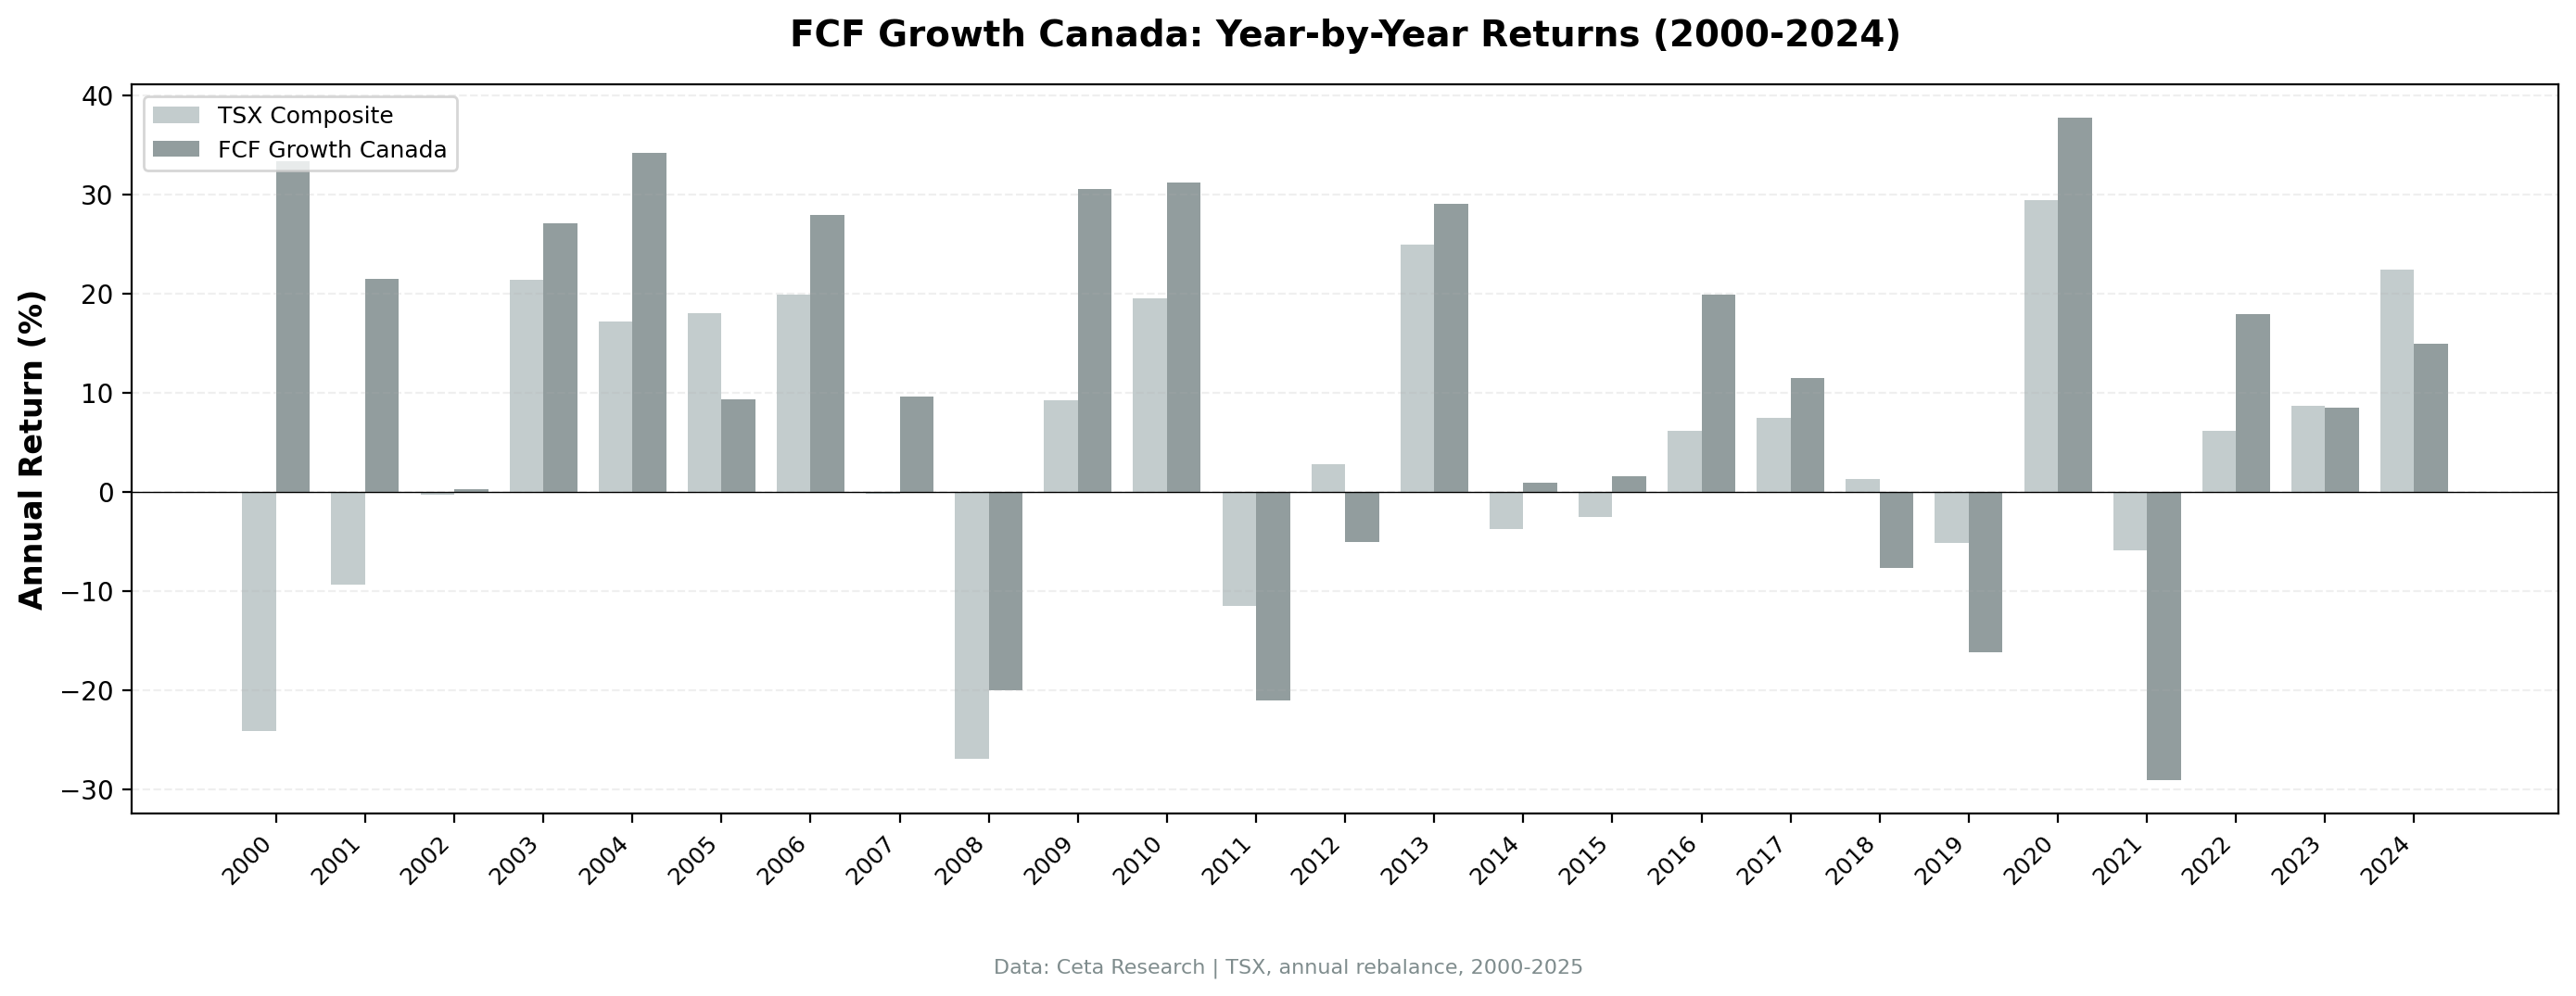
2000-2001 were showcase years: +33.3% and +21.5% portfolio returns when the TSX Composite fell -24.1% and -9.3%. Excess returns of +57.5% and +30.9% in consecutive years. The dot-com bust destroyed speculative tech names. Cash-generating companies in resource and industrial sectors held up.
2009 (+30.6% portfolio vs +9.3% TSX, +21.3% excess) was another recovery year. After the 2008 financial crisis, the Canadian market rebounded, but companies with strong cash generation re-rated faster.
2004 (+17.1% excess), 2006 (+8.1% excess), 2010 (+11.7% excess), 2016 (+13.8% excess), and 2022 (+11.8% excess) show consistent outperformance in years when the broader market rose but investors rewarded quality.
The pattern: the screen works during stress, early recoveries, and quality rotations. It captures companies that can back up their earnings with actual cash.
When It Fails
The strategy has a clear failure mode: late-cycle momentum regimes and thematic resource booms when investors chase growth regardless of cash quality.
2019 was a bad year: -16.1% portfolio return when the TSX Composite fell -5.2%, a -11.0% excess loss. The portfolio failed to avoid downside and fell harder than the index. This was a year when the TSX itself was weak, and the FCF growth portfolio held names that underperformed even within a down market.
2021 was the worst year (-23.2% excess). It came during the post-pandemic recovery when speculative growth names dominated. The TSX fell -5.9% and the portfolio fell -29.1%. Cash-generating companies were not where the momentum was.
2012 (-7.9% excess), 2011 (-9.6% excess), and 2018 (-9.0% excess) were smaller but consistent underperformance years. In each case, either commodity themes (oil, metals) or rate-sensitive sectors drove returns, and the FCF growth filter didn't align with those themes.
2005 (-8.7% excess) and 2024 (-7.5% excess) stand out because the TSX Composite had strong absolute returns (+18.0% and +22.4%) and the portfolio trailed. These were years when the index was driven by sector strength that the FCF screen missed.
The 2008 Result
2008 is worth isolating because it's the only major crisis year in the data set.
The portfolio lost -20.0% while the TSX Composite lost -27.0%. That's a +7.0% excess return, which shows the defensive quality working. The portfolio fell less than the market, consistent with the 21.2% down capture average.
But the absolute loss was still -20.0%. The FCF growth screen provided relative protection, not absolute protection. In a credit crisis, correlations spike and quality screens cushion but don't eliminate losses.
The 2008 result supports the down capture story. It's not a perfect hedge, but it's evidence that cash-generating companies in Canada absorbed less of the crisis than the broader market.
Annual Returns
| Year | Portfolio | TSX Composite | Excess |
|---|---|---|---|
| 2000 | +33.3% | -24.1% | +57.5% |
| 2001 | +21.5% | -9.3% | +30.9% |
| 2002 | +0.3% | -0.3% | +0.6% |
| 2003 | +27.1% | +21.4% | +5.7% |
| 2004 | +34.2% | +17.1% | +17.1% |
| 2005 | +9.3% | +18.0% | -8.7% |
| 2006 | +28.0% | +19.9% | +8.1% |
| 2007 | +9.6% | -0.2% | +9.8% |
| 2008 | -20.0% | -27.0% | +7.0% |
| 2009 | +30.6% | +9.3% | +21.3% |
| 2010 | +31.2% | +19.6% | +11.7% |
| 2011 | -21.1% | -11.5% | -9.6% |
| 2012 | -5.1% | +2.8% | -7.9% |
| 2013 | +29.0% | +24.9% | +4.1% |
| 2014 | +0.9% | -3.8% | +4.7% |
| 2015 | +1.6% | -2.6% | +4.2% |
| 2016 | +19.9% | +6.1% | +13.8% |
| 2017 | +11.5% | +7.5% | +4.0% |
| 2018 | -7.7% | +1.3% | -9.0% |
| 2019 | -16.1% | -5.2% | -11.0% |
| 2020 | +37.8% | +29.5% | +8.3% |
| 2021 | -29.1% | -5.9% | -23.2% |
| 2022 | +18.0% | +6.2% | +11.8% |
| 2023 | +8.5% | +8.7% | -0.1% |
| 2024 | +14.9% | +22.4% | -7.5% |
The portfolio beat the TSX Composite in 17 of 25 years. The outperforming years include the largest absolute returns (2000, 2001, 2009, 2010, 2020). The underperforming years were mostly years when the TSX was weak or driven by thematic plays the FCF screen missed.
Limitations
Backward-looking signal. FCF growth from the prior fiscal year doesn't predict next year's FCF growth. A company that grew cash last year may face margin compression, capex needs, or commodity price changes this year. The screen captures historical quality, not future quality.
Commodity exposure. Canada's equity market is heavily weighted toward resources (energy, materials). The FCF growth screen will naturally tilt toward or away from these sectors depending on where cash generation is accelerating. Without sector-neutral analysis, it's unclear how much of the excess return comes from the FCF signal versus sector tilts.
The benchmark excludes dividends, and this one matters. Portfolio returns use dividend-adjusted prices, but ^GSPTSE is the S&P/TSX Composite price index and does not reinvest dividends. The TSX is a high-yield market, averaging roughly 2.5% to 3% a year over this period, so a like-for-like total-return comparison would cut the +5.03% excess to somewhere near +2%. Canada remains the strongest developed-market result in the study on that basis, but the headline margin overstates it. The same caveat applies to every exchange in this study except the US and Germany, whose benchmarks (SPY and the DAX) are already total-return.
Currency risk. All returns are in CAD. For USD-based investors, CAD/USD fluctuations would affect realized returns. Over 25 years, CAD has been volatile against USD.
Transaction costs. The backtest uses size-tiered cost estimates. Real-world costs depend on position sizing, liquidity, and execution. For smaller portfolios, per-share commission structures change the math.
Point-in-time data. All rebalances use data available 45 days after fiscal year-end to prevent lookahead bias. Live implementation requires access to a verified point-in-time financial data feed.
Market cap threshold. The backtest's C$500M floor is mid-cap territory in Canada. Some qualifying stocks may have liquidity constraints for larger portfolios.
Global Context
This analysis covers TSX-listed stocks only. The FCF growth signal behaves differently across markets. Canada's results (8.98% CAGR, +5.03% excess vs TSX Composite) are the strongest developed-market outcome in the study, well ahead of the US version (6.57% CAGR, -1.28% excess vs SPY). A full global comparison is covered in the companion blog on international FCF growth results.
Run It Yourself
Both screens query the Ceta Research FMP warehouse directly.
Today's FCF growth leaders (simple): cetaresearch.com/data-explorer?q=j8-47BGKfY
With quality filters (advanced): cetaresearch.com/data-explorer?q=wRm8hnX0OG
The full backtest code, including methodology, annual rebalance logic, and cost model, is on GitHub: github.com/ceta-research/backtests
Data: Ceta Research (FMP warehouse), TTM metrics. Backtest period: 2000–2025. Returns in CAD. Execution: MOC (next-day close). Benchmark: S&P/TSX Composite price index. Past performance does not guarantee future results. Not investment advice.

