FCF growth
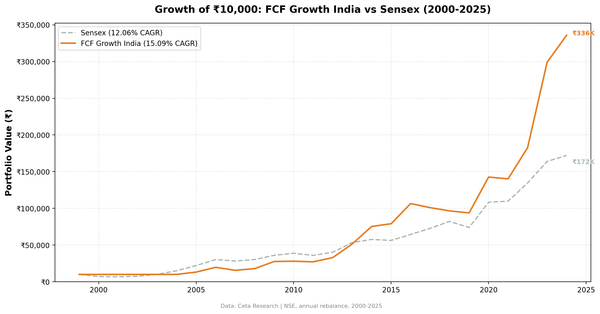
FCF Growth in India: 15.09% CAGR Over 25 Years (NSE Backtest)
₹10,000 grew to ₹335,761 over 25 years using a free cash flow growth screen on NSE stocks. 15.09% CAGR, +3.03% above the Sensex, and a 36.9% down capture ratio.

FCF growth
₹10,000 grew to ₹335,761 over 25 years using a free cash flow growth screen on NSE stocks. 15.09% CAGR, +3.03% above the Sensex, and a 36.9% down capture ratio.
FCF growth
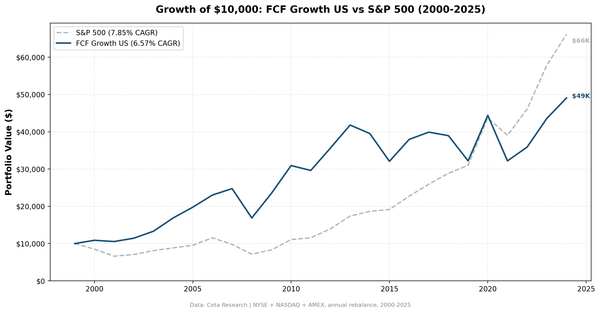
We backtested FCF growth stocks across NYSE, NASDAQ, AMEX from 2000 to 2025. The strategy absorbs crashes at about half the rate of SPY (51.3% down capture) but trails on absolute return (6.57% vs 7.85% CAGR). Honest results from a 25-year run.
FCF growth
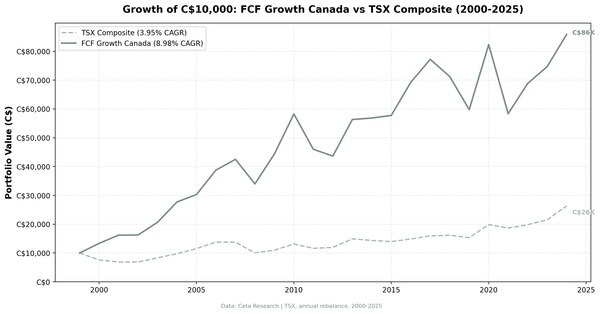
Canada FCF growth stocks produced 8.98% CAGR over 25 years, beating the TSX Composite by 5.03 percentage points per year. 21.2% down capture means the portfolio absorbed only a fifth of the TSX downside in down years.
FCF growth
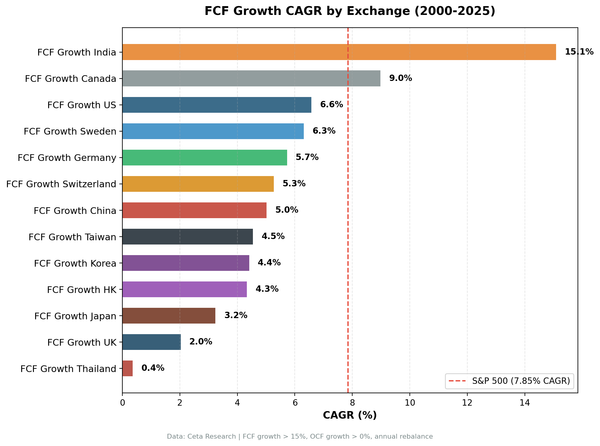
We ran the same FCF growth screen across 13 exchanges over 25 years. Nine of 13 beat their local benchmark, but the real story is data coverage: once periods without usable prices are held in cash, the UK collapses from best market to barely positive.
FCF growth
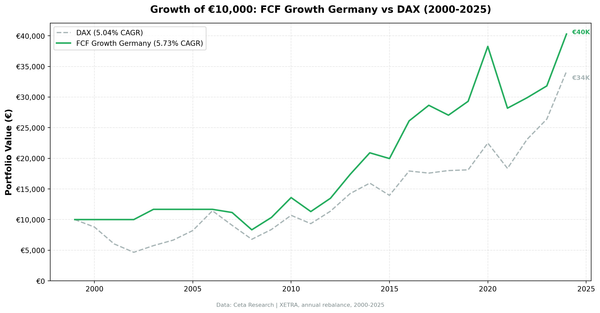
German FCF growth stocks beat the DAX by just 0.69 percentage points a year over 25 years, and a German-domicile test flips that negative. The durable result is risk: 42.9% down capture and a -28.62% worst drawdown against the index's -53.43%.