
FCF Growth in India: 15.09% CAGR Over 25 Years (NSE Backtest)
₹10,000 grew to ₹335,761 over 25 years using a free cash flow growth screen on NSE stocks. 15.09% CAGR, +3.03% above the Sensex, and a 36.9% down capture ratio.

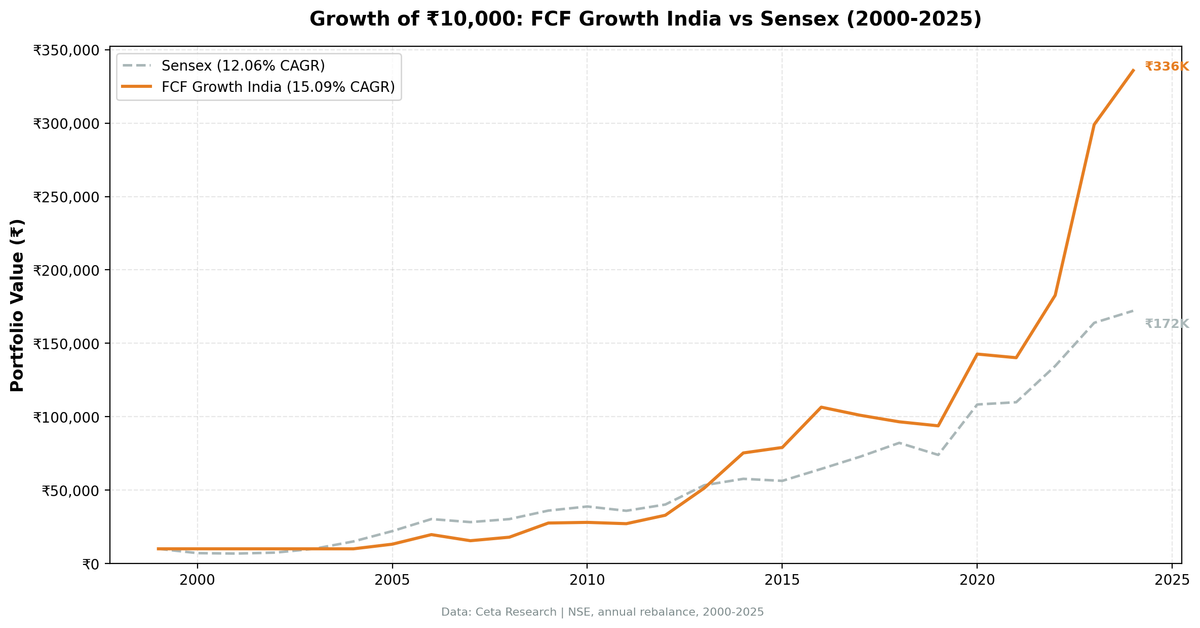
The FCF growth screen in India produced 15.09% annualized returns from 2000 to 2025, beating the Sensex by 3 percentage points per year. ₹10,000 grew to ₹335,761. The portfolio absorbed only 36.9% of the Sensex's downside in down years, and it sat in cash for the first five.
Contents
- Method
- The Screen
- Simple Screen
- Advanced Screen
- Results
- When It Works
- When It Fails
- The 2008 Anomaly
- Annual Returns
- Limitations
- Global Context
- Run It Yourself
Data: FMP financial data warehouse (NSE), 2000–2025. Returns in INR. Updated August 2026.
Method
The strategy screens for NSE-listed stocks with accelerating free cash flow. FCF must grow by more than 15% year-over-year, and operating cash flow must also grow. That second condition matters because it prevents false positives where a company cuts capex to boost FCF without actually growing the business.
Quality filters keep the portfolio in profitable, moderately leveraged companies: ROE above 10% and debt-to-equity below 1.5. The top 30 stocks by FCF growth rate get equal-weighted and held for a year.
| Parameter | Setting |
|---|---|
| Universe | NSE (National Stock Exchange of India) |
| Market cap | >₹2,000 crore (~$240M USD) |
| Signal | FCF growth YoY >15%, OCF growth YoY >0% |
| Quality | ROE >10%, D/E <1.5 |
| Selection | Top 30 by FCF growth, equal weight |
| Cash rule | Hold cash if <10 qualify |
| Rebalancing | Annual (July), 45-day data lag |
| Execution | MOC (next-day close after rebalance signal) |
| Costs | Size-tiered transaction costs |
| Benchmark | BSE Sensex (^BSESN, price index) |
| Period | 2000–2025 (25 periods) |
| Currency | INR (both portfolio and benchmark) |
| Code | github.com/ceta-research/backtests |
The 45-day lag ensures that annual filings are publicly available before they enter the screen. A fiscal year-end in March doesn't enter the July rebalance until statements are filed. Entry and exit prices use the next trading day's close (MOC execution).
One convention to note before reading any annual figure below. Each period runs July to July and is labelled by the year it begins, so "2008" means July 2008 through July 2009, not the calendar year. Period returns therefore won't match calendar-year figures you may have seen elsewhere. Portfolio and benchmark are measured over identical windows, so excess returns are consistent.
The market cap threshold scales to the Indian market. ₹2,000 crore is roughly $240M USD and filters out the micro-cap segment where liquidity becomes a real implementation constraint. The live screens below use a lower ₹1,250 crore floor so they surface a broader slice of today's market.
The academic basis is Sloan (1996), who documented that cash-backed earnings outperform accrual-heavy earnings. Companies that report cash generation tend to continue generating cash. This screen isolates companies where cash generation is accelerating, not just existing.
The Screen
Simple Screen
Ranks NSE-listed stocks by year-over-year FCF growth with a 15% minimum threshold and ₹1,250 crore market cap floor. Run it: cetaresearch.com/data-explorer?q=LKQfAVjRwf
WITH cf AS (
    SELECT symbol, freeCashFlow AS fcf, reportedCurrency,
        ROW_NUMBER() OVER (PARTITION BY symbol ORDER BY dateEpoch DESC) AS rn
    FROM cash_flow_statement WHERE period = 'FY'
)
SELECT cc.symbol, p.companyName,
    ROUND((cc.fcf - cp.fcf) / ABS(cp.fcf) * 100, 1) AS fcf_growth_pct,
    ROUND(cc.fcf / 10000000, 1) AS fcf_cr,
    ROUND(p.marketCap / 10000000, 2) AS mktcap_cr
FROM cf cc
JOIN cf cp ON cc.symbol = cp.symbol AND cp.rn = 2
JOIN profile p ON cc.symbol = p.symbol
WHERE cc.rn = 1
  AND cc.fcf > 0 AND cp.fcf > 0
  AND (cc.fcf - cp.fcf) / ABS(cp.fcf) > 0.15
  AND p.marketCap > 12500000000
  AND p.exchange = 'NSE'
  -- data-quality guards
  AND p.isFund = false AND p.isEtf = false AND p.isActivelyTrading = true
  AND cc.reportedCurrency = p.currency
  AND p.industry <> 'Asset Management'
  AND cc.fcf < p.marketCap
  AND cp.fcf >= 0.002 * p.marketCap
QUALIFY ROW_NUMBER() OVER (PARTITION BY COALESCE(p.cik, p.symbol)
                           ORDER BY p.averageVolume DESC) = 1
ORDER BY fcf_growth_pct DESC
LIMIT 30
Advanced Screen
Adds the capex-cut guard (OCF must also grow), ROE quality filter, and leverage check. cetaresearch.com/data-explorer?q=oOQBhR7n_4
WITH cf AS (
    SELECT symbol, freeCashFlow AS fcf, operatingCashFlow AS ocf, reportedCurrency,
        ROW_NUMBER() OVER (PARTITION BY symbol ORDER BY dateEpoch DESC) AS rn
    FROM cash_flow_statement WHERE period = 'FY'
)
SELECT cc.symbol, p.companyName,
    ROUND((cc.fcf - cp.fcf) / ABS(cp.fcf) * 100, 1) AS fcf_growth_pct,
    ROUND((cc.ocf - cp.ocf) / ABS(cp.ocf) * 100, 1) AS ocf_growth_pct,
    ROUND(k.returnOnEquityTTM * 100, 1) AS roe_pct,
    ROUND(f.debtToEquityRatioTTM, 2) AS debt_equity,
    ROUND(p.marketCap / 10000000, 2) AS mktcap_cr
FROM cf cc
JOIN cf cp ON cc.symbol = cp.symbol AND cp.rn = 2
JOIN key_metrics_ttm k ON cc.symbol = k.symbol
JOIN financial_ratios_ttm f ON cc.symbol = f.symbol
JOIN profile p ON cc.symbol = p.symbol
WHERE cc.rn = 1
  AND cc.fcf > 0 AND cp.fcf > 0
  AND (cc.fcf - cp.fcf) / ABS(cp.fcf) > 0.15
  AND (cc.ocf - cp.ocf) / ABS(cp.ocf) > 0.0
  AND k.returnOnEquityTTM > 0.10
  AND f.debtToEquityRatioTTM < 1.5
  AND p.marketCap > 12500000000
  AND p.exchange = 'NSE'
  -- data-quality guards
  AND p.isFund = false AND p.isEtf = false AND p.isActivelyTrading = true
  AND cc.reportedCurrency = p.currency
  AND p.industry <> 'Asset Management'
  AND cc.fcf < p.marketCap
  AND cp.fcf >= 0.002 * p.marketCap
QUALIFY ROW_NUMBER() OVER (PARTITION BY COALESCE(p.cik, p.symbol)
                           ORDER BY p.averageVolume DESC) = 1
ORDER BY fcf_growth_pct DESC
LIMIT 30
Reading the output. Growth rate is a ratio, so the top of both lists is companies rebounding off a small prior-year base rather than the largest cash generators. The 0.2%-of-market-cap floor on last year's free cash flow keeps the millions-of-percent cases out, but a company going from $2M to $85M of free cash flow still outranks one going from $2B to $3B. That's the strategy as specified rather than a data problem: the backtest ranks by the same rate and buys the same names. Sort by the FCF column when you want scale rather than rate.
Results
| Metric | FCF Growth | Sensex |
|---|---|---|
| CAGR | 15.09% | 12.06% |
| Total Return | 3,257.61% | 1,621.57% |
| Max Drawdown | -21.16% | -32.20% |
| Volatility | 24.48% | — |
| Sharpe | 0.351 | — |
| Sortino | 1.106 | — |
| Calmar | 0.713 | — |
| Beta | 0.662 | 1.00 |
| Up Capture | 113.7% | — |
| Down Capture | 36.9% | — |
| Win Rate vs Sensex | 64% (16/25 years) | — |
| ₹10,000 grew to | ₹335,761 | ₹172,157 |
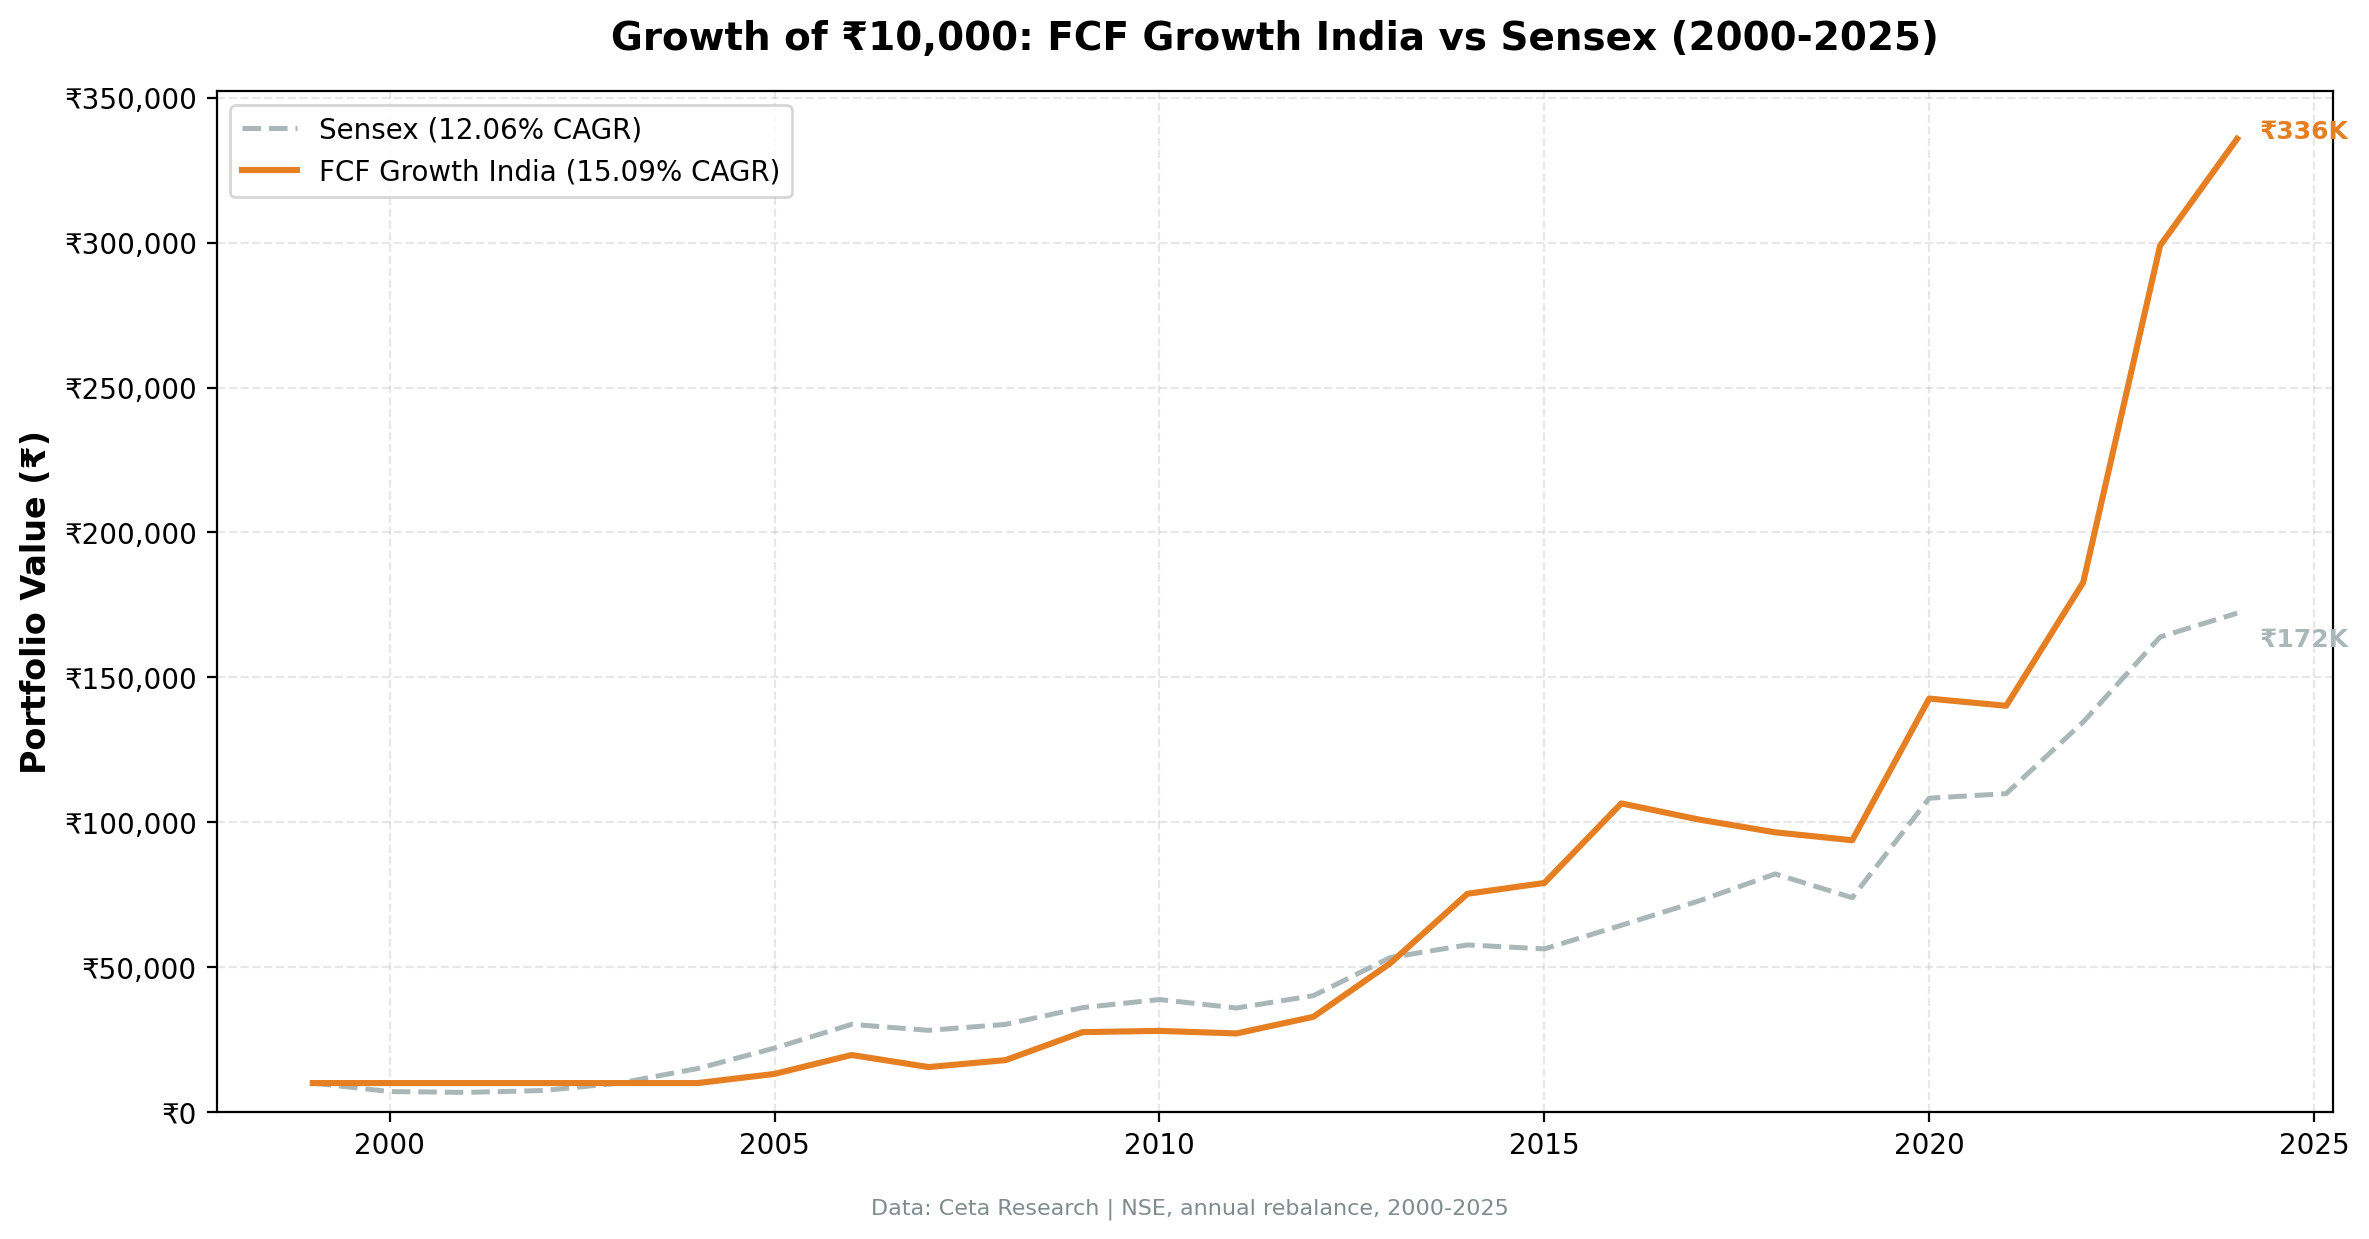
The portfolio returned 15.09% annually over 25 years. The Sensex returned 12.06%. ₹10,000 grew to ₹335,761 in the portfolio versus ₹172,157 in the Sensex. That's a +3.03% annualized excess return.
The down capture ratio is 36.9%. In years when the Sensex fell, the portfolio absorbed a bit over a third of that downside on average. When the index dropped 10%, the portfolio dropped roughly 3.7%. The max drawdown numbers support this: -21.16% for the portfolio versus -32.20% for the Sensex.
The up capture of 113.7% means the portfolio captured slightly more than the market's upside in rising years. Combined with the low down capture, the asymmetry shows up clearly in the Sortino ratio (1.106), which measures return per unit of downside risk.
The win rate is 64%, meaning the portfolio beat the Sensex in 16 out of 25 years. The 9 underperforming years were spread across different market regimes, not clustered.
Five of those 25 periods were spent in cash. See the annual table below.
When It Works
The FCF growth screen in India works best in two scenarios: early-stage recoveries after stress, and periods when quality factors matter more than momentum.
2009 was the standout year: +53.9% portfolio return versus +19.1% Sensex, a +34.7% excess return. After the 2008 global financial crisis, the Indian market rebounded sharply, but companies with strong cash generation re-rated faster. The portfolio caught that rotation.
2014 (+38.4% excess) came during the Modi election year. The market rose broadly, but investors paid a premium for companies with strong fundamentals and cash generation. The FCF screen captured that shift.
2013 (+23.6% excess), 2016 (+20.3% excess), and 2023 (+41.8% excess) were similar: strong absolute returns with meaningful outperformance. In each case, the market was rewarding companies that could back up their growth with actual cash flow.
2000-2004 are marked as cash years in the backtest because the screen failed to find 10 qualifying stocks, turning up between zero and four names a year. The NSE was smaller then, and few companies met the combined FCF growth, OCF growth, ROE, and leverage thresholds. The strategy didn't participate in those early years.
When It Fails
The strategy has a clear failure mode: when the market rotates away from quality into speculative or thematic plays.
2017 and 2018 were painful: -5.2% and -4.4% portfolio returns when the Sensex rose +12.9% both years. Those were momentum-driven years where investors chased growth stories regardless of cash flow quality. The FCF growth filter systematically excluded the companies driving returns.
2021 was similar: -1.7% portfolio return versus +1.4% Sensex. Post-pandemic, the Indian market favored high-growth, often cash-burning companies. The portfolio held quality names that underperformed.
2007 (-14.3% excess) came during a pre-financial crisis period when leverage and expansion themes dominated. Companies with conservative balance sheets and strong cash generation lagged.
2019 (+7.2% excess) is a relative win rather than an absolute one. The Sensex fell -10.0% and the portfolio fell -2.8%, so the defensive quality worked, but the year still lost money.
The pattern is consistent: the screen struggles when investors pay premium multiples for growth regardless of current cash generation. It works when cash quality matters.
The 2008 Anomaly
2008 deserves its own section because it behaves differently in India than in global markets.
The portfolio returned +15.4% while the Sensex returned +7.3%. That's a +8.2% excess return during a year when most global markets collapsed. The US market (SPY) fell -26.9% in 2008. Why did India hold up?
First, timing. This period runs July 2008 to July 2009, so it contains both the October-November 2008 collapse and the sharp rebound that followed it. The Sensex fell 37% from the start of the window to its March 2009 trough, then recovered all of that ground and finished slightly ahead, which is why the period closes up 7.3% despite spanning the worst of the crisis. The preceding period, labelled 2007 and covering July 2007 to July 2008, is where the decline actually shows up: the Sensex returned -6.8% and the portfolio -21.2%.
Second, the Indian market's crisis played out differently. Indian banks had less direct exposure to US sub-prime assets. The crisis hit India through capital outflows and credit tightening, which took time to propagate.
Third, the FCF-generating companies in the 2007 portfolio may have been positioned in sectors with less direct exposure to the crisis. That last point is speculation, since the backtest doesn't break down sector composition, but it's consistent with the data.
The key point: because the July-to-July window swallows both the crash and the rebound, the 2008 figure measures round-trip recovery rather than peak-to-trough resilience. The portfolio's genuinely bad crisis period was 2007, when it lagged the Sensex by 14.3 points.
Annual Returns
| Year | Portfolio | Sensex | Excess |
|---|---|---|---|
| 2000 | 0.0% | -29.3% | +29.3% (cash) |
| 2001 | 0.0% | -4.1% | +4.1% (cash) |
| 2002 | 0.0% | +9.6% | -9.6% (cash) |
| 2003 | 0.0% | +35.2% | -35.2% (cash) |
| 2004 | 0.0% | +49.4% | -49.4% (cash) |
| 2005 | +31.6% | +47.0% | -15.3% |
| 2006 | +49.6% | +37.1% | +12.4% |
| 2007 | -21.2% | -6.8% | -14.3% |
| 2008 | +15.4% | +7.3% | +8.2% |
| 2009 | +53.9% | +19.1% | +34.7% |
| 2010 | +1.6% | +7.8% | -6.2% |
| 2011 | -3.2% | -7.5% | +4.3% |
| 2012 | +21.2% | +11.9% | +9.3% |
| 2013 | +56.3% | +32.8% | +23.6% |
| 2014 | +46.6% | +8.1% | +38.4% |
| 2015 | +5.0% | -2.4% | +7.3% |
| 2016 | +34.7% | +14.4% | +20.3% |
| 2017 | -5.2% | +12.9% | -18.1% |
| 2018 | -4.4% | +12.9% | -17.3% |
| 2019 | -2.8% | -10.0% | +7.2% |
| 2020 | +52.1% | +46.4% | +5.7% |
| 2021 | -1.7% | +1.4% | -3.2% |
| 2022 | +30.3% | +22.5% | +7.9% |
| 2023 | +63.6% | +21.8% | +41.8% |
| 2024 | +12.3% | +5.0% | +7.3% |
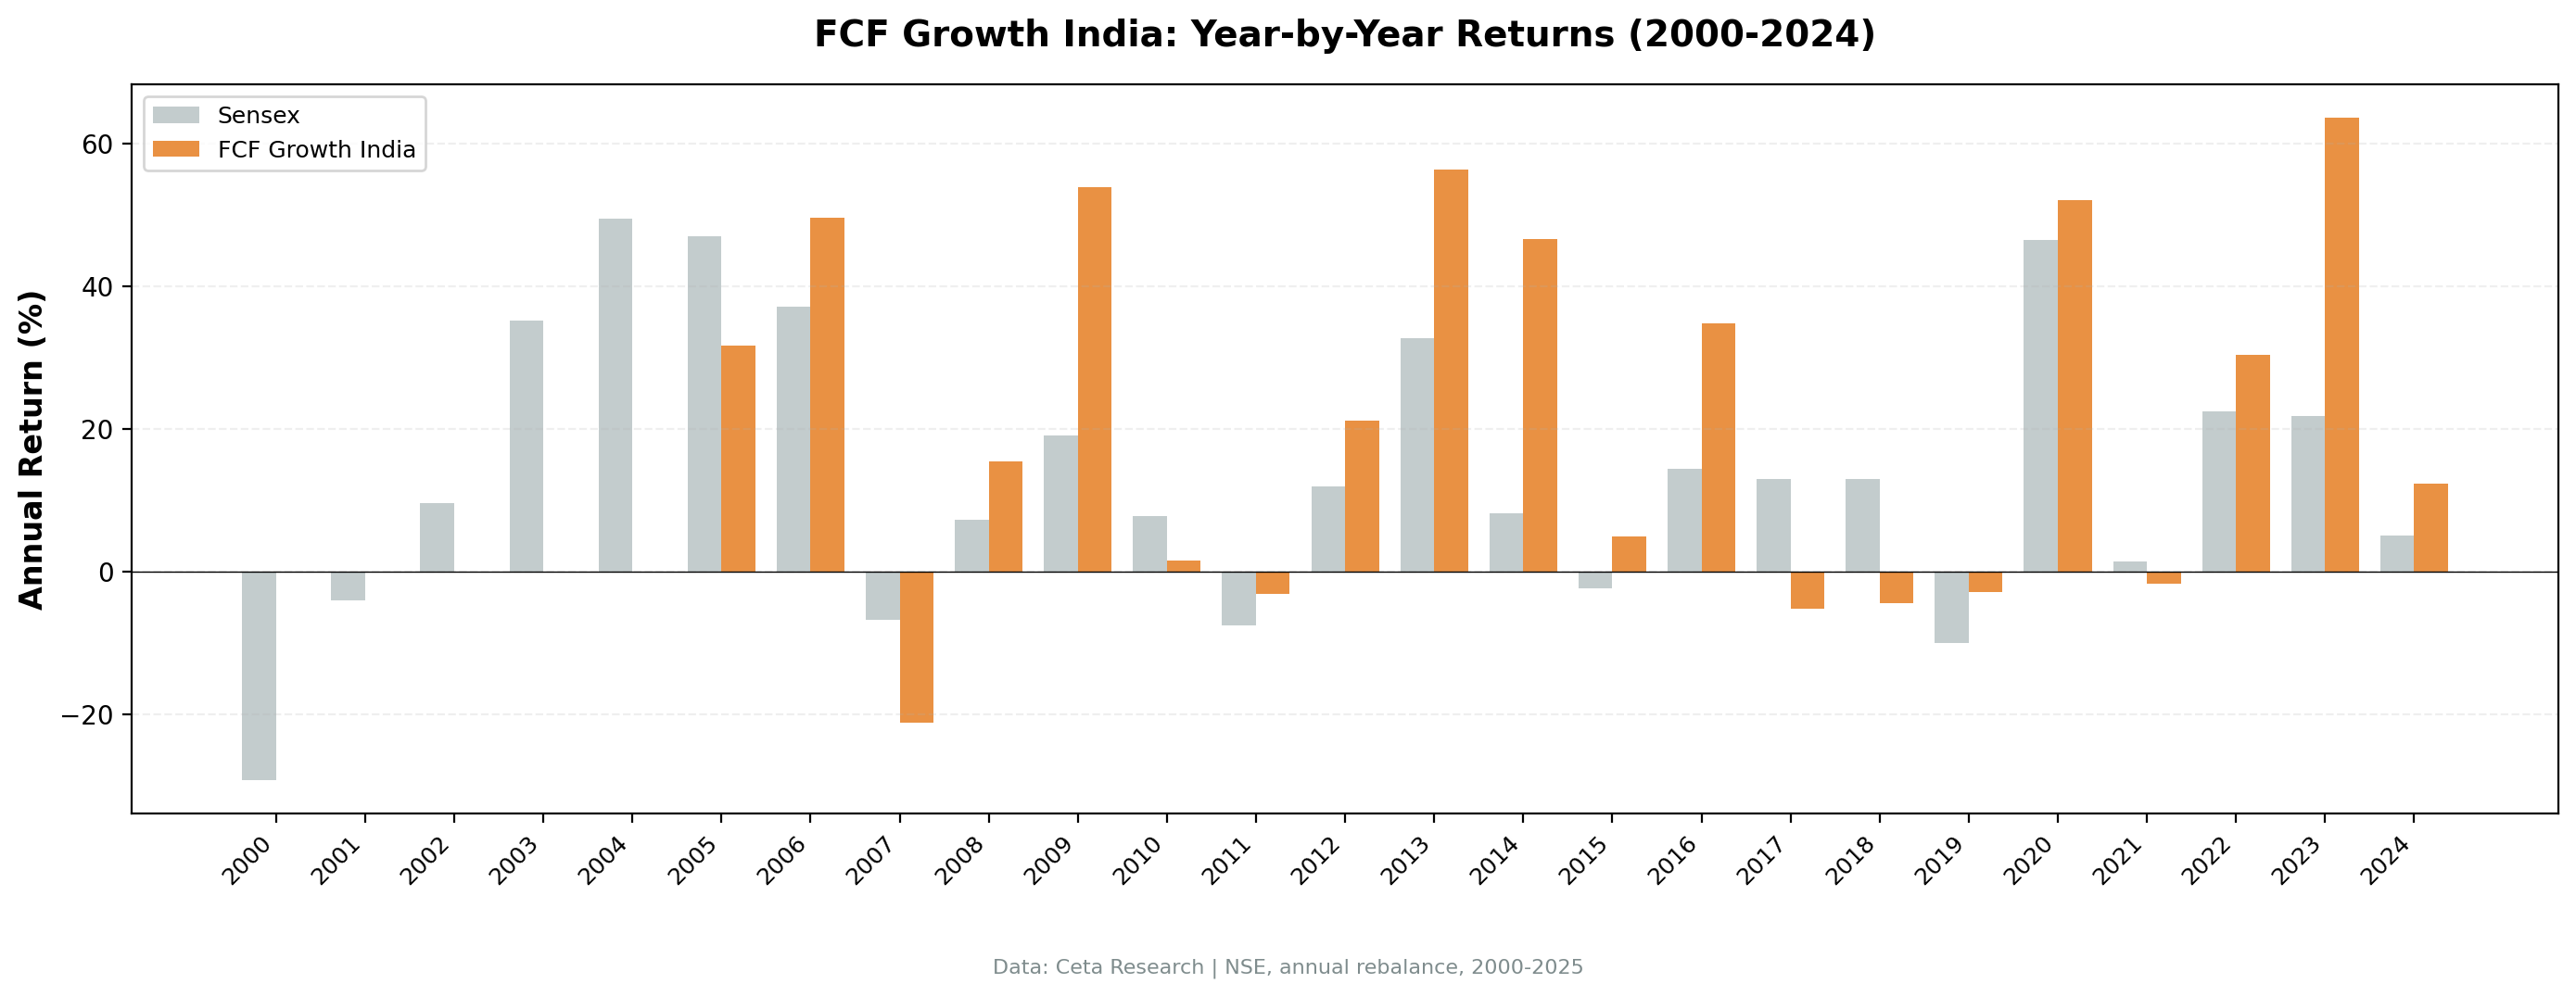
The first five years (2000-2004) are marked as cash because fewer than 10 NSE stocks passed the screen at those rebalance dates: zero in 2000, then one, two, three and four. This is a screen result, not a price-data gap. The NSE was smaller then and few listed companies combined 15% FCF growth with the ROE and leverage tests. From 2005 onward, the strategy was fully invested every year.
Counting only the 20 invested years, the portfolio beat the Sensex in 14 of them, a 70% win rate. The underperforming years were typically modest, except 2017 and 2018. The headline 64% win rate over all 25 periods includes the cash years, two of which beat a falling Sensex simply by holding nothing.
Limitations
Backward-looking signal. FCF growth from the prior fiscal year doesn't predict next year's FCF growth. A company that grew cash last year may face margin compression, rising capex, or competitive pressure this year. The screen captures historical cash quality, not future cash quality.
The benchmark excludes dividends. Portfolio returns use dividend-adjusted prices, but ^BSESN is the Sensex price index and does not reinvest dividends. The Sensex has yielded roughly 1% to 1.5% a year over this period, so a like-for-like total-return comparison would reduce the +3.03% excess by approximately that much. The direction of the result holds; the margin is narrower than the headline.
Currency risk. All returns are in INR. For USD-based investors, currency fluctuations between INR and USD would affect realized returns. Over 25 years, INR has depreciated against USD, which would reduce USD-denominated returns.
Early cash years. The first five years show zero returns because the screen couldn't find 10 qualifying stocks, not because prices were missing. The NSE had fewer companies in 2000-2004 and the quality filters are strict. The 25-year CAGR effectively comes from 20 years of active investing.
No sector breakdown. The backtest doesn't report sector composition. It's possible the outperformance comes from systematic overweights in certain sectors (IT, pharma, etc.) rather than the FCF growth signal itself. Without sector-neutral analysis, this can't be ruled out.
Transaction costs. The backtest uses size-tiered cost estimates. Real-world costs in India include STT (securities transaction tax), brokerage, and impact cost, especially for smaller-cap names. The cost model is an approximation.
Point-in-time data. All rebalances use data available 45 days after fiscal year-end to prevent lookahead bias. Live implementation requires access to a verified point-in-time financial data feed, not just the latest reported numbers.
Market cap threshold. The backtest's ₹2,000 crore (~$240M USD) floor filters out micro-caps, but it's still in the small-cap range by Indian standards. Liquidity can be an issue for larger portfolio sizes.
Global Context
This analysis covers NSE-listed stocks only. The FCF growth signal behaves differently across markets. India's results (15.09% CAGR, +3.03% excess vs Sensex) outperform the US version (6.57% CAGR, -1.28% excess vs SPY). A full global comparison is covered in the companion blog on international FCF growth results.
Run It Yourself
Both screens query the Ceta Research FMP warehouse directly.
Today's FCF growth leaders (simple): cetaresearch.com/data-explorer?q=LKQfAVjRwf
With quality filters (advanced): cetaresearch.com/data-explorer?q=oOQBhR7n_4
The full backtest code, including methodology, annual rebalance logic, and cost model, is on GitHub: github.com/ceta-research/backtests
Data: Ceta Research (FMP warehouse), TTM metrics. Backtest period: 2000–2025. Returns in INR. Execution: MOC (next-day close). Benchmark: BSE Sensex price index. Past performance does not guarantee future results. Not investment advice.

