
We Tested GARP in 17 Markets. Germany and Hong Kong Beat Their Benchmarks.
We ran the GARP strategy on 17 stock exchanges from 2000 to 2025. Against local benchmarks, Germany (+4.40% vs DAX) and Hong Kong (+4.36% vs Hang Seng) clearly outperform. India barely beats the Sensex (+0.63%). Here's the full comparison.

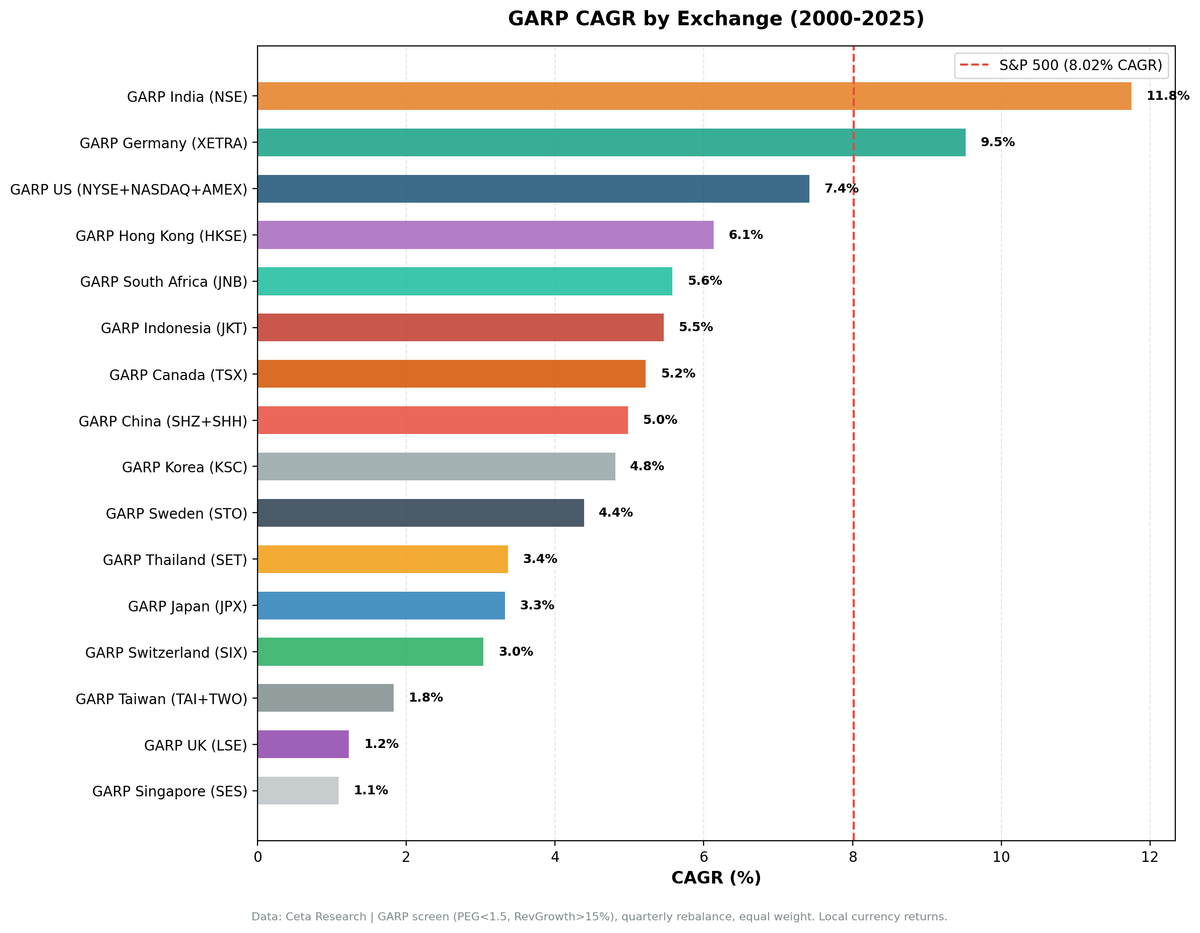
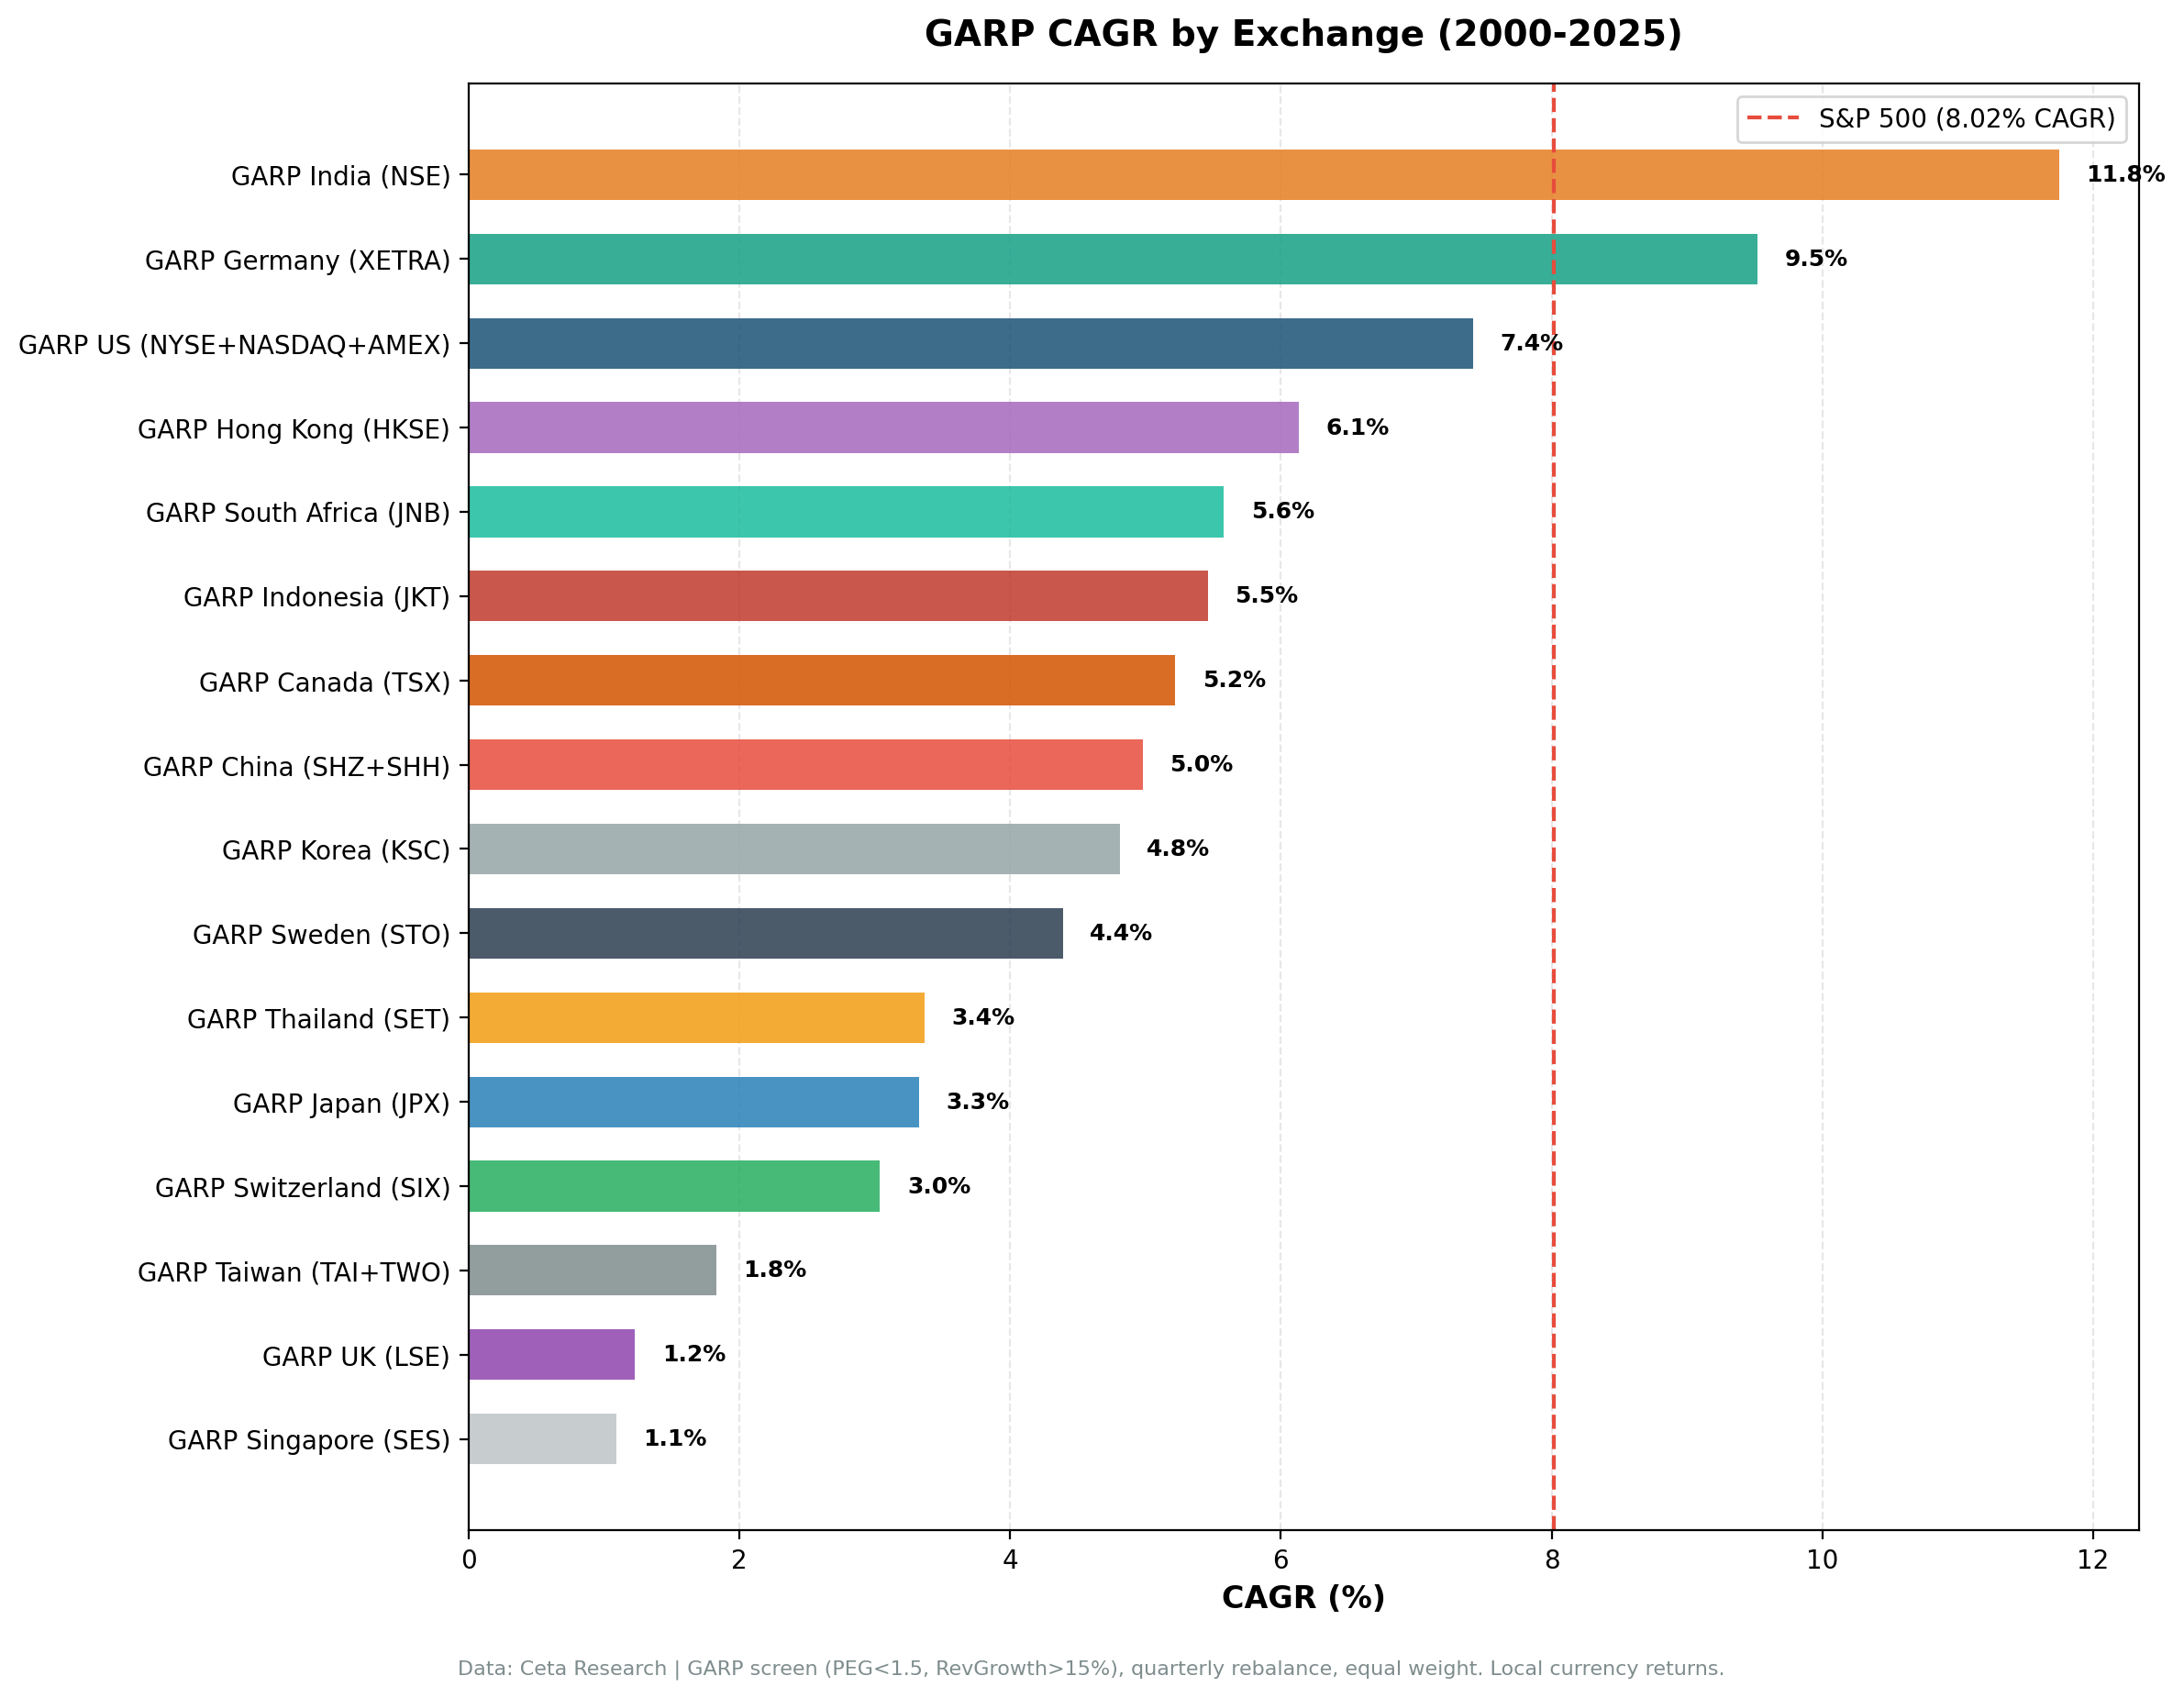
We ran the Growth at a Reasonable Price (GARP) strategy (PEG < 1.5, revenue growth > 15%, ROE > 10%) on 17 stock exchanges worldwide from 2000 to 2025. The S&P 500 benchmark returned 8.02% annually. When compared to local currency benchmarks, the picture changes completely: Germany beats the DAX by 4.40% per year and Hong Kong beats the Hang Seng by 4.36%, while most other markets cluster near or below their local index. India's apparent 3.73% excess vs SPY is mostly India's growth premium, not GARP alpha. Against the Sensex, India outperforms by just 0.63%.
Contents
- Method
- What We Found
- Cross-market comparison (all vs SPY in USD)
- Local Benchmark Comparison: The Real Alpha
- Why Local Benchmarks Matter
- Max Drawdowns
- Cash Periods: Where the Signal Doesn't Fire
- The Real Winners
- Why Germany and Hong Kong Outperform With Local Benchmarks
- The India Reversal
- What the Pattern Suggests
- Limitations
- Takeaway
- Individual Exchange Posts
- References
Data: FMP financial data warehouse, 2000–2025. Updated March 2026.
Method
Data source: Ceta Research (FMP financial data warehouse) Period: 2000–2025 (25 years, 103 quarterly periods) Rebalancing: Quarterly (January, April, July, October), equal weight Benchmarks: Cross-market comparison uses SPY; local alpha measured vs local indices Transaction costs: Size-tiered model (0.1–0.5% one-way based on market cap) Cash rule: Hold cash if fewer than 10 stocks qualify at a rebalance date
Each exchange uses exchange-specific market cap thresholds in local currency. Financial data has a 45-day lag on annual filings to prevent look-ahead bias.
GARP signal filters (all must pass at each rebalance):
| Filter | Threshold |
|---|---|
| PEG ratio | 0 < PEG < 1.5 |
| P/E ratio | 5 < P/E < 50 |
| Revenue growth (YoY) | > 15% |
| ROE | > 10% |
| Debt/Equity | < 2.0 |
| Market cap | Exchange-specific threshold |
What We Found
Cross-market comparison (all vs SPY in USD)
| Exchange | CAGR | vs SPY | Sharpe |
|---|---|---|---|
| India (NSE) | 11.75% | +3.73% | 0.163 |
| Germany (XETRA) | 9.52% | +1.50% | 0.348 |
| Norway (OSL) | 9.24% | +1.22% | 0.353 |
| US (NYSE+NASDAQ+AMEX) | 7.42% | -0.60% | 0.242 |
| Hong Kong (HKSE) | 6.13% | -1.89% | 0.111 |
| South Africa (JNB) | 5.58% | -2.44% | -0.201 |
| Indonesia (JKT) | 5.46% | -2.56% | 0.157 |
| Canada (TSX) | 5.22% | -2.80% | 0.123 |
| China (SHZ+SHH) | 4.98% | -3.04% | 0.068 |
| Korea (KSC) | 4.81% | -3.21% | 0.108 |
| Sweden (STO) | 4.39% | -3.63% | 0.110 |
| Thailand (SET) | 3.37% | -4.65% | 0.035 |
| Japan (JPX) | 3.33% | -4.69% | 0.148 |
| Switzerland (SIX) | 3.04% | -4.98% | 0.132 |
| Taiwan (TAI+TWO) | 1.83% | -6.19% | 0.043 |
| UK (LSE) | 1.23% | -6.79% | -0.101 |
| Singapore (SES) | 1.09% | -6.93% | -0.076 |
SPY benchmark: 8.02% CAGR, Sharpe 0.361
India tops the vs-SPY ranking at +3.73%, but most of that gap reflects India's faster economic growth relative to the US, not the GARP signal finding alpha. When we compare each market to its own local benchmark, the story changes.
Local Benchmark Comparison: The Real Alpha
Comparing strategies to SPY is useful for cross-market portfolio allocation, but it mixes currency effects, economic growth differentials, and stock selection skill. To isolate the GARP signal's actual performance, we need local currency benchmarks.
GARP excess return vs local market index:
| Exchange | GARP CAGR | Local Bench | Bench CAGR | Excess | Sharpe GARP vs Bench |
|---|---|---|---|---|---|
| Germany (XETRA) | 9.52% | DAX | 5.12% | +4.40% | 0.348 vs 0.139 |
| Hong Kong (HKSE) | 6.13% | Hang Seng | 1.77% | +4.36% | 0.111 vs -0.058 |
| Sweden (STO) | 4.39% | OMX Stockholm | 3.17% | +1.22% | 0.110 vs 0.060 |
| Switzerland (SIX) | 3.04% | SMI | 2.10% | +0.93% | 0.132 vs 0.112 |
| China (SHZ+SHH) | 4.98% | SSE Composite | 4.19% | +0.79% | 0.068 vs 0.060 |
| India (NSE) | 11.75% | Sensex | 11.12% | +0.63% | 0.163 vs 0.194 |
| Canada (TSX) | 5.22% | TSX Composite | 5.08% | +0.13% | 0.123 vs 0.166 |
| Korea (KSC) | 4.81% | KOSPI | 4.81% | -0.00% | 0.108 vs 0.077 |
| Japan (JPX) | 3.33% | Nikkei 225 | 3.40% | -0.07% | 0.148 vs 0.157 |
| UK (LSE) | 1.23% | FTSE 100 | 1.36% | -0.12% | -0.101 vs -0.151 |
| Thailand (SET) | 3.37% | SET Index | 3.76% | -0.39% | 0.035 vs 0.054 |
| US (NYSE+NASDAQ+AMEX) | 7.42% | S&P 500 | 8.02% | -0.60% | 0.242 vs 0.361 |
| Singapore (SES) | 1.09% | STI | 2.17% | -1.08% | -0.076 vs -0.018 |
| Norway (OSL) | 9.24% | Oslo All Share | 10.91% | -1.67% | 0.353 vs 0.553 |
| South Africa (JNB) | 5.58% | SPY | 8.02% | -2.44% | -0.201 vs 0.361 |
| Taiwan (TAI+TWO) | 1.83% | TAIEX | 4.38% | -2.55% | 0.043 vs 0.138 |
| Indonesia (JKT) | 5.46% | SPY | 8.02% | -2.56% | 0.157 vs 0.361 |
Note: Norway data only covers 2013–2025 (Oslo All Share index availability). South Africa and Indonesia use SPY due to limited local index data.
Germany shows +4.40% excess vs the DAX, the strongest result in the dataset. Hong Kong's +4.36% vs the Hang Seng is a near-tie for first. After those two, the edges thin out fast: Sweden (+1.22% vs OMX), Switzerland (+0.93% vs SMI), China (+0.79% vs SSE), and India (+0.63% vs Sensex) all show small positive margins, and the rest sit at or below their local index.
India's +0.63% vs Sensex is essentially flat. The apparent 3.73% excess vs SPY reflects India's growth premium over US equities, not GARP's stock selection adding value above the Indian market.
Why Local Benchmarks Matter
The SPY comparison showed "India and Germany ahead, most markets underperform." That's accurate for USD-based portfolio allocation, but it doesn't tell you whether the GARP signal is working.
India's economy grew faster than the US from 2000–2025. The Sensex returned 11.12% while SPY returned 8.02%. Any long-only India strategy would have shown ~3% excess vs SPY. GARP India's +0.63% excess vs Sensex shows the screen barely adds value beyond a simple Indian index fund.
Germany wins on both counts. Against SPY it's +1.50%, and against the DAX it's +4.40%. The DAX had a brutal 2000–2009 period, and GARP's quality filters (ROE > 10%, D/E < 2.0) kept financially stressed companies out during that decade, then captured the recovery.
The Hong Kong result (+4.36% vs the Hang Seng) is the most surprising. The Hang Seng returned only 1.77% CAGR from 2000–2025, weighed down by property and financials. A quality-growth screen on Hong Kong mid-caps far outran the index. The UK, by contrast, used to look like the strongest result in earlier runs of this study. After correcting price-data artifacts in the FTSE-listed names (split-adjustment spikes that inflated returns), UK GARP lands at -0.12% vs the FTSE, with no real edge once the bad data is filtered out.
Max Drawdowns
| Exchange | Max Drawdown | Local Bench MDD | Protection |
|---|---|---|---|
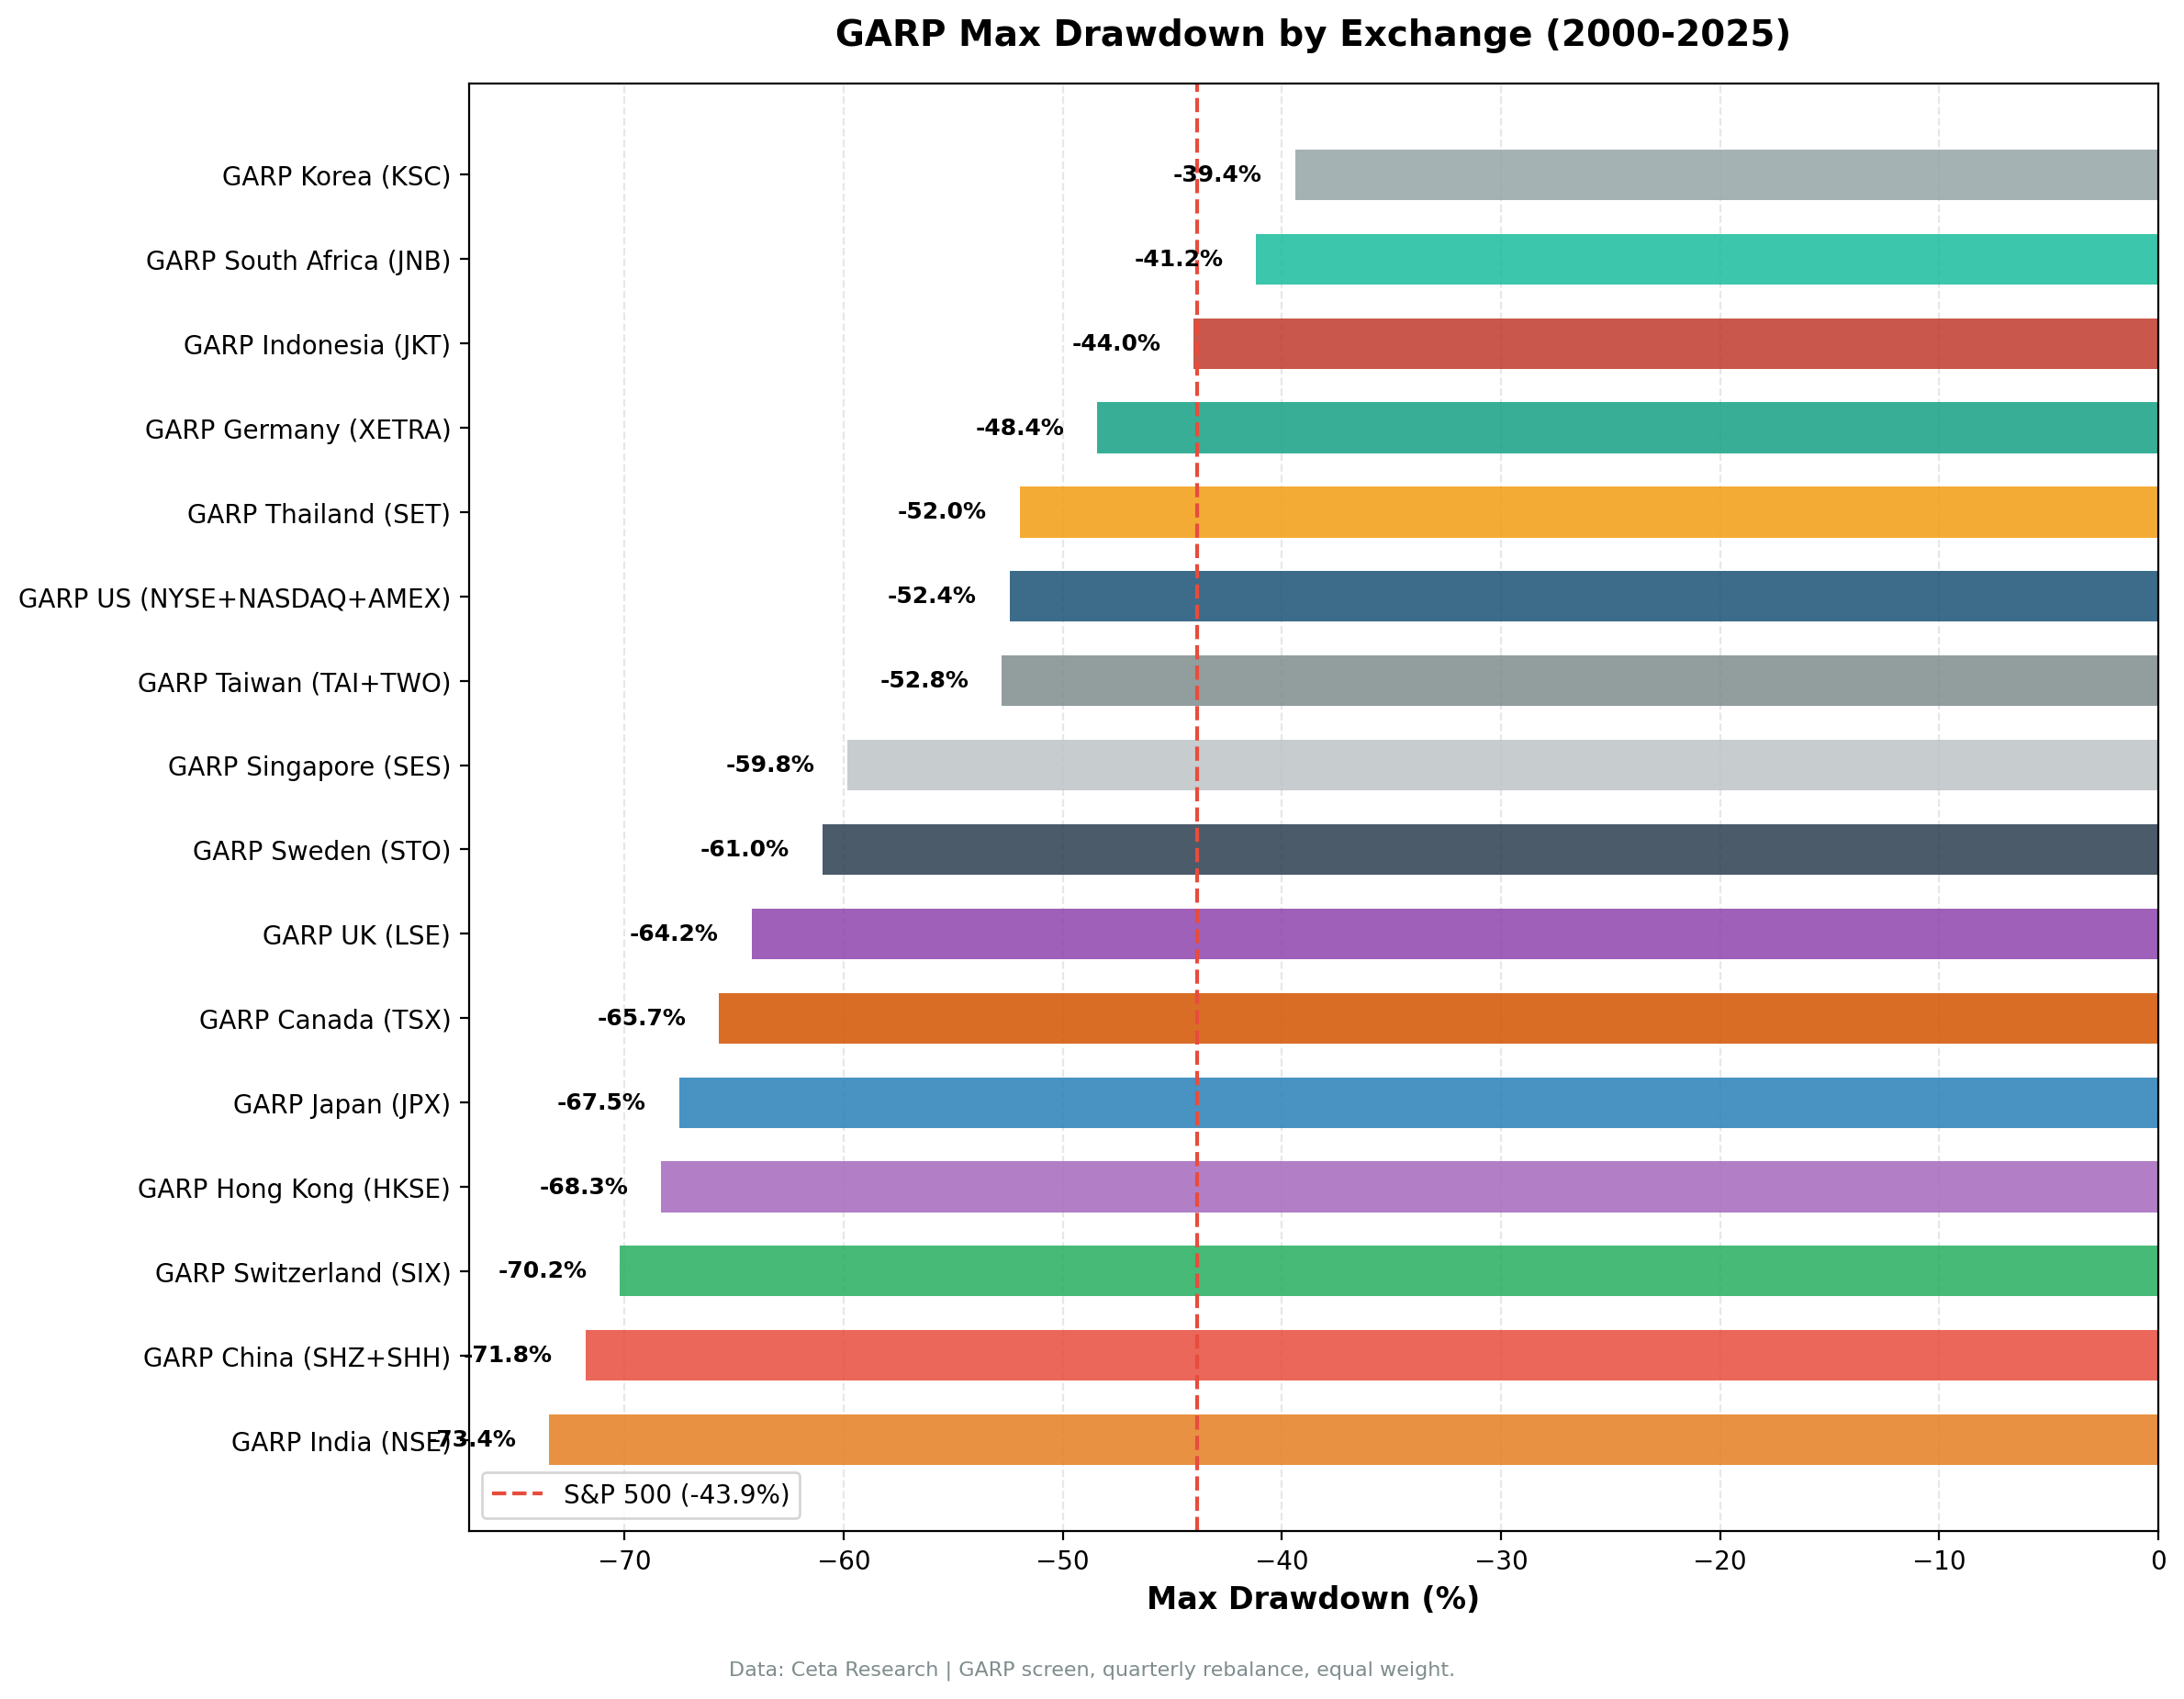
| India (NSE) | -73.42% | -51.34% | worse |
| China (SHZ+SHH) | -71.78% | N/A | N/A |
| Switzerland (SIX) | -70.21% | N/A | N/A |
| Hong Kong (HKSE) | -68.33% | -50.50% | worse |
| Japan (JPX) | -67.50% | N/A | N/A |
| Canada (TSX) | -65.69% | N/A | N/A |
| UK (LSE) | -64.20% | N/A | N/A |
| Sweden (STO) | -60.96% | N/A | N/A |
| Singapore (SES) | -59.81% | N/A | N/A |
| Taiwan (TAI+TWO) | -52.77% | N/A | N/A |
| US (NYSE+NASDAQ+AMEX) | -52.43% | -43.86% | worse |
| Thailand (SET) | -51.96% | N/A | N/A |
| Germany (XETRA) | -48.42% | -65.15% | better |
| Indonesia (JKT) | -44.02% | N/A | N/A |
| South Africa (JNB) | -41.17% | N/A | N/A |
| Korea (KSC) | -39.40% | N/A | N/A |
| Norway (OSL) | -30.93% | N/A | N/A |
Germany is the standout: -48.42% max drawdown vs the DAX's -65.15%. The DAX lost nearly two-thirds of its value peak-to-trough (2000–2009). Germany GARP's quality filters provided genuine crash protection, the only major market where GARP cut the drawdown materially below its benchmark.
Hong Kong is the opposite case. Its +4.36% excess vs the Hang Seng comes entirely from return, not safety: GARP's -68.33% drawdown is deeper than the Hang Seng's -50.50%. The screen there holds concentrated, high-beta growth names that amplify both directions. India shows the same pattern: -73.42% vs Sensex -51.34%, concentrated growth stocks in an emerging market amplifying downside during global crises.
Cash Periods: Where the Signal Doesn't Fire
Some markets showed high cash usage, quarterly periods when fewer than 10 stocks qualified. High cash means the GARP signal is structurally weak for that market.
| Exchange | Cash Periods | Cash % | Interpretation |
|---|---|---|---|
| Norway (OSL) | 24 of 50 | 48% | Signal rarely fires (oil-heavy); data only 2013–2025 |
| Indonesia (JKT) | 37 of 103 | 36% | Cyclical, limited depth |
| Korea (KSC) | 34 of 103 | 33% | Chaebol structure limits PEG candidates |
| Sweden (STO) | 34 of 103 | 33% | Small mid-cap universe for GARP |
| South Africa (JNB) | 31 of 103 | 30% | Thin qualifying universe |
| Taiwan (TAI+TWO) | 29 of 103 | 28% | Concentrated economy, tech-heavy |
| Japan (JPX) | 23 of 103 | 22% | Low ROE culture limits qualifying stocks |
| India (NSE) | 22 of 103 | 21% | Cash in 2000–2004 only; consistent since 2005 |
| Singapore (SES) | 21 of 103 | 20% | Small market, limited qualifying depth |
| Thailand (SET) | 21 of 103 | 20% | Limited mid-cap GARP universe |
| Switzerland (SIX) | 5 of 103 | 5% | Concentrated but consistent |
| Hong Kong (HKSE) | 4 of 103 | 4% | Large qualifying universe |
| US, Germany, UK, Canada, China | 0 of 103 | 0% | Consistently deep qualifying universe |
Norway's 48% cash rate means the GARP signal fired in only 26 of 50 quarters, and those fall entirely inside the limited 2013–2025 data window (Oslo All Share index availability), so the result is more of a data artifact than a strategy performance measurement.
The Real Winners
Using local benchmarks to measure true alpha:
- Germany: +4.40% vs DAX. The DAX lost heavily in the early 2000s. GARP's filters avoided that crash, captured the recovery, built long-run excess, and delivered roughly 2.5 times the Sharpe ratio (0.348 vs 0.139). The strongest result in the dataset.
- Hong Kong: +4.36% vs Hang Seng. The Hang Seng returned just 1.77% CAGR over the period, weighed down by property and financials. GARP's growth tilt found Hong Kong mid-caps that far outran the index. The edge is all return, not safety: GARP's drawdown (-68.33%) is deeper than the Hang Seng's.
- A thin second tier: Sweden (+1.22% vs OMX), Switzerland (+0.93% vs SMI), China (+0.79% vs SSE), India (+0.63% vs Sensex). Positive but marginal, not the kind of edge you'd build a portfolio around.
India's +0.63% vs Sensex is close to noise territory. The screen doesn't add value beyond an Indian index fund on risk-adjusted terms (Sharpe 0.163 vs Sensex 0.194).
Two markets stand apart. The rest cluster around their local index or below it. An earlier run of this study put the UK at the top (+3.52% vs FTSE); after correcting split-adjustment artifacts in the FTSE-listed price data, UK GARP lands at -0.12%; the apparent edge was bad data, not stock selection.
Why Germany and Hong Kong Outperform With Local Benchmarks
Only two markets show a clear edge vs their home index. Both share a pattern: the local benchmark had a poor 25 years, and the GARP screen had a deep enough universe of genuinely growing companies to exploit it.
The DAX returned 5.12% and the Hang Seng just 1.77% from 2000–2025, both dragged by the dot-com crash, the financial crisis, and (for Hong Kong) property and China-exposure cycles. GARP's quality filters (ROE > 10%, D/E < 2.0, PEG < 1.5) systematically screened out the damaged companies during those crises and tilted toward industrial, chemical, and specialty growth names.
But a weak index alone isn't enough. The UK's FTSE 100 also returned only 1.36%, yet UK GARP didn't beat it. The difference is the qualifying universe: Germany and Hong Kong consistently offered mid-cap companies with real 15%+ revenue growth at reasonable valuations, while the UK's pool of qualifying names didn't deliver the same fundamentals. A bad benchmark creates the opportunity; only a deep, genuinely-growing universe converts it into alpha.
The India Reversal
India's headline vs SPY (+3.73%) is strong. But the Sensex itself returned 11.12% vs SPY's 8.02%. A passive Sensex fund would have shown +3.10% excess. GARP India adds 0.63% above that, thin enough to be close to noise.
The capture ratios vs Sensex (113% up, 105% down) show the screen amplifies both bull and bear markets, with only a slight positive tilt. The cash periods in 2000–2004 cost performance: the Sensex surged +79% in 2003 while GARP held cash. The exceptional years (2007: +37% excess, 2009: +56%, 2023: +51%) are offset by bad years (2008: -20%, 2018: -34%, 2019: -19%).
India is the strongest absolute GARP market globally (11.75% CAGR), but the edge vs its local market is marginal.
What the Pattern Suggests
Run GARP in a market where:
- The local index had a rough 25 years. Germany (DAX 5.12%), Hong Kong (Hang Seng 1.77%), Sweden (OMX 3.17%) all underperformed global equities. GARP's quality bias helped avoid the worst.
- The qualifying universe is deep and genuinely growing. A weak index alone isn't enough: the UK's FTSE returned just 1.36% but UK GARP still didn't beat it. Germany and Hong Kong offered enough mid-cap companies with real revenue growth to convert the opportunity into alpha.
- Quality filters matter during crises. ROE > 10% and D/E < 2.0 kept overleveraged and loss-making companies out. This paid off in Germany's difficult 2000s.
Don't run GARP expecting alpha in:
- High-performing indices. SPY's 8.02% from 2000–2025 was strong. GARP couldn't beat it.
- Markets where local benchmarks are already quality-tilted. The Sensex (India) and KOSPI (Korea) already represent quality companies. GARP doesn't add much.
Limitations
Currency. Each market's returns are in local currency. Cross-currency comparison to SPY (USD) doesn't adjust for exchange rate movements. A market can outperform SPY in local currency while an international investor loses to USD strength.
Exchange-specific market cap thresholds. We use exchange-appropriate minimums (not a flat $1B USD), which affects the qualifying universe size per market.
Survivorship bias. Company profiles use current exchange listings. Delistings, bankruptcies, and mergers aren't tracked through terminal events.
25-year period. The 2000–2025 window includes multiple regime changes. Results could differ significantly over shorter or different time windows. Germany, Hong Kong, and Sweden all benefited from their indices having rough 2000–2010 periods, where GARP's quality bias helped. If we ran 2010–2025, results might differ.
Data quality. Local price data for some exchanges carried split-adjustment artifacts (phantom spikes that revert within a day or two). We filter these out before computing returns. This correction matters: it cut UK GARP from an apparent +3.52% vs FTSE down to -0.12%, removing returns that were never real.
Norway data limitation. Oslo All Share index only available from 2013. Norway's 9.24% CAGR reflects 2013–2025 performance, not the full 25 years.
Takeaway
We tested GARP across 17 stock exchanges. When measured vs local benchmarks, two markets show clear outperformance: Germany (+4.40%) and Hong Kong (+4.36%). A thin second tier follows: Sweden (+1.22%), Switzerland (+0.93%), China (+0.79%), and India (+0.63%). Canada ties the TSX (+0.13%). The UK, the apparent leader in an earlier run, lands at -0.12% after we filtered split-adjustment artifacts out of the FTSE-listed price data.
The finding is that GARP works where local indices had difficult periods AND the qualifying universe held genuinely growing companies. Germany and Hong Kong fit both conditions. A weak benchmark alone doesn't do it: the UK's FTSE was just as weak, but UK GARP didn't beat it. The screen doesn't find hidden gems in efficient markets; it finds quality-growth companies when the headline index is dragged by damaged sectors and a deep growth universe exists to replace them.
For global investors: Germany and Hong Kong stand out as markets where GARP adds real value vs the local benchmark. For Indian investors: GARP roughly matches the Sensex with higher volatility. For US investors: SPY beats GARP.
Run the global GARP screen on Ceta Research
Individual Exchange Posts
- GARP on US Stocks. Fully invested 25 years, underperforms SPY
- GARP on Indian Stocks. Barely beats Sensex, strong vs SPY due to India's growth premium
- GARP on German Stocks. Beats DAX by 4.40% annually, 65% down capture
References
- Lynch, P. (1989). One Up on Wall Street. Simon & Schuster.
- Fama, E. & French, K. (1998). "Value Versus Growth: The International Evidence." Journal of Finance, 53(6), 1975–1999.
- Rouwenhorst, K. (1999). "Local Return Factors and Turnover in Emerging Stock Markets." Journal of Finance, 54(4), 1439–1464.
- Griffin, J., Ji, X. & Martin, S. (2003). "Momentum Investing and Business Cycle Risk: Evidence from Pole to Pole." Journal of Finance, 58(6), 2515–2547.
Data: Ceta Research, FMP financial data warehouse. All exchanges, quarterly rebalance, equal weight, transaction costs included, 2000–2025. Returns in local currency.
Past performance does not guarantee future results. This is educational content, not investment advice.


