GARP on Indian Stocks: The One Market Where Peter Lynch's Screen Actually Works
We tested Peter Lynch''s GARP strategy on BSE + NSE stocks from 2000 to 2025. India is the only market in our 17-exchange test where GARP outperforms. 11.12% CAGR, 130% up capture, 85% down capture.

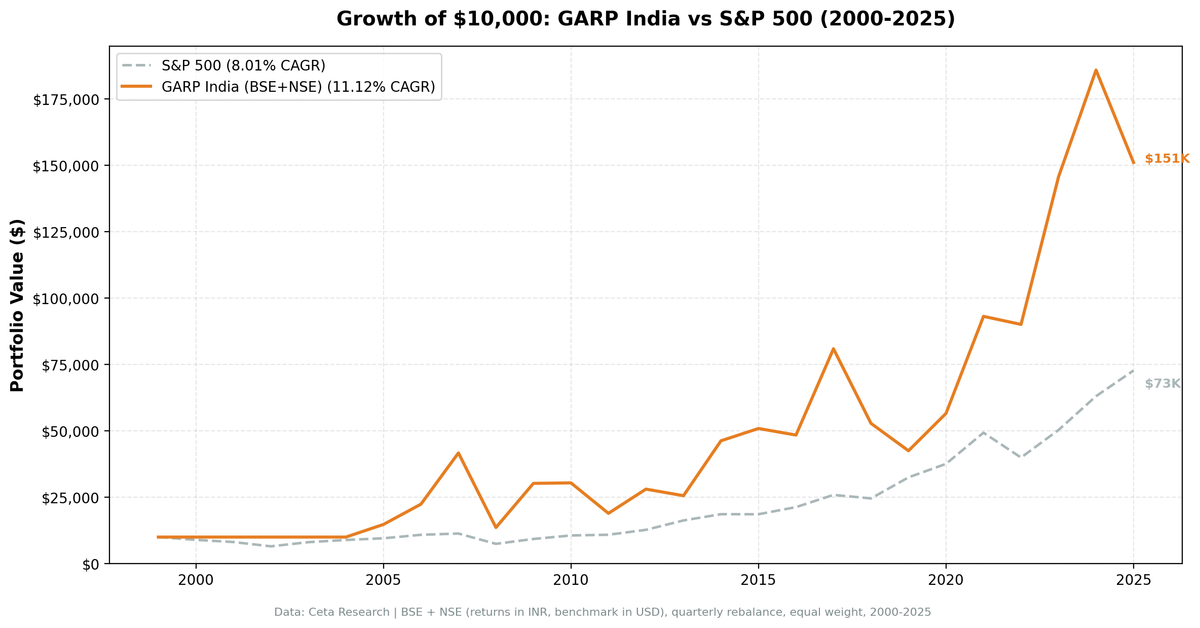
We ran the Growth at a Reasonable Price (GARP) strategy — PEG < 1.5, revenue growth > 15%, ROE > 10% — on Indian stocks (BSE + NSE) from 2000 to 2025. India is the only market in our 17-exchange global test where GARP delivers meaningful outperformance: 11.12% annualized vs 8.01% for the S&P 500. A $10,000 investment grew to $151,091. The strategy captured more of India's bull markets than bear markets — an asymmetry that's hard to engineer.
Contents
- Method
- What is GARP?
- What We Found
- 11.12% CAGR. 130% up capture. 85% down capture.
- Year-by-Year Returns
- Cash in 2000–2004: forced discipline that paid off
- 2005–2007: GARP captures the India growth story
- 2008: the crash hit hard, but the base held
- The volatile middle years (2010–2019)
- 2020–2023: the strongest stretch
- Why GARP Works Here
- Limitations
- Takeaway
- Part of a Series
- Run This Screen Yourself
- References
Method
Data source: Ceta Research (FMP financial data warehouse) Universe: BSE + NSE, market cap > ₹50B (Indian Rupee) Period: 2000–2025 (25 years, 103 quarterly periods) Rebalancing: Quarterly (January, April, July, October), equal weight Benchmark: S&P 500 Total Return (SPY, in USD — cross-currency comparison) Returns: Calculated in INR (Indian Rupee); SPY in USD for reference Cash rule: Hold cash if fewer than 10 stocks qualify
Financial data uses a 45-day lag on annual filings. PEG ratios, P/E, ROE, and debt-to-equity come from fiscal year filings as available at each rebalance date.
Note on benchmarking: India GARP returns are in INR. SPY is in USD. The comparison shows how India GARP performed against the global equity benchmark, not a currency-adjusted comparison.
What is GARP?
GARP — Growth at a Reasonable Price — is Peter Lynch's framework from One Up on Wall Street (1989). The PEG ratio (P/E divided by earnings growth rate) is the central metric. A PEG of 1.0 means you're paying one dollar of P/E for each percentage point of growth. Lynch argued that PEG < 1.0 was cheap; we screen at PEG < 1.5.
All six filters must pass at each quarterly rebalance:
| Filter | Threshold | Why |
|---|---|---|
| PEG ratio | 0 < PEG < 1.5 | Not overpaying for growth |
| P/E ratio | 5 < P/E < 50 | Exclude distressed and speculative |
| Revenue growth (YoY) | > 15% | Must be demonstrably growing |
| ROE | > 10% | Quality filter |
| Debt/Equity | < 2.0 | Leverage constraint |
| Market cap | > ₹50B | Institutional-grade Indian stocks |
The portfolio holds the top 30 by lowest PEG ratio, equal weight.
What We Found

11.12% CAGR. 130% up capture. 85% down capture.
| Metric | GARP India | S&P 500 |
|---|---|---|
| CAGR | 11.12% | 8.01% |
| Total Return | 1,411% | 627% |
| Max Drawdown | -72.67% | -45.53% |
| Volatility | 35.24% | 16.97% |
| Sharpe Ratio | 0.131 | 0.354 |
| Up Capture | 130.52% | — |
| Down Capture | 84.63% | — |
| Cash Periods | 21 of 103 | — |
| Avg Stocks (invested) | 26.9 | — |
The standout number is the capture ratio. When US markets went up, India GARP returned 130% of that move on average. When US markets fell, India GARP absorbed only 85% of the decline. That's the asymmetry investors try to manufacture through complex derivatives — here it emerged naturally from the GARP screen in an emerging market.
The 20% cash periods (21 of 103 quarters) are notable. The screen sat in cash during 2000–2004, a period when Indian markets were too small and too thin to produce enough qualifying stocks. This cash position turned out to be fortuitous — those were years when US markets fell 35% and Indian markets were volatile without the depth GARP needed.
Year-by-Year Returns
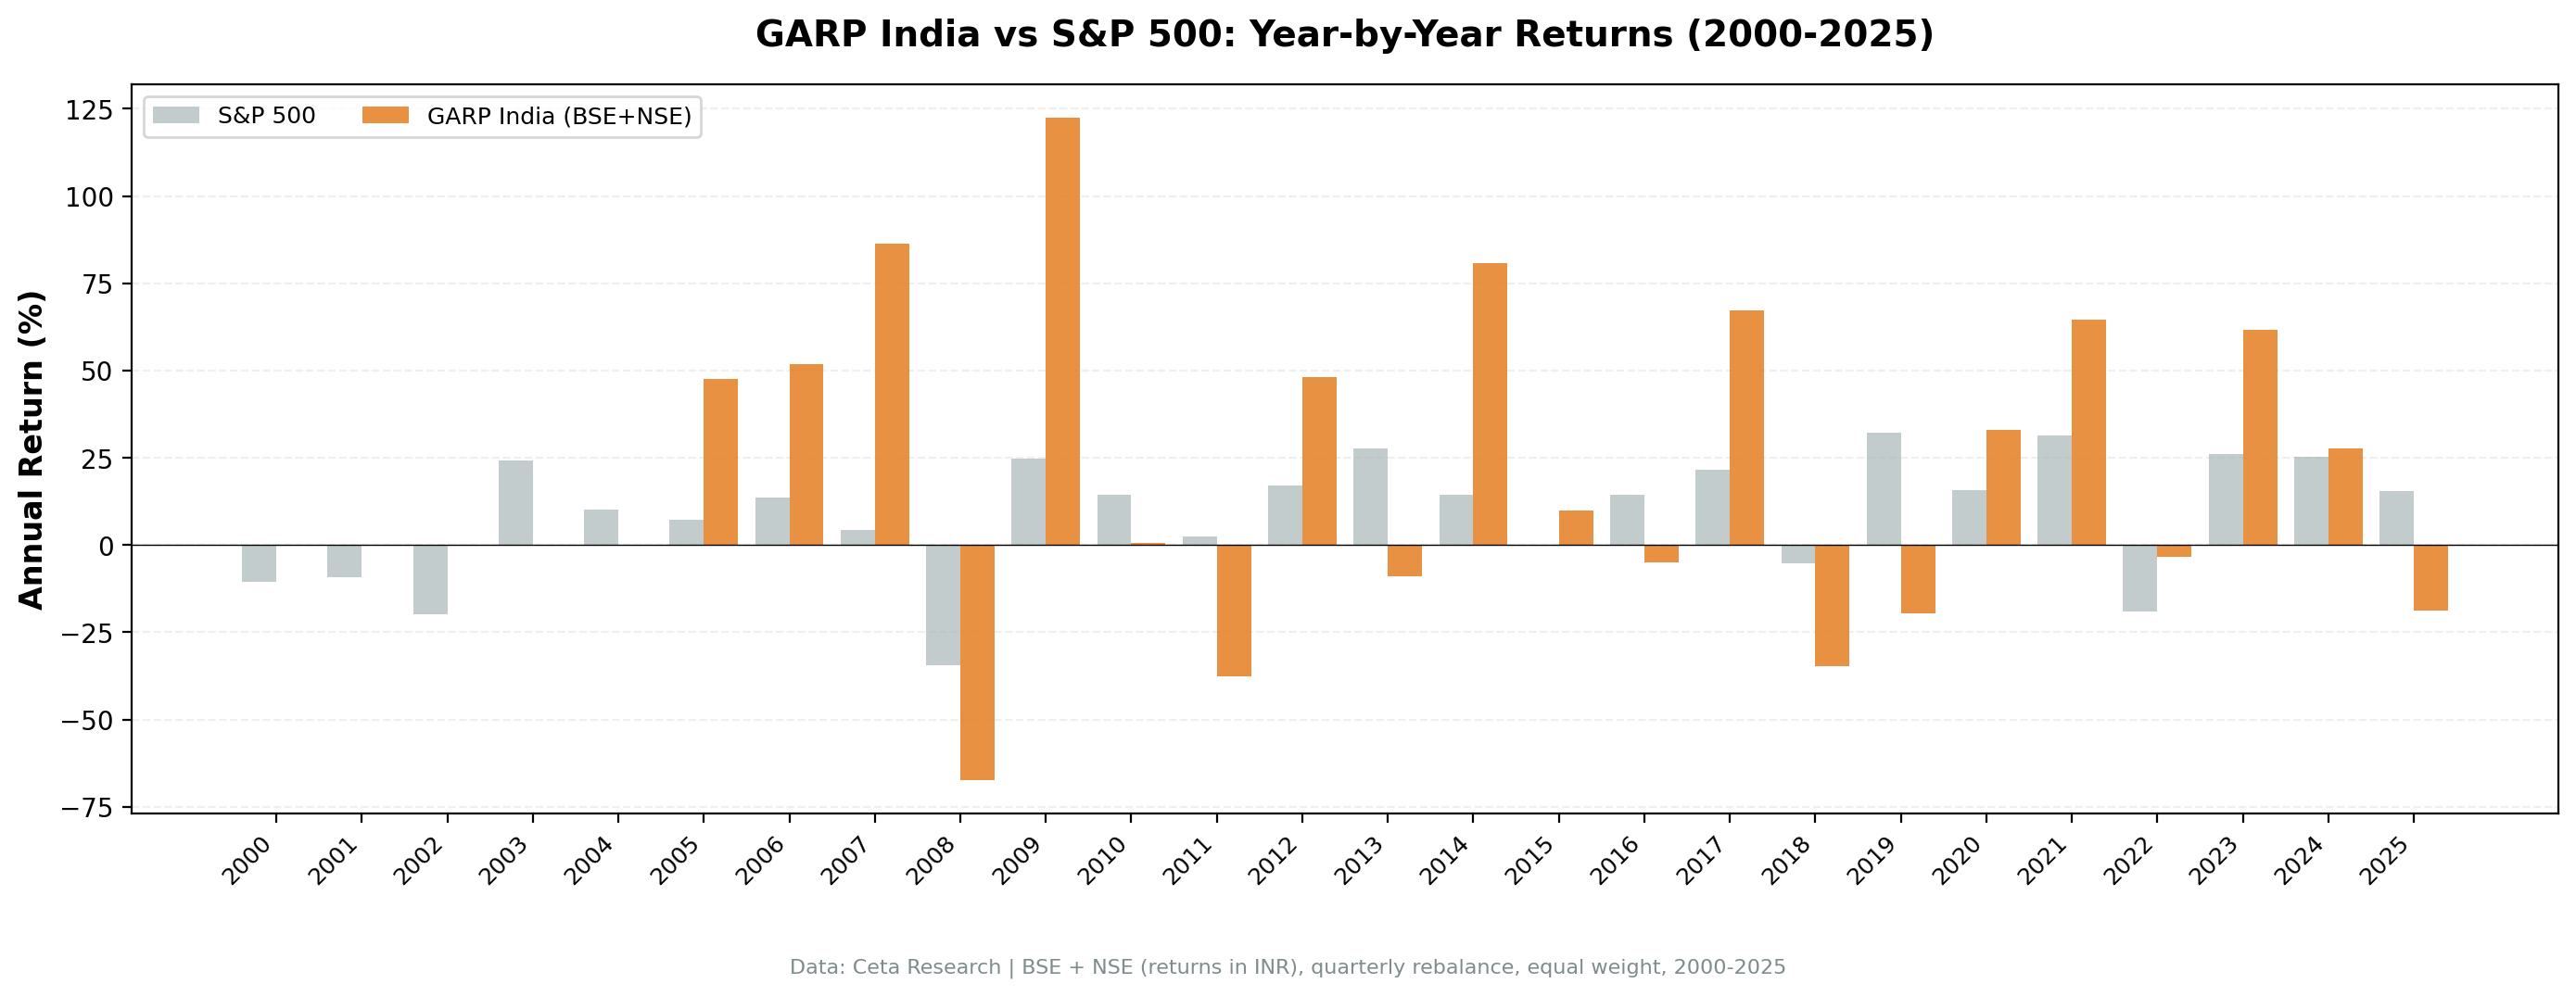
| Year | GARP India | S&P 500 | Excess |
|---|---|---|---|
| 2000–2004 | 0.00% (cash) | -10.5% to +24.1% | n/a |
| 2005 | +47.46% | +7.17% | +40.29% |
| 2006 | +51.81% | +13.65% | +38.16% |
| 2007 | +86.22% | +4.40% | +81.82% |
| 2008 | -67.40% | -34.31% | -33.09% |
| 2009 | +122.46% | +24.73% | +97.73% |
| 2010 | +0.59% | +14.31% | -13.72% |
| 2011 | -37.72% | +2.46% | -40.18% |
| 2012 | +48.16% | +17.09% | +31.07% |
| 2013 | -8.84% | +27.77% | -36.61% |
| 2014 | +80.87% | +14.50% | +66.37% |
| 2015 | +10.02% | -0.12% | +10.14% |
| 2016 | -4.86% | +14.45% | -19.31% |
| 2017 | +67.12% | +21.64% | +45.48% |
| 2018 | -34.73% | -5.15% | -29.58% |
| 2019 | -19.52% | +32.31% | -51.83% |
| 2020 | +33.09% | +15.64% | +17.45% |
| 2021 | +64.62% | +31.26% | +33.36% |
| 2022 | -3.26% | -18.99% | +15.73% |
| 2023 | +61.69% | +26.00% | +35.69% |
| 2024 | +27.61% | +25.28% | +2.33% |
| 2025 | -18.72% | +15.34% | -34.06% |
Cash in 2000–2004: forced discipline that paid off
During 2000–2004, the GARP screen found fewer than 10 qualifying Indian companies. The BSE and NSE simply didn't have enough mid-to-large cap companies simultaneously showing 15%+ revenue growth, PEG < 1.5, and ROE > 10%. The screen went to cash.
This wasn't skill — it was the signal not firing. But the outcome was excellent. India's markets were volatile and illiquid during those years. By sitting out, the portfolio preserved capital and started from a clean base in 2005.
2005–2007: GARP captures the India growth story
When the signal finally fired in 2005, it found exactly what it was designed for: fast-growing Indian companies at reasonable valuations. India's IT services, pharmaceuticals, and infrastructure companies were expanding at 20–40% annually but trading at PEG ratios below 1.5 because the market hadn't yet fully priced in the growth trajectory.
The results: +47% in 2005, +52% in 2006, +86% in 2007. Three years of extraordinary returns that built the foundation for the strategy's 25-year CAGR.
2008: the crash hit hard, but the base held
The 2008 crash took the India GARP portfolio down 67.40%. This is worse than the S&P 500's 34.31%. Concentrated growth stocks in an emerging market sell off faster and deeper in a global crisis.
But 2009 recovered +122.46%. The portfolio came back faster than it fell, which is why the 25-year numbers still look strong despite the severe 2008 drawdown.
The volatile middle years (2010–2019)
India GARP had a mixed decade from 2010–2019. Strong years (2012: +48%, 2014: +81%, 2017: +67%) alternated with poor years (2011: -38%, 2013: -9%, 2018: -35%, 2019: -20%). The pattern reflects India's economic cycle: periods of strong corporate earnings growth followed by credit events, currency pressures, and global risk-off.
2019 was the worst miss: India GARP -19.52% while SPY returned +32.31%. The NBFC crisis in India's financial sector froze credit, which hit growth companies hard. Many companies that had shown 15%+ revenue growth saw sudden earnings stalls.
2020–2023: the strongest stretch
The post-COVID recovery from 2020–2023 was exceptional: +33%, +65%, -3%, +62%. These four years averaged 39% annually. India's manufacturing buildout, digital economy growth, and improving corporate governance created genuine GARP opportunities that the screen captured well.
Why GARP Works Here
The fundamental question: why does a simple quantitative screen outperform in India when it fails in the US?
Informational inefficiency. India's market covers thousands of smaller companies. Analyst coverage is thinner outside the top 200–300 names. A company growing revenue at 25% with a PEG of 0.8 is genuinely undervalued — the information exists but hasn't been fully priced in by institutional capital.
Revenue growth is more predictive. In India's expanding economy, a company showing 15%+ revenue growth tends to sustain that growth longer than a comparable US company. The demographic tailwind, formalization of the informal economy, and rising middle-class consumption mean that early-stage growth is more durable.
The PEG captures genuine undervaluation. When Indian growth companies trade at PEG < 1.5, it's often because domestic investors apply conservative valuations out of habit, and foreign institutional capital hasn't yet moved in. The screen finds these situations before the repricing.
In the US, the same information is available to hundreds of sophisticated quant funds running similar screens. The edge gets arbitraged away. In India, there are fewer participants running systematic GARP screens on the full universe of BSE + NSE stocks.
Limitations
Currency risk. Returns are in INR. An INR/USD depreciation reduces the USD equivalent of returns. Indian investors wouldn't face this, but international comparison is inexact.
High volatility. 35% annualized volatility is nearly double the S&P 500 (17%). The maximum drawdown of 72.67% is severe. An investor who started in 2007 and needed to exit in 2009 would have been down 67%. The 25-year number requires genuine long-horizon commitment.
Liquidity. India's mid-cap segment has thinner order books. Transaction costs modeled here are size-tiered but may not fully capture real market impact for larger positions.
Thin coverage in early years. The 2000–2004 cash periods reflect real data limitations — fewer qualifying companies in India's nascent mid-cap market. This may flatters the long-run numbers somewhat.
Survivorship bias. Profiles use current exchange listings. Indian companies that delisted or failed aren't tracked through failure. This likely understates drawdowns somewhat.
Takeaway
India is the exception in GARP's global track record. 11.12% CAGR over 25 years, +3.11% above the S&P 500 benchmark, with an asymmetric capture profile that delivered more participation in up markets than down markets.
The explanation isn't complicated: India's equity market has genuine information inefficiency in the mid-cap space. A systematic growth-at-value screen finds companies the market hasn't fully priced yet. The same screen in the US finds nothing — the information is already in the price.
The caution is equally real: 72% maximum drawdown, 35% volatility, and years like 2008 (-67%) and 2011 (-38%) test any investor's conviction. This isn't a smooth ride. It's an emerging market strategy with emerging market risk.
Part of a Series
This post is part of our GARP global exchange comparison:
- GARP on US Stocks (NYSE + NASDAQ + AMEX) — 25 years, underperforms SPY
- GARP on German Stocks (XETRA) — Matches benchmark, absorbs 78% of crashes
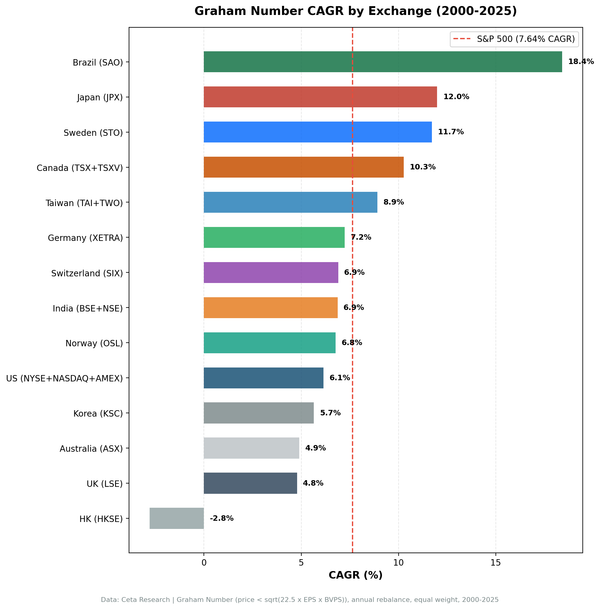
- GARP: 17-Exchange Global Comparison — India is the only outperformer
Run This Screen Yourself
Current GARP screen (Indian stocks, TTM data):
WITH latest_income AS (
    SELECT symbol, revenue, dateEpoch,
           ROW_NUMBER() OVER (PARTITION BY symbol ORDER BY dateEpoch DESC) AS rn
    FROM income_statement WHERE period = 'FY' AND revenue > 0
),
rev_growth AS (
    SELECT c.symbol,
           ROUND((c.revenue - p.revenue) / ABS(p.revenue) * 100, 1) AS rev_growth_pct
    FROM latest_income c
    JOIN latest_income p ON c.symbol = p.symbol AND c.rn = 1 AND p.rn = 2
    WHERE p.revenue > 0 AND (c.revenue - p.revenue) / ABS(p.revenue) > 0.15
)
SELECT f.symbol, p.companyName, p.sector,
    ROUND(f.priceToEarningsGrowthRatioTTM, 3) AS peg_ratio,
    ROUND(f.priceToEarningsRatioTTM, 2) AS pe_ratio,
    ROUND(k.returnOnEquityTTM * 100, 1) AS roe_pct,
    ROUND(f.debtToEquityRatioTTM, 2) AS debt_to_equity,
    g.rev_growth_pct,
    ROUND(k.marketCap / 1e6, 2) AS mktcap_m_inr
FROM financial_ratios_ttm f
JOIN key_metrics_ttm k ON f.symbol = k.symbol
JOIN profile p ON f.symbol = p.symbol
JOIN rev_growth g ON f.symbol = g.symbol
WHERE f.priceToEarningsGrowthRatioTTM > 0 AND f.priceToEarningsGrowthRatioTTM < 1.5
  AND f.priceToEarningsRatioTTM > 5 AND f.priceToEarningsRatioTTM < 50
  AND k.returnOnEquityTTM > 0.10
  AND f.debtToEquityRatioTTM >= 0 AND f.debtToEquityRatioTTM < 2.0
  AND k.marketCap > 50000000000
  AND p.exchange IN ('BSE', 'NSE')
QUALIFY ROW_NUMBER() OVER (PARTITION BY f.symbol ORDER BY f.priceToEarningsGrowthRatioTTM ASC) = 1
ORDER BY f.priceToEarningsGrowthRatioTTM ASC LIMIT 30
Run this screen on Ceta Research
The full backtest code (Python + DuckDB) is on GitHub.
References
- Lynch, P. (1989). One Up on Wall Street. Simon & Schuster.
- Bae, K., Stulz, R. & Tan, H. (2008). "Do Local Analysts Know More? A Cross-Country Study of the Performance of Local Analysts and Foreign Analysts." Journal of Financial Economics, 88(3), 581–606. (Analyst coverage and information asymmetry in emerging markets)
- Rouwenhorst, K. (1999). "Local Return Factors and Turnover in Emerging Stock Markets." Journal of Finance, 54(4), 1439–1464.
Data: Ceta Research, FMP financial data warehouse. Universe: BSE + NSE. Quarterly rebalance, equal weight, transaction costs included, 2000–2025. Returns in INR.