Japan Is the Last Net-Net Hunting Ground: 8.85% CAGR, Sharpe 0.42

Japan Is the Last Net-Net Hunting Ground
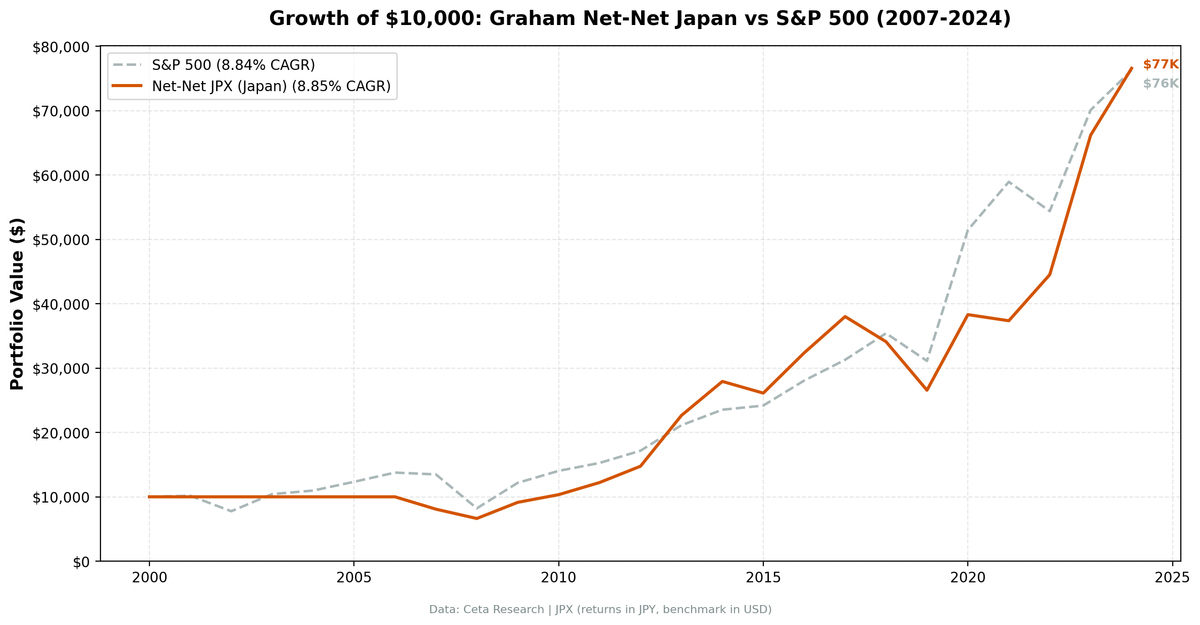
We ran Graham's net-net strategy on Japan's JPX exchange from 2007 to 2024. Over 18 active years, Japan net-nets returned 8.85% CAGR, essentially matching the S&P 500's 8.84%, but with lower drawdown (-33.7% vs -40.3%) and a Sharpe ratio of 0.416 vs 0.411 for the benchmark.
Contents
- Why Japan Has Net-Nets
- Method
- The Screen (Japan)
- Results
- Year-by-Year
- The Consistency Story
- The Cash Period Explanation
- Current Availability
- Why Not Currency-Adjusted?
- Methodology Notes
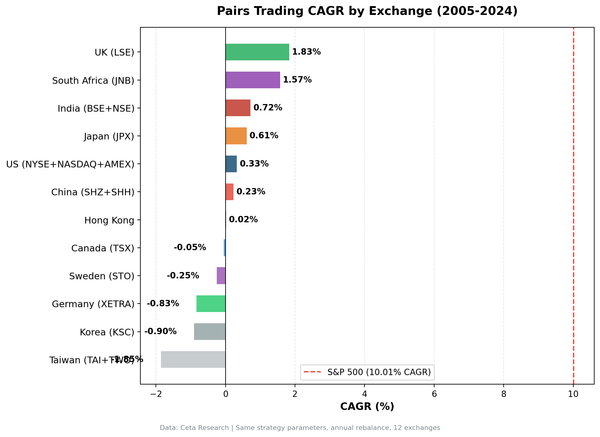
Japan is the one major developed market where the net-net premium still shows up in the data. Here's why it exists and what the numbers look like.
Why Japan Has Net-Nets
Most developed markets rarely produce net-net stocks. The US averages around 25-30 per year. Japan averages over 100 per year. The structural reasons are well-documented:
Corporate governance culture. Japanese companies historically kept large cash balances on the balance sheet, sometimes larger than the company's market cap. Shareholder activism was weak. Management didn't return cash. This created situations where companies traded below their liquid asset value simply because investors didn't believe the cash would ever be returned to them.
Cross-shareholding (keiretsu). Large conglomerates hold minority stakes in each other, reducing the float and limiting price discovery in smaller subsidiaries.
Long-term stagnation. Japan's Nikkei peaked in 1989 and didn't recover to those levels until 2024. Decades of deflation and slow growth meant many profitable companies still traded at depressed valuations.
Abenomics pressure (2012+). The reform push under Shinzo Abe explicitly targeted corporate governance. Companies started unwinding cross-shareholdings and buying back stock. This helped some net-nets resolve, but not fast enough to eliminate them entirely.
Method
- Data source: Ceta Research (FMP financial data warehouse)
- Universe: JPX (Japan Exchange Group), market cap > ¥5B (~$33M USD)
- Period: 2001–2024 (backtest runs from 2001, but JPX data populates from 2007)
- Active years: 2007–2024 (18 invested periods, 6 cash periods 2001-2006)
- Rebalancing: Annual (April), equal weight all qualifying
- Signal: Price < NCAV per share
- Cash rule: Hold cash if fewer than 5 stocks qualify
The Screen (Japan)
-- Japan Net-Net Stocks: price < NCAV per share
SELECT
    k.symbol,
    p.companyName,
    ROUND(s.adjClose, 0) AS price_jpy,
    ROUND(k.grahamNetNetTTM, 0) AS ncav_per_share_jpy,
    ROUND(s.adjClose / k.grahamNetNetTTM, 3) AS price_to_ncav,
    ROUND((k.grahamNetNetTTM - s.adjClose) / k.grahamNetNetTTM * 100, 1) AS discount_pct,
    ROUND(k.marketCap / 1e9, 1) AS mktcap_b_jpy,
    ROUND(k.currentRatioTTM, 2) AS current_ratio
FROM key_metrics_ttm k
JOIN (
    SELECT symbol, adjClose
    FROM stock_eod
    WHERE date >= '2025-01-01'
    QUALIFY ROW_NUMBER() OVER (PARTITION BY symbol ORDER BY date DESC) = 1
) s ON k.symbol = s.symbol
JOIN profile p ON k.symbol = p.symbol
WHERE k.grahamNetNetTTM > 0
    AND s.adjClose > 0
    AND s.adjClose < k.grahamNetNetTTM
    AND k.marketCap > 5000000000
    AND p.exchange = 'JPX'
ORDER BY price_to_ncav ASC
LIMIT 30
Run it on Ceta Research Data Explorer.
Results
| Metric | Net-Net Japan | S&P 500 |
|---|---|---|
| CAGR | 8.85% | 8.84% |
| Total Return (24 yr) | 666% | 663% |
| Max Drawdown | -33.7% | -40.3% |
| Annualized Volatility | 21.0% | 21.3% |
| Sharpe Ratio | 0.416 | 0.411 |
| Sortino Ratio | 1.167 | 0.889 |
| Down Capture | 47.4% | 100% |
| Alpha | +3.0% | — |
| Avg Stocks per Active Year | 27.9 | — |
| Cash Periods | 6 of 24 | — |
The Sortino ratio of 1.167 is the most telling number. The strategy loses less in down years than it makes in up years. Down capture of 47.4% means that when the S&P 500 falls, Japan net-nets fall less than half as much on average. That's unusual for a high-volatility strategy.
Year-by-Year
| Year | Net-Net JPX | SPY | Excess |
|---|---|---|---|
| 2001-2006 | — (cash) | — | — |
| 2007 | -19.2% | -2.0% | -17.2% |
| 2008 | -18.0% | -39.1% | +21.1% |
| 2009 | +37.9% | +48.2% | -10.4% |
| 2010 | +13.1% | +15.3% | -2.2% |
| 2011 | +18.3% | +8.8% | +9.5% |
| 2012 | +20.7% | +12.5% | +8.3% |
| 2013 | +53.5% | +23.1% | +30.4% |
| 2014 | +23.3% | +11.4% | +11.9% |
| 2015 | -6.5% | +2.7% | -9.2% |
| 2016 | +24.0% | +16.1% | +7.9% |
| 2017 | +17.4% | +11.5% | +5.9% |
| 2018 | -10.3% | +13.2% | -23.4% |
| 2019 | -22.1% | -12.1% | -10.0% |
| 2020 | +44.2% | +65.4% | -21.1% |
| 2021 | -2.5% | +14.6% | -17.0% |
| 2022 | +19.2% | -7.7% | +26.9% |
| 2023 | +48.7% | +28.9% | +19.8% |
| 2024 | +15.7% | +8.8% | +6.9% |
The strategy outperformed in 2011-2014 during the Abenomics era (governance reform pressure drove net-net resolution), held up during 2008 (financial crisis hurt US more than Japan's domestically-oriented small caps), and delivered strong returns in 2022-2024 when global investors rediscovered Japanese equities.
The 2018-2021 period was rough, trade war uncertainty, COVID recovery, but the strategy recovered sharply.
The Consistency Story
Japan net-nets had negative years only 5 times out of 18 active years (28% negative rate). The max consecutive loss streak was 2 years. Compare that to US net-nets which had 10 negative years out of 24 (42% negative rate) with a 3-year consecutive loss streak.
The behavioral driver: Japan's net-net universe is less concentrated in distressed-for-a-reason companies. A Japanese company trading below NCAV is often a profitable firm with excess cash that management doesn't distribute. When governance pressure increases or the company itself eventually returns the cash, the discount closes. In the US, net-nets are more often genuinely distressed businesses with operational problems.
The Cash Period Explanation
The strategy shows 6 cash periods from 2001-2006. This isn't because Japan lacked net-net stocks. Japan had over 500 qualifying net-nets in 2002-2005 by our data inspection. The cash periods reflect data coverage: the FMP warehouse had insufficient symbol coverage for Japanese stocks before 2007 to generate reliable backtest results.
From 2007 onward, coverage was sufficient and the backtest runs with 20-30+ qualifying stocks per year.
Current Availability
As of early 2025, Japan's net-net universe has contracted from its post-COVID levels. Tokyo Stock Exchange's corporate governance reforms (2022-2024), requiring listed companies to improve capital efficiency, have pushed many companies to return cash, reducing the number of stocks trading below NCAV. The post-reform universe is smaller but the remaining net-nets may be more "stuck" (harder to resolve).
This is worth monitoring. If Japanese governance reform continues, the structural source of net-net supply may diminish over time.
Why Not Currency-Adjusted?
This backtest uses JPY returns compared against a USD benchmark (SPY). We don't currency-adjust because:
- The NCAV calculation is in JPY (price and financials both in JPY). The net-net signal is currency-neutral.
- For a Japanese investor, these are the actual returns.
- Currency hedging costs would eat into returns and aren't consistently available historically.
A USD investor would layer yen currency exposure on top of these returns. JPY/USD was roughly flat over 2007-2024 (both at ~110-115), so the distortion is limited for this specific period.
Methodology Notes
- 45-day filing lag: Japanese companies file in March (March FY) or later. April rebalance safely uses December and March FY data.
- Market cap threshold: ¥5B (~$33M USD). Standard $1B USD threshold would eliminate virtually all qualifying stocks.
- Return filter: 300% annual cap to remove price data artifacts. Japanese stocks are generally cleaner data than US micro-caps.
Data: FMP financial data warehouse via Ceta Research. JPX, annual rebalance April, equal weight, 2001-2024 (18 active years from 2007). Backtest code: github.com/ceta-research/backtests