Graham Net-Net on US: 25 Years of Data Shows the Premium Has Eroded

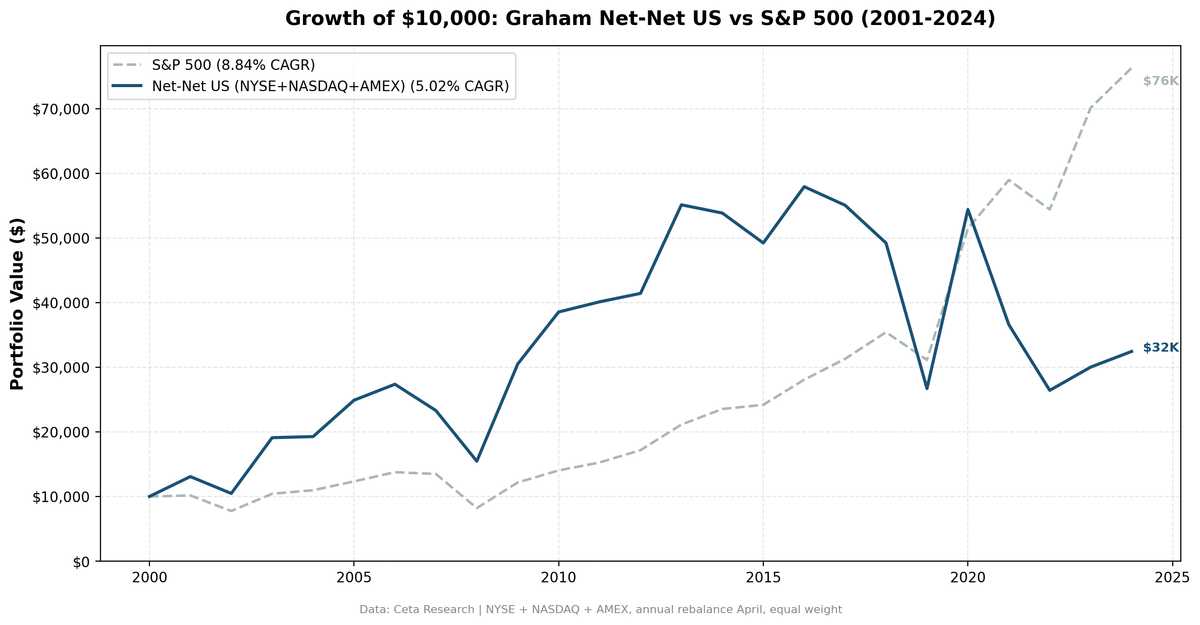
We backtested Graham's net-net strategy on all US exchanges (NYSE, NASDAQ, AMEX) from 2001 to 2024. The result: 5.02% CAGR vs 8.84% for the S&P 500. The premium Graham exploited in the 1930s, and that academics documented into the 1980s, has largely disappeared from US markets.
Contents
- What Is a Net-Net Stock?
- Method
- The Screen
- Results
- Year-by-Year
- What Happened to the Net-Net Premium?
- The Early 2000s Were the Last Good Years
- Data Quality Note
- What Works Now
- Methodology Notes
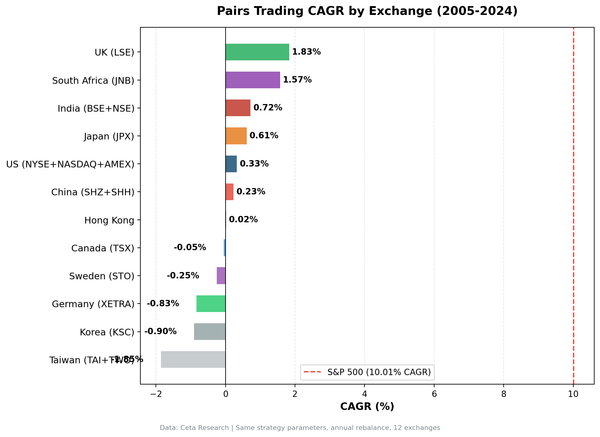
The strategy still works in some markets. Not this one.
What Is a Net-Net Stock?
Benjamin Graham described net-net investing in Security Analysis (1934). The idea: buy stocks trading below their net current asset value per share.
NCAV = Current Assets − Total Liabilities − Preferred Stock (per share)
If a stock trades below NCAV, you're buying the company's liquid assets at a discount. Even if the business earns nothing, the liquidation value alone covers your purchase price.
Graham called these "bargain issues", companies so cheap that no reasonable analysis is needed. The margin of safety is built into the price. By the mid-20th century, he could find hundreds of them on US exchanges.
Method
- Data source: Ceta Research (FMP financial data warehouse)
- Universe: NYSE + NASDAQ + AMEX, market cap > $50M USD
- Period: 2001–2024 (24 years)
- Rebalancing: Annual (April), after December fiscal year filings + 45-day lag
- Signal: Price < NCAV per share (
key_metrics.grahamNetNet) - Cash rule: Hold cash if fewer than 5 stocks qualify
- Benchmark: S&P 500 Total Return (SPY)
NCAV data comes from FMP's pre-computed grahamNetNet field, which is the per-share NCAV figure. The filter is straightforward: adjClose < grahamNetNet. Stocks trading above NCAV, the vast majority, are excluded.
The Screen
-- Current US Net-Net Stocks (price < NCAV per share)
SELECT
 k.symbol,
 p.exchange,
 p.sector,
 ROUND(s.adjClose, 2) AS price,
 ROUND(k.grahamNetNetTTM, 2) AS ncav_per_share,
 ROUND(s.adjClose / k.grahamNetNetTTM, 3) AS price_to_ncav,
 ROUND((k.grahamNetNetTTM - s.adjClose) / k.grahamNetNetTTM * 100, 1) AS discount_pct,
 ROUND(k.marketCap / 1e6, 1) AS mktcap_m_usd
FROM key_metrics_ttm k
JOIN (
 SELECT symbol, adjClose
 FROM stock_eod
 WHERE date >= '2025-01-01'
 QUALIFY ROW_NUMBER() OVER (PARTITION BY symbol ORDER BY date DESC) = 1
) s ON k.symbol = s.symbol
JOIN profile p ON k.symbol = p.symbol
WHERE k.grahamNetNetTTM > 0
 AND s.adjClose > 0.50
 AND s.adjClose < k.grahamNetNetTTM
 AND k.marketCap > 50000000
 AND p.exchange IN ('NYSE', 'NASDAQ', 'AMEX')
ORDER BY price_to_ncav ASC
LIMIT 30
Run it on Ceta Research Data Explorer.
Results
| Metric | Net-Net US | S&P 500 |
|---|---|---|
| CAGR | 5.02% | 8.84% |
| Total Return (24 yr) | 224% | 663% |
| Max Drawdown | -54.4% | -40.3% |
| Annualized Volatility | 38.7% | 21.3% |
| Sharpe Ratio | 0.078 | 0.322 |
| Alpha | -7.4% | — |
| Avg Stocks per Rebalance | 28.5 | — |
| Cash Periods | 0 of 24 | — |
The numbers tell a clear story. Net-nets in the US underperformed the benchmark by 3.81 percentage points per year over 24 years. They did it with nearly twice the volatility and a deeper drawdown. There were stocks available at every rebalance (zero cash periods), which means the underperformance reflects genuine strategy weakness, not opportunity scarcity.
Year-by-Year
| Year | Net-Net | SPY | Excess |
|---|---|---|---|
| 2001 | +30.8% | +1.6% | +29.2% |
| 2002 | -19.9% | -23.6% | +3.7% |
| 2003 | +82.4% | +34.3% | +48.0% |
| 2004 | +0.9% | +5.2% | -4.4% |
| 2005 | +29.2% | +12.4% | +16.8% |
| 2006 | +9.9% | +11.6% | -1.7% |
| 2007 | -14.9% | -2.0% | -12.8% |
| 2008 | -33.6% | -39.1% | +5.5% |
| 2009 | +97.3% | +48.2% | +49.0% |
| 2010 | +26.4% | +15.3% | +11.1% |
| 2011 | +4.1% | +8.8% | -4.7% |
| 2012 | +3.3% | +12.5% | -9.2% |
| 2013 | +33.1% | +23.1% | +10.0% |
| 2014 | -2.3% | +11.4% | -13.7% |
| 2015 | -8.6% | +2.7% | -11.3% |
| 2016 | +17.7% | +16.1% | +1.6% |
| 2017 | -5.0% | +11.5% | -16.5% |
| 2018 | -10.6% | +13.2% | -23.8% |
| 2019 | -45.7% | -12.1% | -33.6% |
| 2020 | +103.8% | +65.4% | +38.4% |
| 2021 | -32.7% | +14.6% | -47.3% |
| 2022 | -27.8% | -7.7% | -20.1% |
| 2023 | +13.6% | +28.9% | -15.3% |
| 2024 | +8.1% | +8.8% | -0.7% |
The pattern is clear. The strategy had its best moments in the early 2000s (2001, 2003, 2005) and during crash-recovery years (2009, 2020). In between, it largely trailed.
The 2019 year stands out: net-nets lost 45.7% in a year the broader market only lost 12%. This reflects the strategy's concentration in distressed micro-caps that were particularly hard-hit as the economy slowed heading into 2020.
What Happened to the Net-Net Premium?
Academic research up to the 1980s found large premiums. Oppenheimer (1986) documented 29% annual returns for US net-nets from 1970-1983, vs 11.5% for the NYSE-AMEX index. Why has this changed?
Arbitrage. More investors hunt for net-nets today. Academic research became widely known. Algorithmic screeners find these stocks as soon as they qualify. The price gap closes faster now than it did in 1970.
Market efficiency in micro-caps. The academic consensus is that US micro-cap markets became more efficient from the 1990s onward. Retail access to data, ETF proliferation, and quantitative screens reduced the number of "unnoticed" cheap stocks.
Quality of remaining net-nets. Today's US net-net candidates are mostly struggling companies in secular decline. Many are retail, energy, or bio-pharma burn-rate companies. They're cheap for reasons that don't resolve. In the 1940s-1970s, net-nets often included healthy companies that were simply overlooked.
The Early 2000s Were the Last Good Years
The strategy's lifetime alpha is almost entirely from 2001-2010. Over those 10 years: - Net-Net CAGR: ~19% (rough calculation from year-by-year returns) - SPY CAGR: ~0.2% (dot-com crash + financial crisis era)
The excess returns were real and substantial. But 2011-2024 tells a different story: net-nets trailed the S&P 500 in 10 of 14 years, including some brutal underperformance in 2018-2022.
Data Quality Note
Net-nets are distressed micro-cap stocks. Price data quality is lower than for large-caps, more corporate actions, reverse splits, and data entry errors in historical records. We apply a 300% annual return cap to remove data artifacts while preserving legitimate crisis-recovery returns (a stock genuinely recovering from distress can return 100-200% in a year).
Without this filter, two stocks. AWH and LMFA, would have contributed 51,142% and 23,187% single-year returns to the portfolio. With the filter, those figures are capped and the affected years show more realistic portfolio returns.
What Works Now
This backtest covers 2001-2024. Net-nets do still exist in US markets, roughly 25-30 qualifying stocks on average per year. But finding them and holding them for a year hasn't beaten the index.
If you want to run this strategy, you'd want to know: Japan is the one market where the numbers still hold up. More on that in the Japan post.
Methodology Notes
- Look-ahead bias prevention: 45-day lag between fiscal year-end and rebalance date. December FY companies → April rebalance.
- Data source:
key_metrics.grahamNetNetis per-share NCAV, pre-computed by FMP from annual balance sheet filings. - Transaction costs: Not included in results above. Micro-cap stocks have higher bid-ask spreads and lower liquidity. Actual returns would be lower.
- Survivorship bias: Exchange membership uses current company profiles. Fully delisted companies that left no data aren't counted.
Part of a Series: Global | Japan
Data: FMP financial data warehouse via Ceta Research. NYSE + NASDAQ + AMEX, annual rebalance April, equal weight, 2001-2024. Backtest code: github.com/ceta-research/backtests