
Industry Leaders Global: Revenue Rankings Tested Across 13 Markets

Contents
- The Strategy
- Results: All 13 Exchanges
- What the Pattern Shows
- Why India Works and Others Don't
- Japan and UK: Notable Markets
- Exchanges Excluded
- Run It Yourself
- Limitations
We ran the same strategy on 13 stock exchanges: take the top 3 companies by revenue in every industry showing 5%+ growth, hold equal weight, rebalance annually. The test ran from 2001 to 2025.
One market beat SPY. Most didn't. The pattern reveals something about when revenue leadership actually matters.

The Strategy
Signal (applied to each exchange separately): 1. Industry average YoY revenue growth >= 5% 2. Company is in the top 3 by current FY revenue within that qualifying industry
Portfolio: Equal weight. Annual July rebalance. Exchange-specific market cap floors.
Benchmark: SPY (8.89% CAGR over the test period), used as a consistent global reference.
Full methodology at backtests/METHODOLOGY.md.
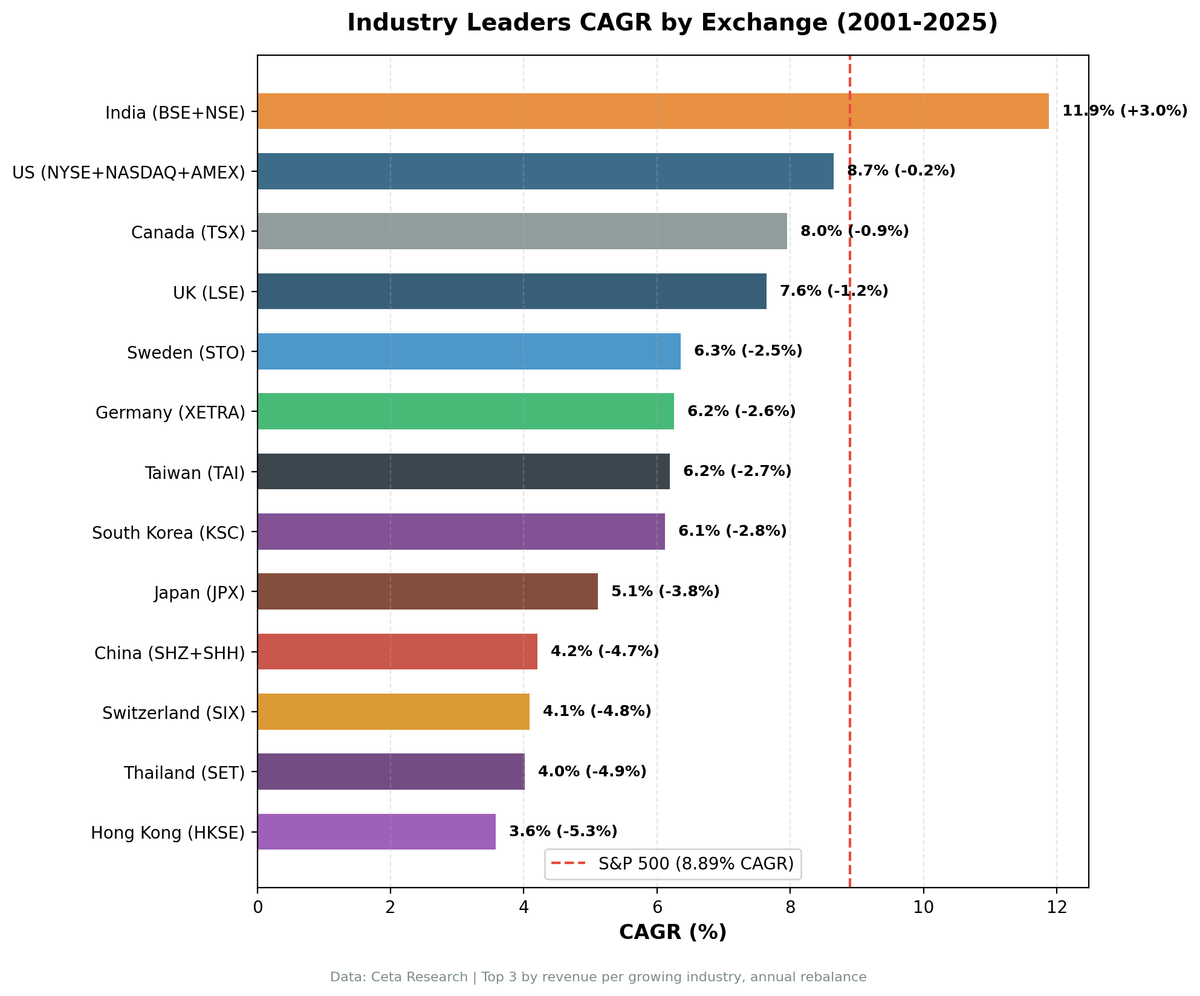
Results: All 13 Exchanges
| Exchange | Market | CAGR | vs SPY | Max DD | Invested |
|---|---|---|---|---|---|
| BSE_NSE | India | 11.88% | +2.98% | -16.2% | 20/24 |
| NYSE+NASDAQ+AMEX | US | 8.65% | -0.25% | -36.2% | 24/24 |
| TSX | Canada | 7.95% | -0.95% | -31.4% | 24/24 |
| LSE | UK | 7.64% | -1.25% | -27.8% | 24/24 |
| XETRA | Germany | 6.25% | -2.65% | -35.6% | 24/24 |
| STO | Sweden | 6.35% | -2.55% | -36.7% | 18/24 |
| KSC | South Korea | 6.12% | -2.77% | -23.5% | 18/24 |
| TAI | Taiwan | 6.19% | -2.70% | -13.9% | 18/24 |
| JPX | Japan | 5.11% | -3.79% | -52.4% | 23/24 |
| SHZ+SHH | China | 4.20% | -4.69% | -59.9% | 24/24 |
| SIX | Switzerland | 4.09% | -4.80% | -46.3% | 24/24 |
| SET | Thailand | 4.01% | -4.88% | -44.6% | 20/24 |
| HKSE | Hong Kong | 3.58% | -5.32% | -30.8% | 24/24 |
CAGR in local currency. SPY benchmark in USD. "Invested" = years with 10+ qualifying stocks.
What the Pattern Shows
India is the outlier. At +2.98% vs SPY, it's the only market that demonstrates the revenue leadership premium the academic literature describes. The margin isn't marginal, it's consistent over 24 years.
The US nearly matches. At -0.25%, the gap is negligible. A strategy holding 229 stocks equally weighted across all growing US industries tracks SPY closely by construction. With that level of diversification, the average outcome is the market average.
Western developed markets trail modestly. Canada (-0.95%), UK (-1.25%), Germany (-2.65%), Sweden (-2.55%) all underperform, but by amounts that are within normal noise for a strategy with this level of diversification. These aren't disasters. They're markets where the revenue leadership signal doesn't generate consistent excess returns.
Asia-Pacific is disappointing. Japan (-3.79%), China (-4.69%), Hong Kong (-5.32%), and Thailand (-4.88%) show the widest gaps. South Korea (-2.77%) and Taiwan (-2.70%) are closer to the middle of the pack.
Taiwan has the lowest max drawdown. -13.92% over 24 years is remarkable risk management for a concentrated tech-export economy. The high cash periods (strategy not invested in 6 of 24 years) explain part of this.
Why India Works and Others Don't
The signal (revenue leadership in growing industries) should theoretically work everywhere. The idea is that dominant companies in growing industries have durable moats. But the data shows it only adds value in India. Why?
Industry concentration. In India, the top 3 companies by revenue often control 50-80% of industry revenue. In Germany, the UK, or Japan, industries are more fragmented. A manufacturing industry with 12 similarly-sized players doesn't produce the same moat effect as one with 3 dominant players.
Growth rates. India's economy grew at 7-9% annually for most of the test period. When the whole economy is expanding at that rate, revenue leaders in growing industries are compounding fast. In Japan (0-1% nominal growth for much of the period), being the revenue leader in a stagnant industry doesn't help.
Capital market efficiency. The US, UK, Germany, and Japan are highly efficient markets. Revenue leadership is publicly known. If it reliably predicted outperformance, it would already be priced in. India's markets, while large, have historically been less covered by institutional research, potentially allowing some pricing inefficiency to persist.
Japan and UK: Notable Markets
Japan (JPX): 5.11% CAGR, -52.4% max drawdown
Japan's revenue leaders trail SPY by 3.79% annually. The large drawdown (-52.44%) reflects Japan's market structure: high cyclicality and significant volatility even for large-cap revenue leaders. Japanese corporate culture historically prioritized revenue and market share over shareholder returns, which may reduce the relationship between revenue leadership and stock performance.
Note: Japanese FY data was verified and confirmed clean. Adjusted close data has some known anomalies in FMP for a subset of symbols, all above the ¥100B market cap threshold used in this backtest.
UK (LSE): 7.64% CAGR, -27.8% max drawdown
UK results are the closest to the US among international markets. At -1.25% vs SPY, the strategy trails modestly with a relatively low max drawdown. UK large-cap revenue leaders in banking, energy, consumer goods, and pharma are globally diversified businesses, which may reduce the domestic revenue-leadership premium.
Exchanges Excluded
ASX (Australia) and SAO (Brazil): Excluded due to confirmed data quality issues in adjusted close prices (split adjustment artifacts that inflate backtest returns). Results aren't reliable.
JNB (South Africa): The strategy held cash in 10 of 24 periods due to insufficient qualifying stocks. With only 14 invested periods and a universe of ~270 stocks, statistical significance is low.
SES (Singapore): Only 17 of 24 periods had qualifying stocks, with fewer than 15 average holdings. Thin universe limits reliability.
Run It Yourself
Current global screen:
WITH latest_rev AS (
 SELECT i.symbol, p.industry, p.exchange, p.companyName,
 i.revenue, i.date AS filing_date,
 ROW_NUMBER() OVER (PARTITION BY i.symbol ORDER BY i.dateEpoch DESC) AS rn
 FROM income_statement i
 JOIN profile p ON i.symbol = p.symbol
 WHERE i.period = 'FY' AND i.revenue > 0
 AND p.industry IS NOT NULL AND p.industry != ''
),
prior_rev AS (
 SELECT i.symbol, i.revenue AS prior_revenue,
 ROW_NUMBER() OVER (PARTITION BY i.symbol ORDER BY i.dateEpoch DESC) AS rn
 FROM income_statement i WHERE i.period = 'FY' AND i.revenue > 0
),
company_growth AS (
 SELECT c.symbol, c.companyName, c.exchange, c.industry,
 c.revenue, p.prior_revenue, c.filing_date,
 (c.revenue - p.prior_revenue) / p.prior_revenue AS rev_growth
 FROM latest_rev c JOIN prior_rev p ON c.symbol = p.symbol
 WHERE c.rn = 1 AND p.rn = 2 AND p.prior_revenue > 0
),
company_filtered AS (
 SELECT cg.*, mc.marketCap FROM company_growth cg
 JOIN key_metrics_ttm mc ON cg.symbol = mc.symbol
 WHERE mc.marketCap > 0
),
industry_agg AS (
 SELECT exchange, industry, COUNT(*) AS n_companies,
 ROUND(AVG(rev_growth) * 100, 2) AS avg_growth_pct
 FROM company_filtered GROUP BY exchange, industry
 HAVING COUNT(*) >= 3 AND AVG(rev_growth) >= 0.05
),
leaders AS (
 SELECT cf.symbol, cf.companyName, cf.exchange, cf.industry,
 ROUND(cf.revenue / 1e9, 2) AS revenue_b,
 ROUND(cf.rev_growth * 100, 2) AS rev_growth_pct,
 ia.avg_growth_pct AS industry_growth_pct,
 ROUND(cf.marketCap / 1e9, 2) AS mktcap_b, cf.filing_date,
 ROW_NUMBER() OVER (PARTITION BY cf.exchange, cf.industry ORDER BY cf.revenue DESC) AS rev_rank
 FROM company_filtered cf JOIN industry_agg ia ON cf.exchange = ia.exchange AND cf.industry = ia.industry
)
SELECT symbol, companyName, exchange, industry, revenue_b,
 rev_growth_pct, industry_growth_pct, mktcap_b, filing_date, rev_rank
FROM leaders WHERE rev_rank <= 3 ORDER BY exchange, industry, rev_rank LIMIT 500
Run this query on Ceta Research Data Explorer
Limitations
Local currency returns vs USD benchmark: Each exchange's portfolio returns are in local currency. The SPY benchmark is in USD. Exchange rate movements aren't reflected in the comparison. A market with 6% CAGR in local currency but 3% annual currency depreciation vs USD would look better here than it performs for a USD investor.
Varying data quality by exchange: FMP financial data quality varies. Some exchanges have thinner coverage in early years (2001-2006). This is most relevant for Thailand, Taiwan, and Korea in the early periods.
Different market cap thresholds: Each exchange uses a market cap threshold calibrated in local currency. This keeps the selectivity roughly consistent but doesn't create perfectly comparable universes.
SPY as universal benchmark: SPY measures US large-cap performance, not global market performance. Using MSCI World or a local index benchmark would give a more market-specific comparison.
Data: Ceta Research (FMP financial data warehouse), July 2001 through July 2025. Returns in local currency per exchange. SPY benchmark in USD. Full methodology: github.com/ceta-research/backtests/blob/main/METHODOLOGY.md.


