
Industry Leaders India: Revenue Rankings in a High-Growth Economy

Contents
- The Strategy
- Methodology
- Results
- What Drives the Outperformance
- Why India Works Where the US Doesn't
- Run It Yourself
- Limitations
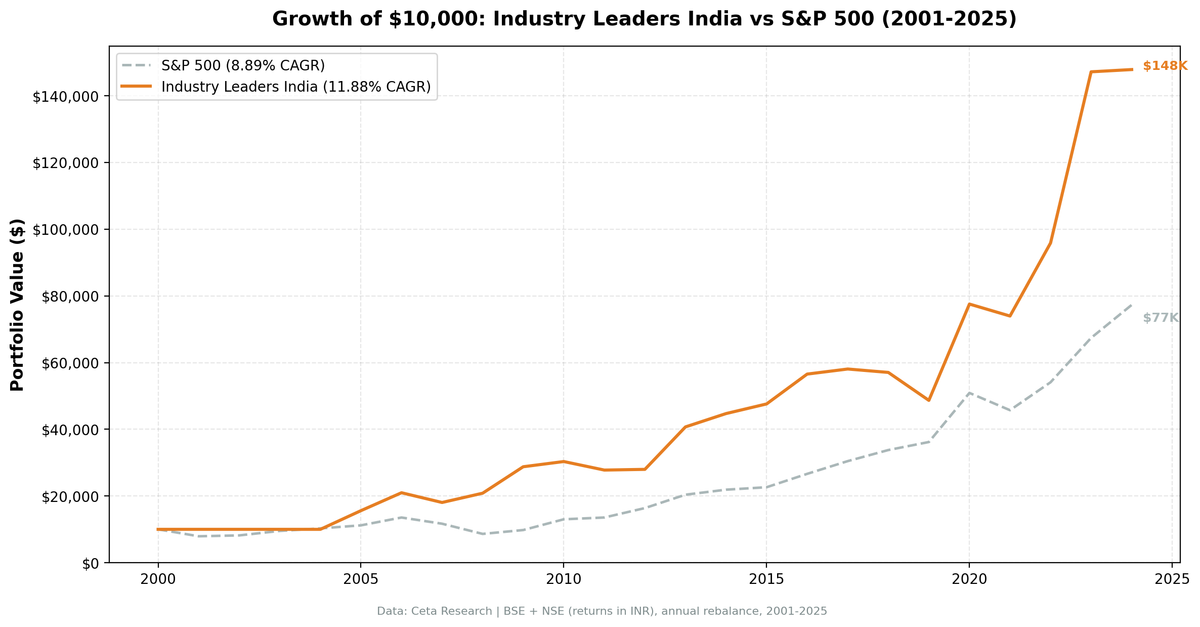
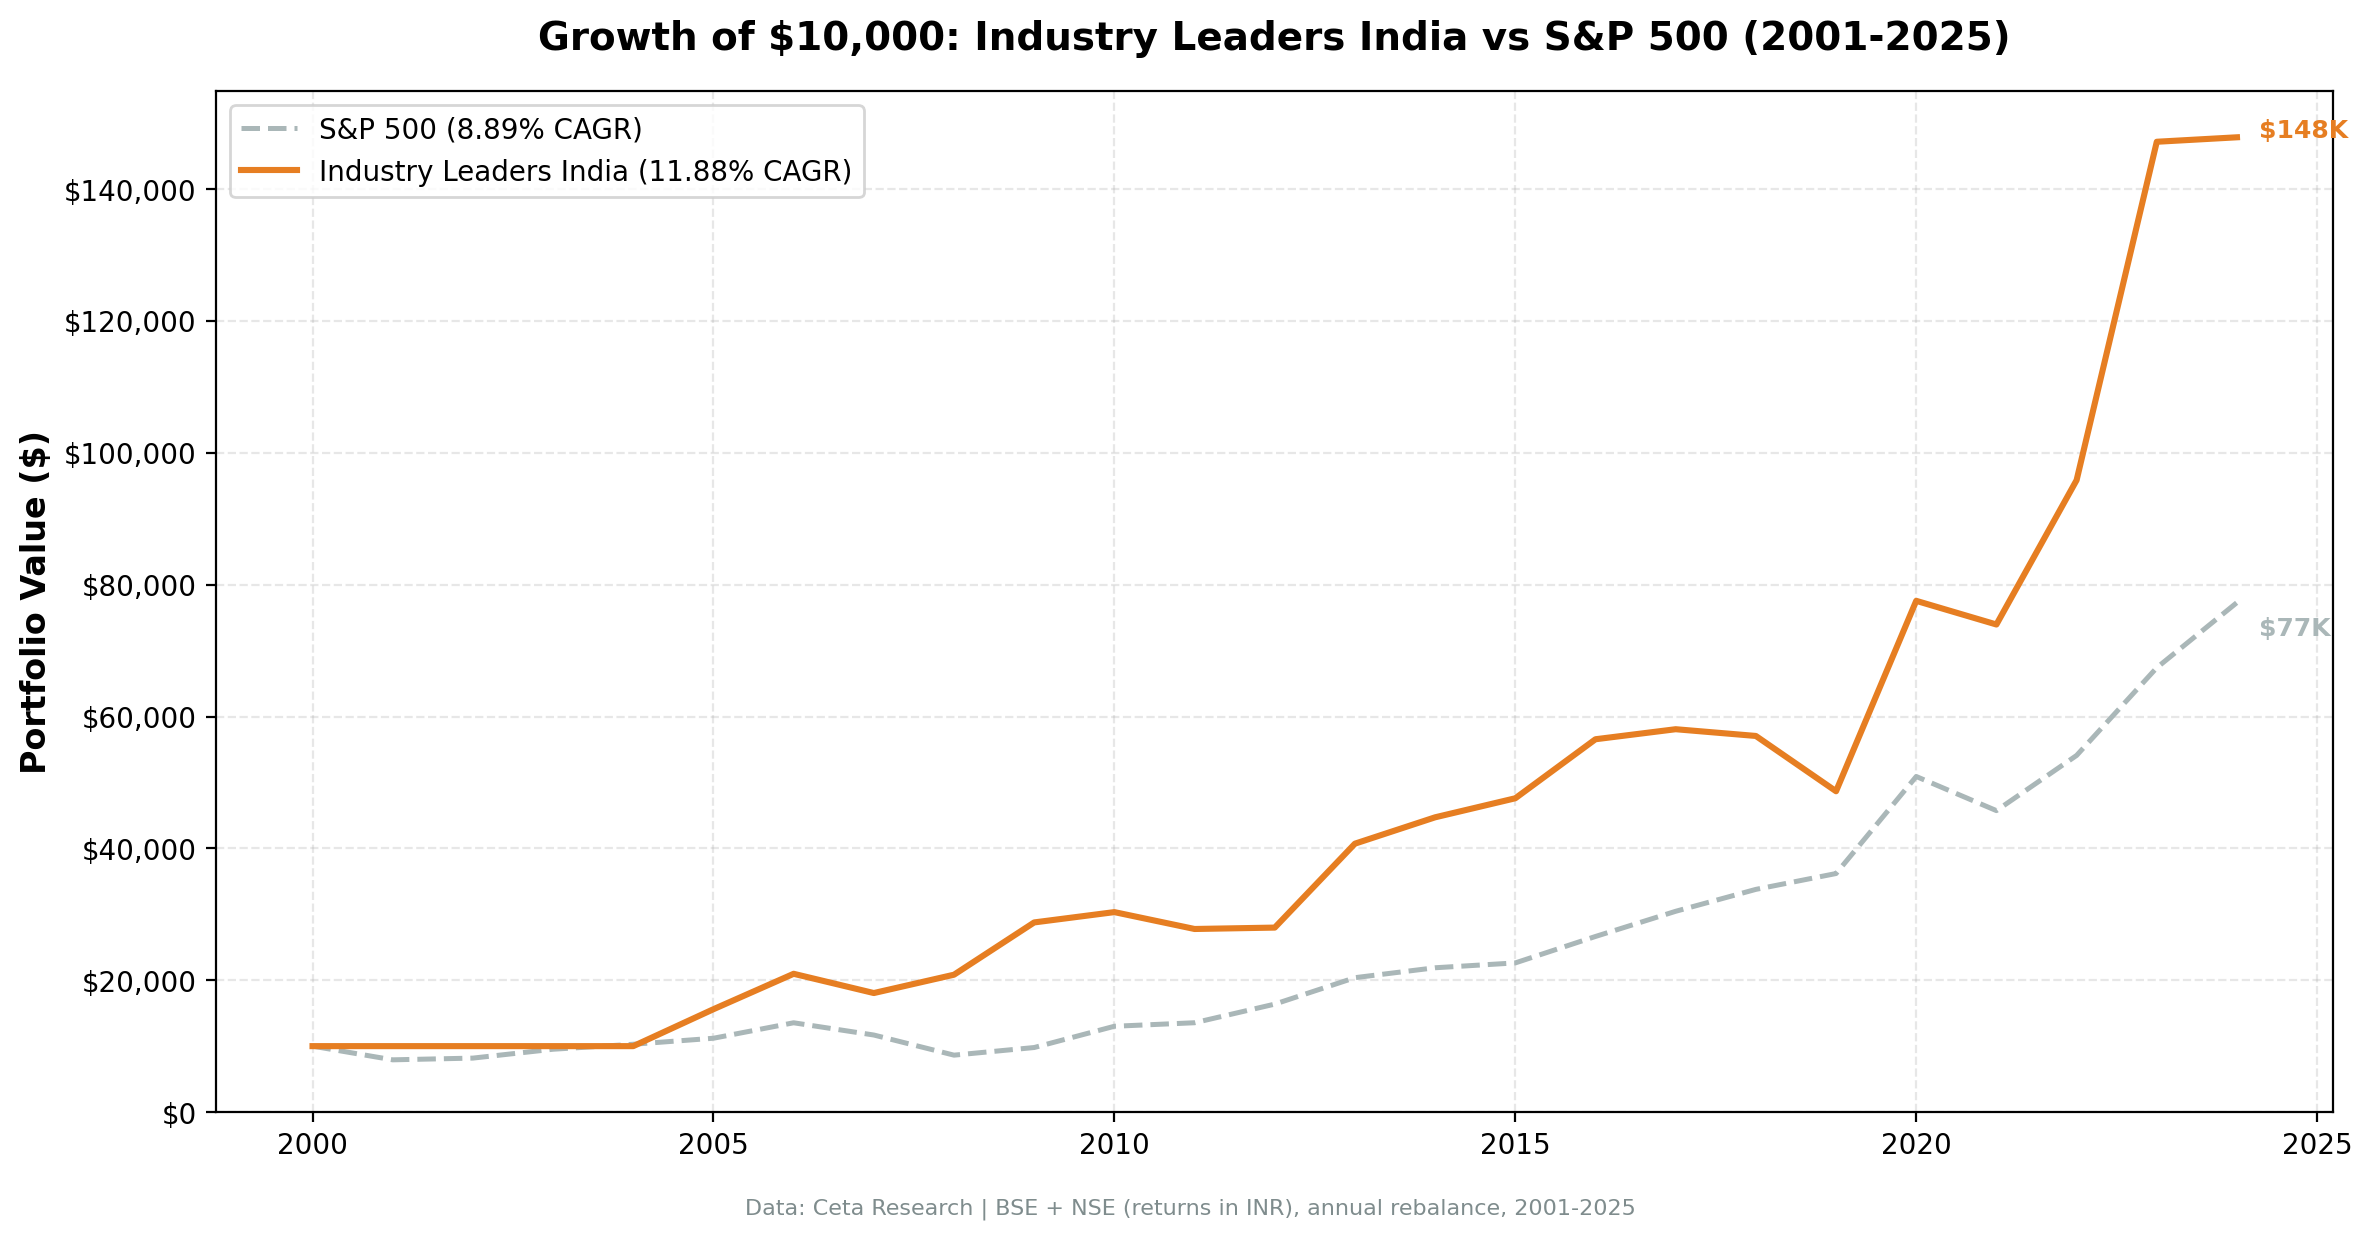
The same strategy that nearly matched SPY on US stocks delivered a genuine edge in India. The logic is identical: hold the top 3 companies by revenue in every industry showing positive growth, rebalance annually, equal weight. On BSE + NSE, it returned 11.88% CAGR over 24 years, beating SPY by 2.98% annually.
The difference isn't the signal. It's the market structure.
The Strategy
Signal: Two conditions at each July rebalance: 1. Industry average YoY revenue growth >= 5% 2. Company is in the top 3 by current FY revenue within that qualifying industry
Universe: BSE and NSE. Market cap floor of ₹10 billion (local currency threshold).
Returns: All portfolio returns are in INR. The SPY benchmark comparison uses USD returns as a global reference.
Rebalancing: Annual (July), using FY financials filed at least 45 days prior.
Methodology
- Universe: BSE + NSE (full exchange coverage, not index-constrained)
- Market cap filter: ₹10B+ at each rebalance date
- Rebalancing: Annual (July), 45-day filing lag
- Industry growth threshold: Average industry YoY revenue growth >= 5%
- Min industry size: 3 companies required per industry
- Leaders per industry: Top 3 by current FY revenue
- Data period: July 2001 through July 2025 (24 annual periods, 20 invested)
- Benchmark: SPY (USD, used as global reference)
- Data source: Ceta Research FMP financial data warehouse
Results
| Metric | Industry Leaders India | SPY |
|---|---|---|
| CAGR | 11.88% (INR) | 8.89% (USD) |
| Total return (24yr) | 1,378.6% | 672.9% |
| $10,000 grows to | $147,857 | $77,292 |
| Max drawdown | -16.2% | — |
| Invested periods | 20 of 24 | — |
Over 24 years, the India portfolio returned 1,378.6% in INR vs 672.9% for SPY in USD. The max drawdown of -16.2% is notably lower than most other exchanges we tested.
The four uninvested periods (2001-2004) reflect a real constraint: in those years, not enough Indian industries met the 5% growth threshold with 3+ qualifying companies above the market cap floor. The strategy held cash rather than force positions.
Starting in July 2005, the strategy was invested every year.
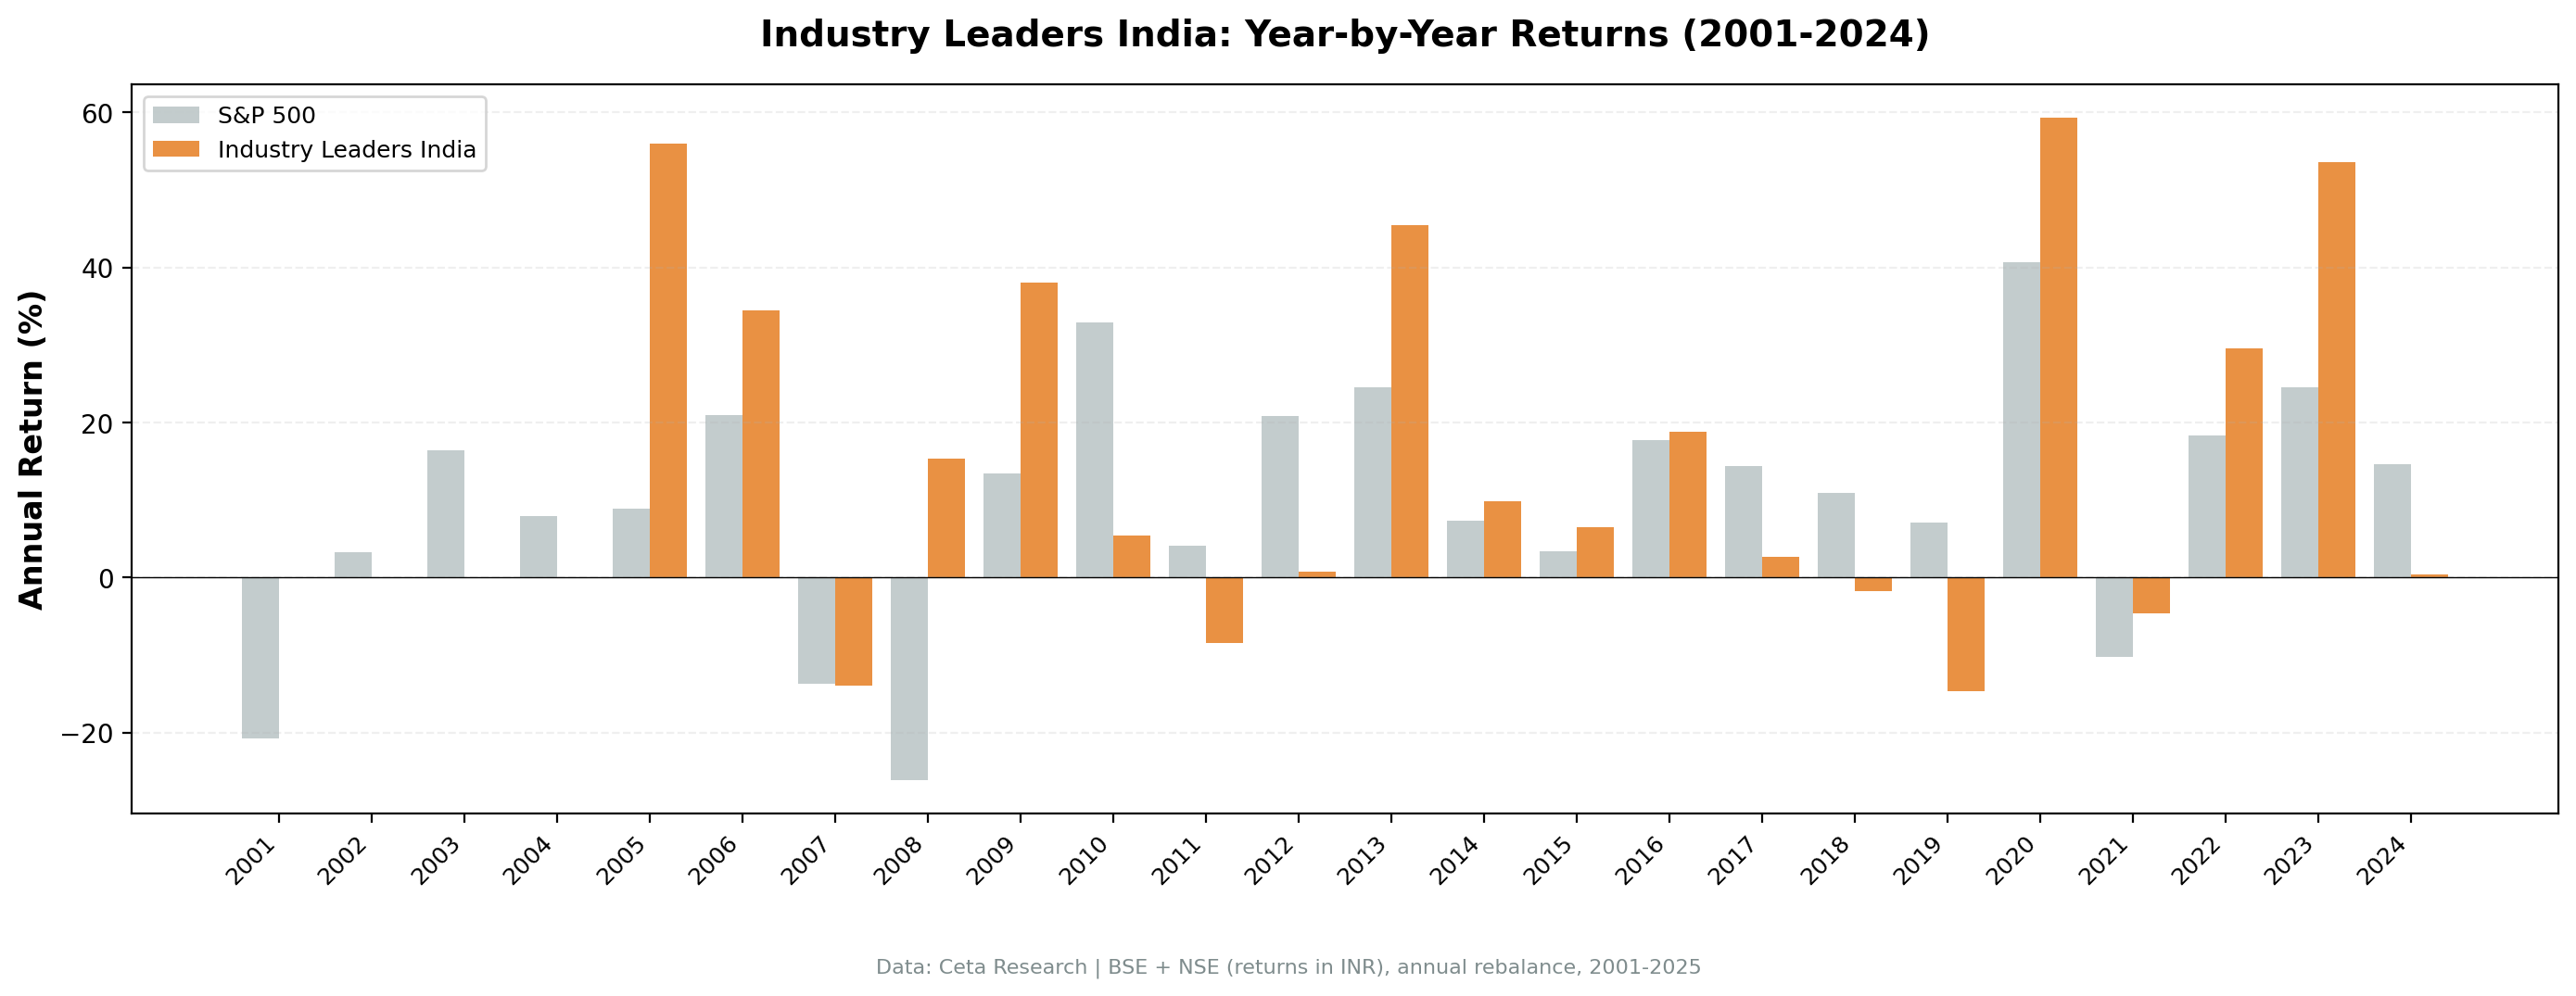
Annual returns:
| Year | Portfolio (INR) | SPY (USD) | Excess |
|---|---|---|---|
| 2001 | 0.00% | -20.77% | — |
| 2002 | 0.00% | +3.29% | — |
| 2003 | 0.00% | +16.44% | — |
| 2004 | 0.00% | +7.94% | — |
| 2005 | +56.01% | +8.86% | +47.15% |
| 2006 | +34.43% | +20.95% | +13.48% |
| 2007 | -13.92% | -13.71% | -0.21% |
| 2008 | +15.41% | -26.14% | +41.55% |
| 2009 | +38.06% | +13.42% | +24.64% |
| 2010 | +5.44% | +32.94% | -27.50% |
| 2011 | -8.44% | +4.10% | -12.54% |
| 2012 | +0.76% | +20.85% | -20.09% |
| 2013 | +45.50% | +24.50% | +21.00% |
| 2014 | +9.82% | +7.38% | +2.44% |
| 2015 | +6.46% | +3.36% | +3.10% |
| 2016 | +18.81% | +17.73% | +1.08% |
| 2017 | +2.69% | +14.34% | -11.65% |
| 2018 | -1.76% | +10.91% | -12.67% |
| 2019 | -14.70% | +7.12% | -21.82% |
| 2020 | +59.35% | +40.68% | +18.67% |
| 2021 | -4.63% | -10.17% | +5.54% |
| 2022 | +29.61% | +18.31% | +11.30% |
| 2023 | +53.55% | +24.60% | +28.95% |
| 2024 | +0.46% | +14.67% | -14.21% |
Years are July-to-July periods. Portfolio returns in INR. SPY returns in USD.
2001-2004 years show 0% because no qualifying stocks met the screen criteria (insufficient industry growth above thresholds). The strategy held cash in those periods.
What Drives the Outperformance
India's economy grew fast, and revenue leaders compounded that growth disproportionately.
When an economy grows at 7-8% annually, the companies at the top of each industry tend to capture a larger share than their smaller competitors. India's corporate landscape in 2005-2015 had genuine concentration in many industries: Tata, Reliance, Infosys, HDFC, Maruti dominated their sectors in ways that few US companies dominate theirs.
2008 bear market defense. The most striking year in the dataset is 2008: the portfolio returned +15.41% in INR while SPY lost 26.14%. The global financial crisis hit India's stock market hard in USD terms, but in local currency, revenue leaders in banking, IT services, consumer goods, and energy held up. Industries that showed 5%+ growth in India during that period were structurally insulated from the US housing collapse.
The recovery years were massive. 2005 (+56%), 2009 (+38%), 2013 (+46%), 2020 (+59%), 2023 (+54%). When India's economy was firing, the revenue leaders in growing industries benefited first and most.
The lag periods are concentrated. The worst underperformance years (2010, 2012, 2017, 2018, 2019) mostly coincide with periods of INR depreciation, domestic policy uncertainty (demonetization in 2016), or periods when US/global indices outran Indian domestic growth. In 2019, the strategy lost 14.70% in INR while SPY gained 7.12%, a major gap.
Why India Works Where the US Doesn't
Three structural differences explain the gap:
Concentrated industries. In many Indian industries, the top 3 companies by revenue control 60-80% of the market. The banking sector, IT services, telecom, auto, oil and gas, these aren't fragmented markets with dozens of competitors. Being #1 by revenue means something different than it does in a market with hundreds of mid-sized competitors.
Higher nominal growth rates. India's GDP grew at 7-9% for most of 2005-2019. Revenue leaders in growing industries were growing their absolute revenues fast, which translated into earnings growth. In a 3-4% GDP growth environment, revenue growth matters less for differentiation.
Less competitive pressure. In the US, a software company that grows to $10B revenue faces 20 VC-backed challengers within 3 years. In India, the regulatory environment, capital requirements, and infrastructure barriers create more durable moats for established revenue leaders.
Run It Yourself
Current screen (India, BSE + NSE):
WITH latest_rev AS (
 SELECT i.symbol, p.industry, p.exchange, p.companyName,
 i.revenue, i.date AS filing_date,
 ROW_NUMBER() OVER (PARTITION BY i.symbol ORDER BY i.dateEpoch DESC) AS rn
 FROM income_statement i
 JOIN profile p ON i.symbol = p.symbol
 WHERE i.period = 'FY' AND i.revenue > 0
 AND p.industry IS NOT NULL AND p.industry != ''
 AND p.exchange IN ('BSE', 'NSE')
),
prior_rev AS (
 SELECT i.symbol, i.revenue AS prior_revenue,
 ROW_NUMBER() OVER (PARTITION BY i.symbol ORDER BY i.dateEpoch DESC) AS rn
 FROM income_statement i WHERE i.period = 'FY' AND i.revenue > 0
),
company_growth AS (
 SELECT c.symbol, c.companyName, c.exchange, c.industry,
 c.revenue, p.prior_revenue, c.filing_date,
 (c.revenue - p.prior_revenue) / p.prior_revenue AS rev_growth
 FROM latest_rev c JOIN prior_rev p ON c.symbol = p.symbol
 WHERE c.rn = 1 AND p.rn = 2 AND p.prior_revenue > 0
),
company_filtered AS (
 SELECT cg.*, mc.marketCap FROM company_growth cg
 JOIN key_metrics_ttm mc ON cg.symbol = mc.symbol
 WHERE mc.marketCap >= 10000000000
),
industry_agg AS (
 SELECT industry, COUNT(*) AS n_companies,
 ROUND(AVG(rev_growth) * 100, 2) AS avg_growth_pct
 FROM company_filtered GROUP BY industry
 HAVING COUNT(*) >= 3 AND AVG(rev_growth) >= 0.05
),
leaders AS (
 SELECT cf.symbol, cf.companyName, cf.exchange, cf.industry,
 ROUND(cf.revenue / 1e9, 2) AS revenue_b,
 ROUND(cf.rev_growth * 100, 2) AS rev_growth_pct,
 ia.avg_growth_pct AS industry_growth_pct,
 ROUND(cf.marketCap / 1e9, 2) AS mktcap_b, cf.filing_date,
 ROW_NUMBER() OVER (PARTITION BY cf.industry ORDER BY cf.revenue DESC) AS rev_rank
 FROM company_filtered cf JOIN industry_agg ia ON cf.industry = ia.industry
)
SELECT symbol, companyName, exchange, industry, revenue_b,
 rev_growth_pct, industry_growth_pct, mktcap_b, filing_date, rev_rank
FROM leaders WHERE rev_rank <= 3 ORDER BY industry, rev_rank LIMIT 300
Run this query on Ceta Research Data Explorer
Run the full backtest:
git clone https://github.com/ceta-research/backtests.git
cd backtests
pip install -r requirements.txt
python3 industry-leader/backtest.py --preset india --output results_india.json --verbose
Limitations
Currency mix in benchmark comparison: Portfolio returns are in INR. SPY is USD. A period where INR depreciated (as in 2013 or 2018) will show portfolio underperformance in this comparison that partly reflects currency, not strategy.
Cash periods (2001-2004): The strategy held no positions in the first four years. This inflates effective CAGR by starting from a smaller base, but also means the early years are uninformative about strategy performance.
India-specific data coverage: FMP financial data for Indian markets is comprehensive for large-caps, but mid-cap coverage from 2001-2007 may be thinner. This affects which companies are visible in early rebalance windows.
Market cap threshold in INR: The ₹10B floor is applied in local currency. In 2001, ₹10B was roughly $200M. In 2025, the same floor is roughly $120M due to INR appreciation. The effective selectivity of the filter shifts over time.
Survivorship bias: FMP includes delisted stocks, which reduces survivorship bias, but it's not fully verifiable for early-period Indian data.
Data: Ceta Research (FMP financial data warehouse), July 2001 through July 2025. Portfolio returns in INR. SPY benchmark in USD. Full methodology: github.com/ceta-research/backtests/blob/main/METHODOLOGY.md.


