
Low Volatility Quality on Canadian Stocks: 9.7% CAGR, +4.6% vs TSX
Low-vol quality stocks on the TSX returned 9.68% CAGR, beating the TSX Composite by +4.60% annually from 2000 to 2025. 0.645 Sharpe ratio, down capture of 39.2%, max drawdown -29.70% vs -41.58%.

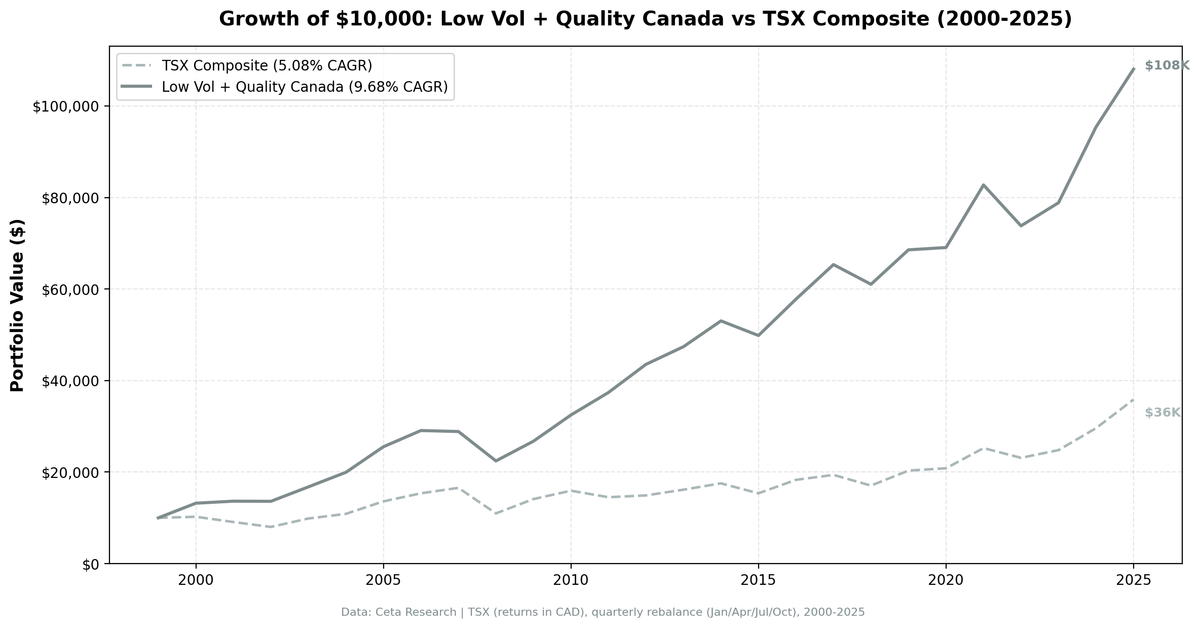
Canada delivered strong risk-adjusted results with both absolute and excess returns. Low-vol quality stocks on the TSX returned 9.68% CAGR from 2000 to 2025 with a 0.645 Sharpe ratio, beating the TSX Composite by +4.60% annually. The portfolio captured 87.0% of the TSX's upside and only 39.2% of its downside, with zero cash periods across the entire 25-year backtest.
Contents
- Method
- The Screen
- Results
- When It Works
- When It Struggles
- Full Annual Returns
- Limitations
- Part of a Series
- Run It Yourself
- Takeaway
- References
Zero cash periods. The screen always found enough qualifying stocks. Canada's natural tilt toward banks, utilities, telecoms, and pipelines creates a deep, reliable quality universe that never runs dry.
Data: FMP financial data warehouse, 2000–2025. Updated March 2026.
Method
| Parameter | Value |
|---|---|
| Universe | TSX (Toronto Stock Exchange) |
| Filters | ROE > 10%, Operating Margin > 10% |
| Ranking | 252-day realized volatility, ascending |
| Rebalancing | Quarterly (January, April, July, October) |
| Max positions | 30 stocks, equal weight |
| Cash rule | Fewer than 10 qualifying stocks |
| Market cap | > C$500M (~$362M USD) |
| Min trading days | >= 200 in 14-month window |
| Data source | FMP via Ceta Research warehouse |
| Benchmark | TSX Composite |
| Execution | Next-day close (MOC) |
| Period | 2000-2025 (25.8 years, 103 quarterly periods) |
For the full methodology and research context, see our US flagship post.
The Screen
-- Low Volatility Quality Canada (TSX) Screen
-- Run at: cetaresearch.com/data-explorer

SELECT
    k.symbol,
    p.companyName,
    ROUND(k.returnOnEquityTTM * 100, 2) AS roe_pct,
    ROUND(f.operatingProfitMarginTTM * 100, 2) AS opm_pct,
    ROUND(p.marketCap / 1e9, 2) AS mktcap_b_cad
FROM key_metrics_ttm k
JOIN financial_ratios_ttm f ON k.symbol = f.symbol
JOIN profile p ON k.symbol = p.symbol
WHERE k.returnOnEquityTTM > 0.10
    AND f.operatingProfitMarginTTM > 0.10
    AND p.marketCap > 500e6
    AND p.exchange IN ('TSX')
  AND p.isFund = false
  AND p.isEtf = false
  AND p.isActivelyTrading = true
QUALIFY ROW_NUMBER() OVER (PARTITION BY p.companyName
                           ORDER BY p.averageVolume DESC) = 1
ORDER BY p.marketCap DESC
LIMIT 30
This produces the quality universe. The full strategy ranks these candidates by trailing 252-day volatility (computed from daily returns) and selects the 30 lowest-volatility names.
Try the quality screen on Ceta Research
Results
| Metric | Low Vol + Quality | TSX Composite |
|---|---|---|
| CAGR | 9.68% | 5.08% |
| Total Return | 980.49% | 258.47% |
| Max Drawdown | -29.70% | -41.58% |
| Annualized Volatility | 11.14% | 15.55% |
| Sharpe Ratio | 0.645 | 0.166 |
| Sortino Ratio | 1.006 | 0.224 |
| Calmar Ratio | 0.326 | 0.122 |
| VaR (95%) | -5.44% | -13.84% |
| Beta | 0.544 | 1.0 |
| Alpha | 5.78% | -- |
| Up Capture | 87.04% | -- |
| Down Capture | 39.22% | -- |
| Win Rate | 56.31% | -- |
| Cash Periods | 0 of 103 | -- |
| Avg Stocks | 29.5 | -- |
$10,000 invested in 2000 grew to $108,049 in the low-vol quality portfolio vs $35,847 in the TSX Composite. The portfolio delivered +4.60% annual excess return while running at 28% less volatility. Max drawdown was -29.70% vs -41.58% for the benchmark.
The Sharpe ratio of 0.645 is nearly 4x the TSX Composite's 0.166. That's exceptional risk-adjusted outperformance. Canada's low-vol quality stocks delivered strong absolute returns with remarkably low risk relative to the local market.
The 0.544 beta tells the same story. The portfolio moves about half as much as the TSX. The VaR of -5.44% means that in the worst 5% of quarters, you'd expect to lose less than 6%. The TSX Composite's VaR is more than double that at -13.84%.
When It Works
Bear markets and market stalls. The TSX low-vol quality portfolio shines when the broader Canadian market falls or stalls out.
| Year | Low Vol + Quality | TSX Composite | Excess |
|---|---|---|---|
| 2000 | +32.0% | +2.4% | +29.6% |
| 2011 | +15.1% | -8.9% | +24.1% |
| 2001 | +3.4% | -11.2% | +14.6% |
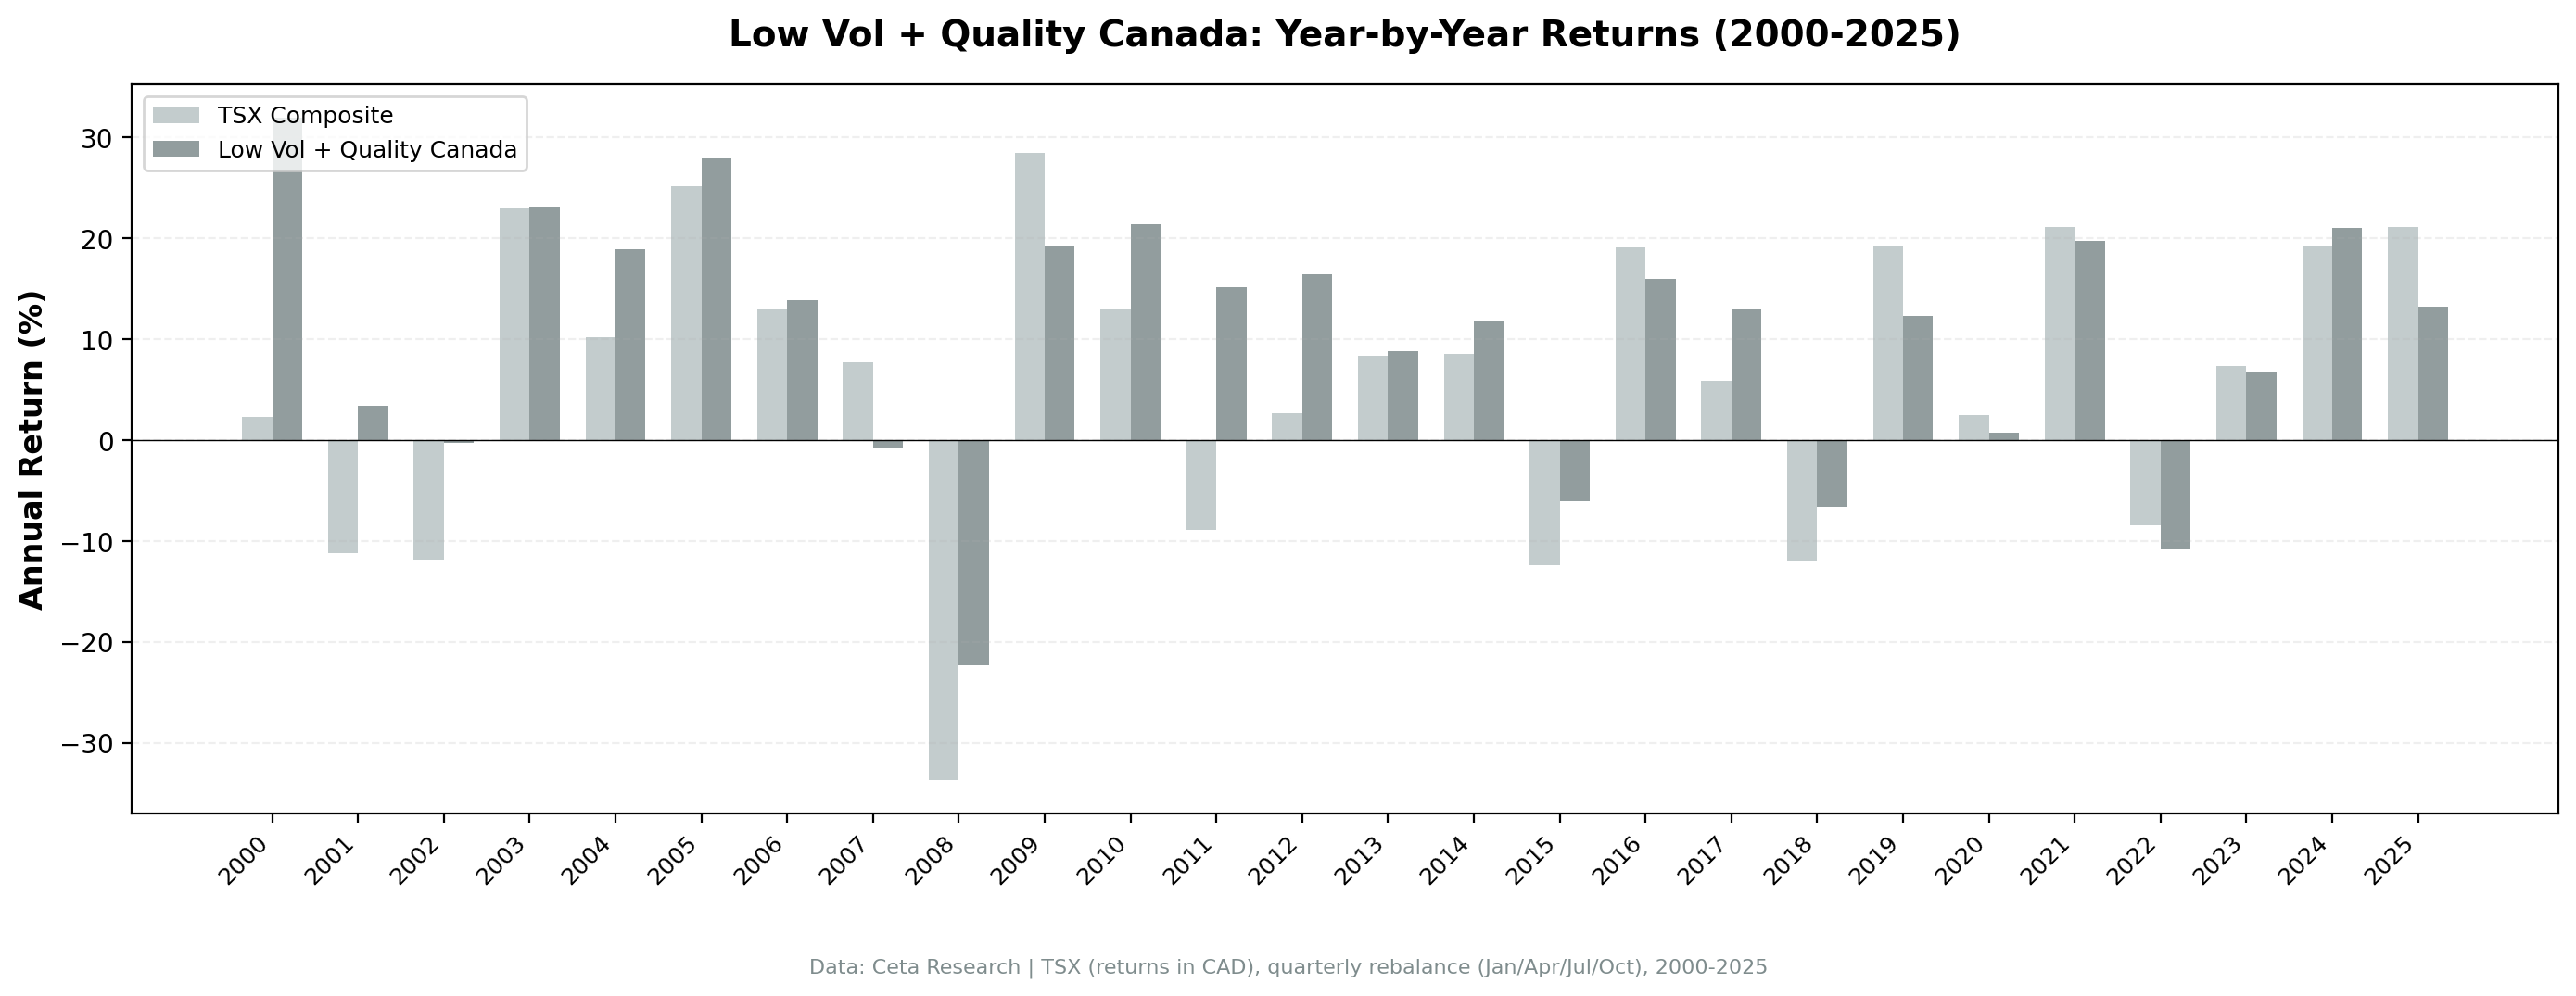
2000 was the biggest outperformance year: +32.0% vs just +2.4% for the TSX Composite, a +29.6% excess. The dot-com bear crushed growth and tech names, but the TSX's commodity and financial base kept the index roughly flat. The low-vol quality portfolio, tilted toward defensive banks, utilities, and telecoms, surged +32.0%. This is the strategy at its best: big absolute gains while the market goes nowhere.
2011 delivered +24.1% excess during the European debt crisis. Risk assets sold off globally and the TSX fell -8.9%, dragged down by energy and materials. The low-vol quality portfolio's defensive tilt held up, gaining +15.1% while the benchmark dropped. 2001 shows the same pattern in the post dot-com and 9-11 selloff: the portfolio gained +3.4% while the TSX fell -11.2%, a +14.6% excess.
The strategy's 39.2% down capture ratio is the mechanism here. In the average TSX decline, the portfolio absorbed less than 40% of the loss. Over 25 years, that protection compounds into substantial risk-adjusted outperformance.
When It Struggles
Resource booms and strong cyclical rallies. When energy and materials surge, low-vol quality stocks lag.
| Year | Low Vol + Quality | TSX Composite | Excess |
|---|---|---|---|
| 2009 | +19.2% | +28.5% | -9.3% |
| 2007 | -0.7% | +7.8% | -8.5% |
| 2025 | +13.2% | +21.1% | -7.9% |
2009 was the biggest lag at -9.3% as the TSX Composite snapped back +28.5% after the financial crisis. The recovery favored the most beaten-down cyclical and resource stocks, exactly the names the quality filter screens out. The portfolio still gained a healthy +19.2%, but couldn't match the market's cyclical rebound.
2007 and 2025 show the same story from different eras. 2007 was the late innings of the mid-2000s resource boom: the TSX rose +7.8% on commodity strength while the portfolio slipped -0.7%, an -8.5% excess. 2025's commodity-led TSX rally lifted the index +21.1% while the portfolio gained +13.2%, lagging by -7.9%. In each case the portfolio held up on defense but ceded ground when cyclicals led.
The win rate of 56.31% reflects the strategy's consistent edge. The portfolio beats the TSX Composite in more than half of all quarters. When it loses, the magnitude is modest (typical -3% to -9% lag in strong commodity years). When it wins, the magnitude is larger (2000's +29.6% excess, 2011's +24.1%). That asymmetry drives +4.60% annual excess return over 25 years.
Full Annual Returns
| Year | Low Vol + Quality | TSX Composite | Excess |
|---|---|---|---|
| 2000 | +32.0% | +2.4% | +29.6% |
| 2001 | +3.4% | -11.2% | +14.6% |
| 2002 | -0.2% | -11.9% | +11.6% |
| 2003 | +23.2% | +23.1% | +0.1% |
| 2004 | +18.9% | +10.2% | +8.7% |
| 2005 | +28.0% | +25.1% | +2.9% |
| 2006 | +13.9% | +12.9% | +0.9% |
| 2007 | -0.7% | +7.8% | -8.5% |
| 2008 | -22.3% | -33.7% | +11.4% |
| 2009 | +19.2% | +28.5% | -9.3% |
| 2010 | +21.4% | +12.9% | +8.5% |
| 2011 | +15.1% | -8.9% | +24.1% |
| 2012 | +16.4% | +2.7% | +13.7% |
| 2013 | +8.9% | +8.4% | +0.5% |
| 2014 | +11.9% | +8.5% | +3.4% |
| 2015 | -6.0% | -12.4% | +6.4% |
| 2016 | +15.9% | +19.1% | -3.2% |
| 2017 | +13.1% | +5.9% | +7.2% |
| 2018 | -6.6% | -12.0% | +5.5% |
| 2019 | +12.3% | +19.2% | -6.8% |
| 2020 | +0.7% | +2.5% | -1.8% |
| 2021 | +19.8% | +21.2% | -1.4% |
| 2022 | -10.8% | -8.4% | -2.4% |
| 2023 | +6.8% | +7.3% | -0.5% |
| 2024 | +21.0% | +19.3% | +1.7% |
| 2025 | +13.2% | +21.1% | -7.9% |
Limitations
Returns are in CAD. The Canadian dollar has ranged between parity and C$1.45 per USD over this period. Currency impact is lower than for emerging markets but still present for US-based investors.
Sector concentration. Canada's quality universe tilts heavily toward financials (Big Five banks), utilities, and telecoms. Regulatory changes in any of these sectors could hit the portfolio disproportionately. The Big Five banks alone can represent a large fraction of qualifying stocks.
Resource sector exclusion. The quality filter (ROE > 10%, OPM > 10%) excludes many Canadian resource companies, especially during commodity downturns. This creates an implicit structural underweight to energy and materials. In commodity booms, the portfolio lags. In busts, it protects.
Transaction costs. Size-tiered model applied (0.1% for large caps, 0.3% for mid caps, 0.5% for small caps). Canadian equity trading costs are generally low for large-cap names, which dominate this portfolio.
Local benchmark strength. The TSX Composite's 5.08% CAGR over this period reflects commodity exposure and the 2008-2015 resource bear market. The +4.60% excess return is substantial in this context.
Part of a Series
Low Volatility + Quality on US Stocks (6.53% CAGR, 0.484 Sharpe, -1.5% vs S&P 500) is the flagship post with full methodology, research context, and the complete 14-exchange comparison table.
Low Volatility + Quality on Indian Stocks (16.89% CAGR, +5.8% vs Sensex) delivered the strongest absolute and excess returns of any market tested.
Run It Yourself
Live screen:
python3 low-vol-quality/screen.py --preset canada
Backtest:
python3 low-vol-quality/backtest.py --preset canada --output results/returns_Canada.json --verbose
Code: github.com/ceta-research/backtests/tree/main/low-vol-quality
Takeaway
Canada delivered 9.68% CAGR with a 0.645 Sharpe ratio, beating the TSX Composite by +4.60% annually. The TSX's structural composition makes it a natural fit for this strategy. Banks, utilities, telecoms, and pipelines pass quality screens easily, and these sectors are inherently low-volatility. The result is a portfolio that never sat in cash, averaged 29.5 stocks per quarter, and ran at half the benchmark's beta.
The absolute excess return of +4.60% is substantial. The risk-adjusted case is even stronger: 0.645 Sharpe vs 0.166 for the TSX Composite. A portfolio that cuts max drawdown from -41.6% to -29.7%, reduces volatility by nearly a third, and captures only 39% of market downside while participating in 87% of upside delivered both capital preservation and wealth accumulation.
Boring Canadian stocks doing boring Canadian things. That's the point.
References
- Baker, M., Bradley, B. & Wurgler, J. (2011). "Benchmarks as Limits to Arbitrage: Understanding the Low-Volatility Anomaly." Financial Analysts Journal, 67(1), 40-54.
- Ang, A., Hodrick, R., Xing, Y. & Zhang, X. (2006). "The Cross-Section of Volatility and Expected Returns." Journal of Finance, 61(1), 259-299.
- Frazzini, A. & Pedersen, L. (2014). "Betting Against Beta." Journal of Financial Economics, 111(1), 1-25.
- Novy-Marx, R. (2013). "The Other Side of Value: The Gross Profitability Premium." Journal of Financial Economics, 108(1), 1-28.
Data: Ceta Research, 2000-2025. Full methodology: Methodology
Past performance does not guarantee future results. This is educational content, not investment advice.

