
12-Month Momentum on UK Stocks: 25 Years of Consistent Alpha

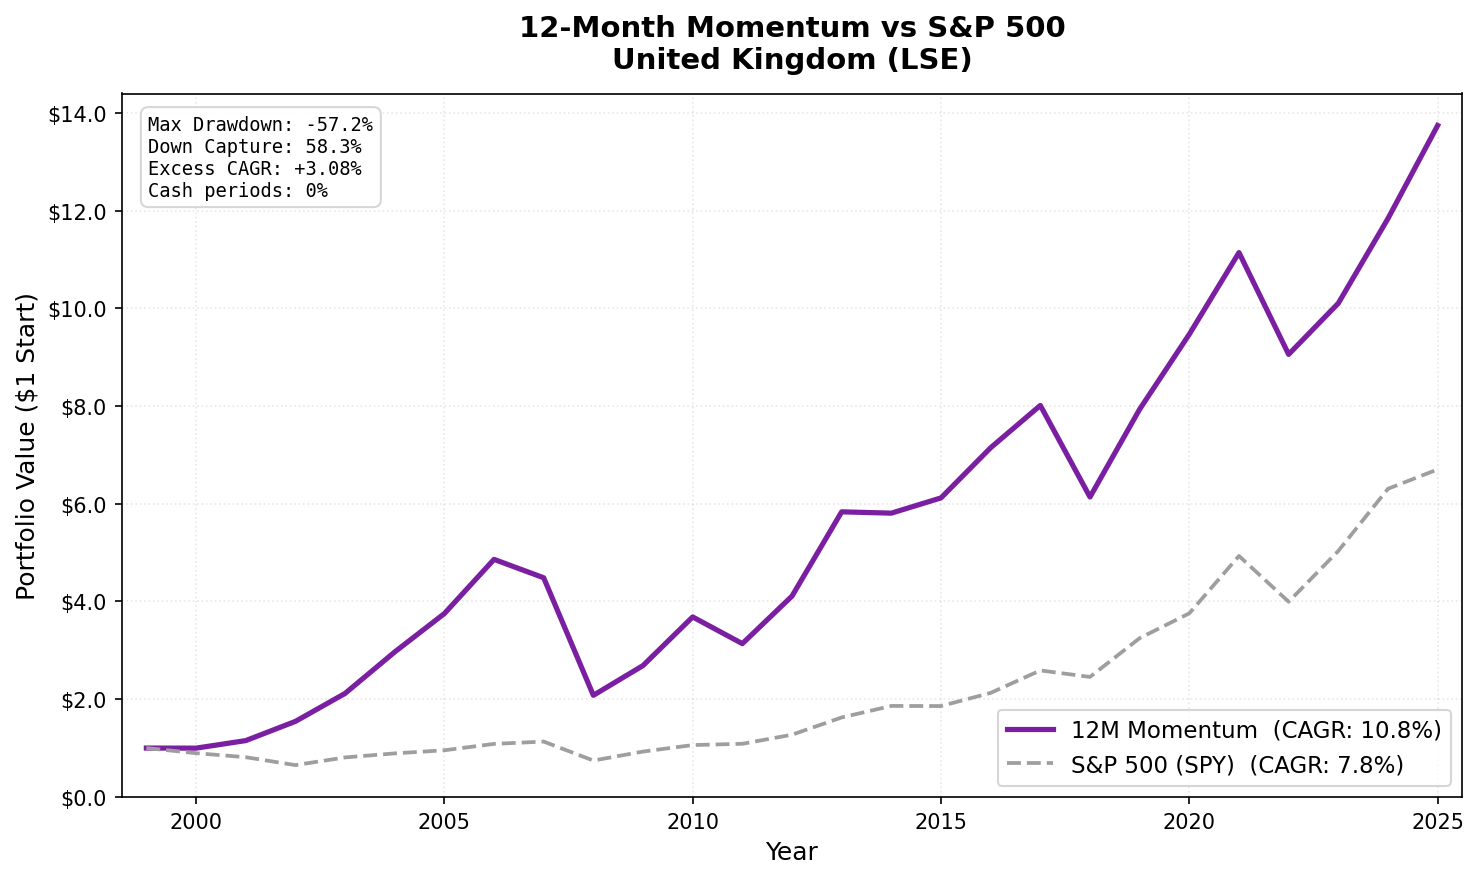
The UK equity market doesn't generate as much momentum research attention as the US or India. That's a gap. Pure 12-month price momentum on LSE stocks from 2000 to 2025 delivered 10.82% annually, 3.08% above the SPY benchmark, with a down capture of 58.29%. The portfolio fell 42% less than SPY in market downturns, on average, while outperforming over the full period. That combination of excess return and downside protection is relatively rare.
Contents
- Method
- What We Found
- Backtest Methodology
- Why the UK Works
- Limitations
- Takeaway
- Part of a Series
- References
- Run This Screen Yourself
Method
| Parameter | Value |
|---|---|
| Universe | LSE (London Stock Exchange) |
| Rebalancing | Semi-annual (January, July) |
| Signal | 12-month return, skip last month (12M-1M) |
| Selection | Top 30 by momentum, equal weight |
| Cash rule | Fewer than 10 qualifying stocks |
| Data source | FMP via Ceta Research warehouse |
| Benchmark | S&P 500 (SPY) |
| Period | 2000–2025 |
| Market cap filter | > £500M (~$625M USD, point-in-time, 45-day lag) |
0% of semi-annual periods went to cash. The LSE universe is consistently deep enough to find 30 qualifying momentum stocks.
What We Found
25-year summary (2000–2025):
| Metric | 12M Momentum | S&P 500 (SPY) |
|---|---|---|
| CAGR | 10.82% | 7.75% |
| Total Return | 1,274.3% | 570.3% |
| Sharpe Ratio | 0.350 | 0.382 |
| Max Drawdown | -57.24% | -36.65% |
| Down Capture | 58.29% | 100% |
| Up Capture | 115.19% | 100% |
| Cash Periods | 0 of 51 (0%) |
The Sharpe of 0.350 is close to SPY's 0.382 but the CAGR is 3 points higher. The difference is the down capture. SPY's Sharpe is high partly because it hasn't had catastrophic drawdowns relative to its return. The UK momentum strategy takes a similar approach, 58.29% down capture means that in bad markets, this portfolio falls less than the index, keeping the drawdown profile manageable.
$1 invested in UK momentum in 2000 became $13.7 by 2025. The same dollar in SPY became $6.7. The difference compounds from consistent outperformance, not from lottery-style wins.
Year-by-year standouts:
| Year | 12M Momentum | SPY | Notes |
|---|---|---|---|
| 2001 | +15.5% | -9.2% | Uncorrelated to US downturn |
| 2002 | +34.1% | -19.9% | Best relative year |
| 2003 | +37.1% | +24.1% | Post-bear market surge |
| 2004 | +40.1% | +10.2% | UK outperformance |
| 2008 | -53.6% | -34.3% | Worst year — global crisis |
| 2010 | +37.0% | +14.3% | Recovery outperformance |
| 2012 | +31.0% | +17.1% | European recovery |
| 2013 | +42.0% | +27.8% | Best absolute year |
| 2022 | -18.7% | -19.0% | Near-flat vs SPY |
| 2025 | +16.1% | +6.3% | Recent outperformance |
2001-2004 is the defining period. The strategy outperformed SPY by massive margins for four consecutive years during the US tech bust. The LSE was dominated by energy, mining, financial, and consumer staples names, sectors with real earnings that weren't caught in the dot-com bubble. The UK portfolio's 12-month momentum in 2001 was long UK banks, commodity names, and consumer stocks that were all genuinely performing. The US was long the laggards of the tech crash.
2002 is particularly striking. While SPY fell 19.9%, UK momentum gained 34.1%, a 54-point gap in one year. This was a real divergence driven by sector composition: UK was concentrated in energy and basic materials during a commodity cycle upturn, while the US was still flushing tech losses.
2008 shows the limit. The strategy fell -53.6% vs SPY's -34.3%. UK financials and mining stocks that had been the portfolio's core holdings hit hard in the global crisis. HSBC, Rio Tinto, and similar names were genuine momentum leaders entering 2008. They also led the crash. The global nature of the 2008 crisis meant UK momentum couldn't escape it.
2022 near-breakeven. The strategy fell -18.7% vs SPY -19.0%, essentially flat relative performance. UK energy names (BP, Shell, Tullow Oil) had strong momentum going into 2022 due to the commodity cycle, and they held up in the rate shock. This is the same pattern as Germany: commodity exposure creates a natural rate-shock buffer.
Backtest Methodology
- Data: FMP financial data via Ceta Research warehouse. Price data from
stock_eod(adjusted closes). - Point-in-time: Market cap filter uses annual
key_metricsfilings with 45-day lag. No look-ahead bias. - Signal: Price at T-12M to T-1M. The 1-month skip avoids short-term reversal contamination.
- Data quality: Stocks with adjusted close < $1 at either lookback date excluded. Momentum capped at 500% per stock.
- Equal weight: 30 positions, 3.33% each. No intraperiod rebalancing.
- Transaction costs: Modeled as size-tiered. LSE is a liquid market with stamp duty on purchases (modeled in costs).
- Benchmark: SPY ETF total return. Returns are in USD terms (GBP exposure embedded).
Why the UK Works
The UK market structure provides natural diversification from US equity risk in most (not all) market environments:
Sector composition. The FTSE universe is heavily weighted in energy, mining, financials, and consumer staples. These sectors have genuine earnings momentum tied to commodity cycles, interest rate movements, and UK consumer dynamics, not tech sentiment cycles. Momentum in these sectors is more durable.
Institutional landscape. UK equities attract a different institutional base. UK pension funds, European asset managers, some global long-only, with lower quant momentum penetration compared to US large-caps. The momentum premium is less arbitraged.
Low correlation to US tech. The biggest driver of US momentum in recent years is tech and growth stocks. The UK has limited exposure to these names. This creates periods where UK momentum and US momentum diverge.
Limitations
2008 showed the global crisis exposure. When US and global financial stress is severe and synchronized, UK financials and miners fall alongside everything else. The down capture advantage disappears precisely when you need it most.
GBP/USD currency exposure. Returns include currency movements. Post-Brexit GBP weakness has been a headwind for USD-denominated investors in UK equities. The GBP has declined from ~1.50 in 2015 to ~1.25 in 2025, that's roughly 17% of total return lost to currency over 10 years.
Post-Brexit structural change. UK equity valuations have been structurally discounted since 2016 due to Brexit uncertainty and subsequent foreign institutional underweighting of the UK. This creates ongoing valuation compression that may limit forward returns.
Sharpe below SPY. The 0.350 vs 0.382 comparison shows that while the strategy delivers more absolute return, the risk-adjusted profile is slightly inferior to the passive index. The -57.24% max drawdown is higher than SPY's -36.65%.
Takeaway
12-month momentum on UK stocks works. The 10.82% CAGR vs 7.75% for SPY, with 58.29% down capture, is a compelling combination. The strategy delivered positive alpha in 25 years while protecting capital better than the index in most downturns.
The UK's sector composition, energy, mining, financials, consumer staples, creates a natural anchor that separates LSE momentum from US tech-driven momentum cycles. That separation has historically been valuable. The 2001-2004 and 2022 periods show it most clearly.
The main risk is global financial crisis correlation. When the entire global financial system is stressed, UK financials and commodities fall with everything else. The 2008 result is the clearest example. The strategy isn't a recession hedge; it's a factor that captures UK-specific business cycle momentum.
Part of a Series
This is part of a multi-exchange 12-month momentum study:
- 12M Momentum: Global 18-Exchange Comparison, published April 14
- 12M Momentum: India 22.74% CAGR, published April 16
- 12M Momentum: Germany Best Sharpe in 18 Exchanges, published April 18
- 12M Momentum: US Underperforms SPY by 3.69%/yr, published April 23
References
- Jegadeesh, N. & Titman, S. (1993). Returns to Buying Winners and Selling Losers. Journal of Finance, 48(1), 65-91.
- Asness, C., Moskowitz, T. & Pedersen, L. (2013). Value and Momentum Everywhere. Journal of Finance.
- Daniel, K. & Moskowitz, T. (2016). Momentum Crashes. Journal of Financial Economics.
Run This Screen Yourself
The current 12-month momentum screen for UK stocks is live on Ceta Research:
cetaresearch.com/data-explorer?q=cJy1lB2j-I
-- 12-Month Momentum UK Screen
-- Live at: cetaresearch.com/data-explorer?q=cJy1lB2j-I
WITH universe AS (
 SELECT p.symbol, p.companyName, p.exchange, k.marketCap / 1e9 AS market_cap_billions
 FROM profile p JOIN key_metrics_ttm k ON p.symbol = k.symbol
 WHERE k.marketCap > 500000000 AND p.isActivelyTrading = true
 AND p.exchange IN ('LSE')
),
price_12m_ago AS (
 SELECT symbol, adjClose AS price_12m,
 ROW_NUMBER() OVER (PARTITION BY symbol ORDER BY ABS(CAST(dateEpoch AS BIGINT) -
 CAST(EXTRACT(EPOCH FROM (CURRENT_DATE - INTERVAL '365' DAY))::BIGINT AS BIGINT))) AS rn
 FROM stock_eod
 WHERE CAST(date AS DATE) BETWEEN CURRENT_DATE - INTERVAL '395' DAY
 AND CURRENT_DATE - INTERVAL '335' DAY
 AND adjClose > 0
),
price_1m_ago AS (
 SELECT symbol, adjClose AS price_1m,
 ROW_NUMBER() OVER (PARTITION BY symbol ORDER BY ABS(CAST(dateEpoch AS BIGINT) -
 CAST(EXTRACT(EPOCH FROM (CURRENT_DATE - INTERVAL '30' DAY))::BIGINT AS BIGINT))) AS rn
 FROM stock_eod
 WHERE CAST(date AS DATE) BETWEEN CURRENT_DATE - INTERVAL '45' DAY
 AND CURRENT_DATE - INTERVAL '15' DAY
 AND adjClose > 0
)
SELECT u.symbol, u.companyName, u.exchange,
 ROUND(u.market_cap_billions, 2) AS market_cap_billions,
 ROUND((p1m.price_1m - p12.price_12m) / p12.price_12m * 100, 1) AS return_12m_1m_pct
FROM universe u
JOIN price_12m_ago p12 ON u.symbol = p12.symbol AND p12.rn = 1
JOIN price_1m_ago p1m ON u.symbol = p1m.symbol AND p1m.rn = 1
WHERE p12.price_12m > 1.0 AND p1m.price_1m > 1.0
 AND (p1m.price_1m - p12.price_12m) / p12.price_12m <= 5.0
ORDER BY return_12m_1m_pct DESC NULLS LAST
LIMIT 30;


