
Multi-Pair Pairs Trading: 11-Exchange Global Comparison (2005-2024)


We ran a multi-pair portfolio backtest across 11 exchanges, testing portfolio sizes of 5, 10, 15, and 20 pairs with equal-weight and inverse-volatility allocation. The strategy generated positive returns on 5 of 11 exchanges at the 20-pair inverse-vol configuration, but only Korea and Sweden beat a low risk-free rate. India at 5 pairs, equal weight, is the single configuration that beats the S&P 500.
Contents
- Method
- Results
- Full exchange comparison (20-pair inv-vol)
- Where it's positive vs where it loses
- Korea: the standout
- UK: inverse-vol is the better choice
- India: portfolio size matters most
- Germany: limited pair universe
- Taiwan: 20% cash
- Canada: worst performer
- Across All Exchanges: Equal Weight vs Inverse-Vol
- Transaction Costs Across Exchanges
- Limitations
- Which Exchanges to Use
- Takeaway
- Part of a Series
South Africa (JNB) is excluded from this comparison. Its results showed single-year returns above 400% in a theoretically market-neutral strategy, indicating data artifacts in ZAR-denominated price history.
Method
Identical parameters across all exchanges: - Same-sector pairs, correlation >= 0.70, minimum 200 common trading days - Half-life filter: 5-60 trading days (Ornstein-Uhlenbeck fit) - Formation period = prior calendar year; trading period = current year - Z-score entry ±2.0, exit ±0.5; 60-day time stop; -5% loss stop - Size-tiered transaction costs applied - Cash rule: hold cash if fewer than 3 active pairs can be formed
Portfolio configurations tested: N = 5, 10, 15, 20 pairs × equal/inverse-vol allocation. The primary reported configuration is 20-pair inverse-vol for consistency.
Exchange-specific adjustments: market cap thresholds in local currency units. Risk-free rates are exchange-local. SPY CAGR (9.81%) used as the single benchmark for excess return comparability.
Results
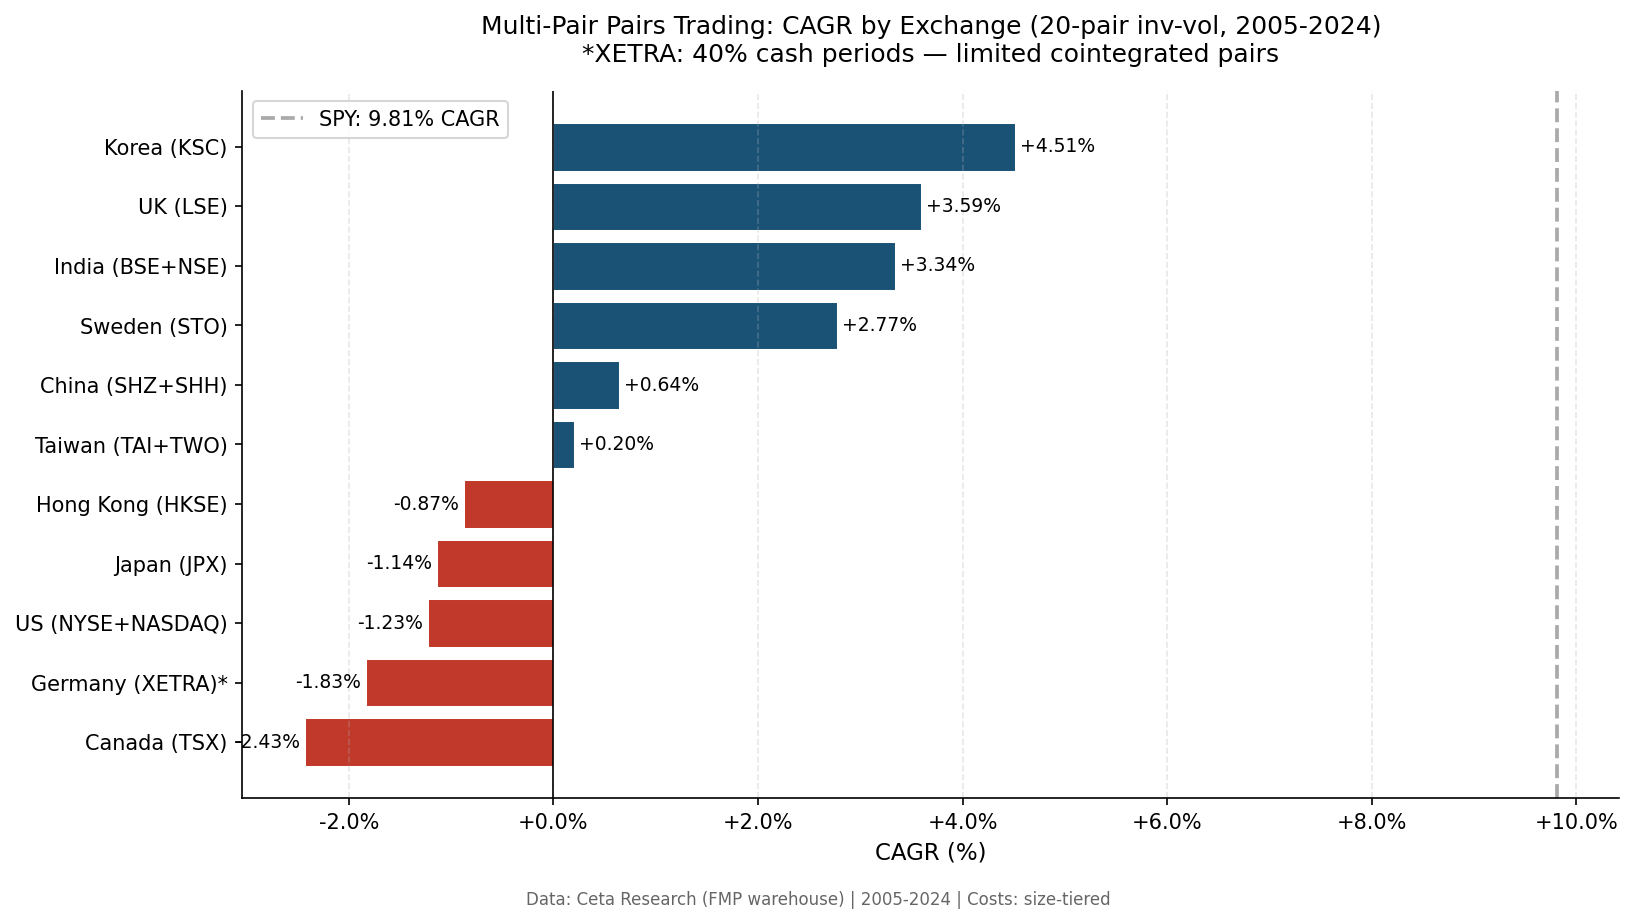
Full exchange comparison (20-pair inv-vol)
| Exchange | CAGR | vs SPY | Sharpe | MaxDD | Cash |
|---|---|---|---|---|---|
| Korea (KSC) | +4.51% | -5.30% | 0.12 | -4.31% | 0% |
| UK (LSE) | +3.59% | -6.23% | 0.00 | -27.17% | 5% |
| India (BSE+NSE) | +3.34% | -6.48% | -0.15 | -26.90% | 0% |
| Sweden (STO) | +2.77% | -7.04% | 0.12 | -6.33% | 0% |
| China (SHZ+SHH) | +0.64% | -9.17% | -0.14 | -36.98% | 0% |
| Taiwan (TAI+TWO) | +0.20% | -9.62% | -0.13 | -19.53% | 20% |
| Hong Kong (HKSE) | -0.87% | -10.68% | -1.92 | -17.51% | 5% |
| Japan (JPX) | -1.14% | -10.96% | -1.12 | -20.61% | 0% |
| US (NYSE+NASDAQ) | -1.23% | -11.04% | -2.74 | -21.95% | 0% |
| Germany (XETRA)* | -1.83% | -11.64% | -0.96 | -30.91% | 40% |
| Canada (TSX) | -2.43% | -12.24% | -3.50 | -38.84% | 5% |
*XETRA: 40% cash periods. Germany's industrial conglomerate structure limits the number of tightly correlated same-sector pairs. Include in comparison with this caveat; no dedicated blog.
Where it's positive vs where it loses
Five exchanges return positive CAGR at the 20-pair inv-vol level: Korea, UK, India, Sweden, China. Six exchanges are negative.
Positive CAGR doesn't mean it beats the benchmark. Korea's +4.51% is still 5.30% below SPY's 9.81%. The strategy generates absolute returns but doesn't compensate for the opportunity cost of holding equity index exposure.
The best risk-adjusted results: Korea (Sharpe 0.12, MaxDD -4.31%) and Sweden (Sharpe 0.12, MaxDD -6.33%). Both have positive Sharpe ratios and shallow drawdowns, which is what you'd want from a market-neutral strategy used as a portfolio diversifier rather than a standalone investment.
Korea: the standout
Korea (KSC) is the best all-around exchange: +4.51% CAGR, -4.31% max drawdown, beta -0.376, down capture -65.96%. When global markets fall, the Korea pairs portfolio tends to gain. The down capture of -65.96% means in years when SPY fell, the Korea portfolio moved opposite to it.
This is a genuine market-neutral property. Korean chaebols operate in tightly correlated pairs within conglomerates (Samsung Electronics vs Samsung SDI, Hyundai Motor vs Kia, etc.). These pairs have structural relationships that create persistent, mean-reverting spread dynamics.
UK: inverse-vol is the better choice
UK is the only exchange where inverse-vol allocation consistently beats equal weight. At 20 pairs:
| Allocation | CAGR | MaxDD |
|---|---|---|
| Equal weight | -0.93% | various |
| Inverse-vol | +3.59% | -27.17% |
LSE contains a wider range of pair quality than Korea. The low-spread-vol pairs happen to be the better ones in the UK universe. Inverse-vol concentrates capital there.
India: portfolio size matters most
India demonstrates the clearest portfolio-size sensitivity. Equal-weight configurations:
| N pairs | CAGR | vs SPY |
|---|---|---|
| 5 | +11.80% | +1.99% |
| 10 | +11.01% | +1.20% |
| 15 | +7.65% | -2.16% |
| 20 | +6.45% | -3.36% |
The 5-pair and 10-pair equal-weight configurations are the only ones in the entire global study that beat SPY. Beyond 10 pairs, the alpha dilutes below benchmark.
Germany: limited pair universe
XETRA had 8 of 20 years with fewer than 3 active pairs (cash periods). Germany's market structure, large conglomerates, cross-shareholding, fewer independent same-sector mid-caps, limits the number of pairs that pass the correlation and half-life filters. Include in comparison, but not a recommended implementation exchange.
Taiwan: 20% cash
Taiwan (TAI+TWO) had 4 cash years out of 20. The combined exchange has lower same-sector stock density than its market size suggests. Still worth including in comparison at +0.20% CAGR.
Canada: worst performer
Canada (TSX) returns -2.43% CAGR with -38.84% max drawdown, worse than the US on both metrics. The TSX is dominated by energy, financials, and materials. Sector composition limits the number of tightly correlated same-sector pairs outside those three sectors.
Across All Exchanges: Equal Weight vs Inverse-Vol
The UK result is the exception. On most exchanges, equal weight beats inverse-vol:
| Exchange | Equal (20p) | Inv-vol (20p) | Winner |
|---|---|---|---|
| Korea | ~same | +4.51% | ~tie |
| UK | -0.93% | +3.59% | Inv-vol |
| India | +6.45% | +3.34% | Equal |
| Sweden | ~same | +2.77% | ~tie |
| US | -1.22% | -1.23% | Equal (marginally) |
| Canada | lower | -2.43% | Equal |
When expected trade returns are negative, inverse-vol allocates more capital to volatile pairs, which happen to lose more. Equal weight distributes the losses evenly. The UK is different because its low-vol pairs are genuinely higher quality.
Transaction Costs Across Exchanges
All exchanges use size-tiered costs. The cost burden relative to expected gross return varies:
- US gross return before costs: ~+2.5% (positive)
- US gross return after costs: -1.23%
- Implied cost drag: ~3.7% annually
This is consistent across developed markets. The 4-legged transaction cost at 5-8 bps per leg eats the marginal convergence profit in liquid, efficient markets. Less developed markets (where institutional participation in systematic strategies is lower) have larger gross edges that survive the cost deduction better.
Limitations
SPY as universal benchmark. We use SPY (9.81% CAGR 2005-2024) as the single benchmark for excess return comparability. This ignores local risk premia and currency effects. A fairer comparison for Korean stocks would use KOSPI; for Indian stocks, NIFTY. Using SPY systematically understates the excess return for markets that underperformed US equities in this period.
Short-selling restrictions. India has practical short-selling constraints. Sweden, Taiwan, and China also have periodic restrictions on specific securities. Reported returns assume unrestricted short access at standard cost.
Currency. Returns are computed in local currency. Cross-currency comparison isn't perfectly apples-to-apples, a USD investor's returns would differ based on exchange rate movements.
Data availability. The period starts 2005. Some exchanges had thinner historical data before 2010. Exchanges with fewer qualifying pairs in early years are more sensitive to outlier periods.
JNB exclusion. South Africa showed +426% in 2006, +139% in 2011, +263% in 2012, +193% in 2013 in a theoretically market-neutral strategy. ZAR price data has gaps and reconstruction artifacts in the FMP warehouse for this period. JNB results aren't reliable and are excluded from all comparison tables.
Which Exchanges to Use
Based on the 20-year data:
- Best for market-neutral diversification: Korea (Sharpe 0.12, MaxDD -4.31%, negative down-capture)
- Best absolute return at right portfolio size: India (5-pair equal weight: +11.80%)
- Most consistent positive Sharpe: Korea and Sweden
- Avoid: Canada (worst drawdown), Germany (too many cash periods)
The most honest assessment: multi-pair pairs trading doesn't beat the stock market on any exchange except India at small portfolio sizes. What it offers is genuine market neutrality (beta near zero, meaningful down capture reduction) that has portfolio construction value as a diversifier.
Takeaway
11 exchanges. 5 positive CAGR, 6 negative. Zero beat SPY at the 20-pair inv-vol level. India at 5 pairs (equal weight) is the single configuration that outperforms the US equity benchmark over 2005-2024.
The transaction cost problem is the consistent theme. The pairs mean-revert. The convergence rate is high (85-90% across exchanges). The problem is that 4-legged round-trip costs consume the margin between spread convergence and profit.
Korea and Sweden are the exceptions where the strategy generates positive Sharpe ratios. Both have structural pair relationships (Korean chaebols, Swedish industrial groups) that create persistent, high-conviction mean reversion.
Part of a Series
- Multi-Pair Pairs Trading: US Analysis, transaction cost problem in detail
- Multi-Pair Pairs Trading: India Deep-Dive, alpha-dilution curve and portfolio size sensitivity
Run It Yourself
Explore the data behind this analysis on Ceta Research. Query our financial data warehouse with SQL, build custom screens, and run your own backtests across 70,000+ stocks on 20 exchanges.
Data: Ceta Research, FMP financial data warehouse. Universe: 11 exchanges, MCap thresholds adjusted per market. 2005-2024. Size-tiered transaction costs. JNB excluded (data quality). Short-selling restrictions not modeled.


