
Oversold Quality China: Near-SPY Returns with Low US Correlation

Contents
- The Strategy
- Methodology
- Results
- When It Works
- When It Struggles
- Run It Yourself
- Limitations
- Part of a Series
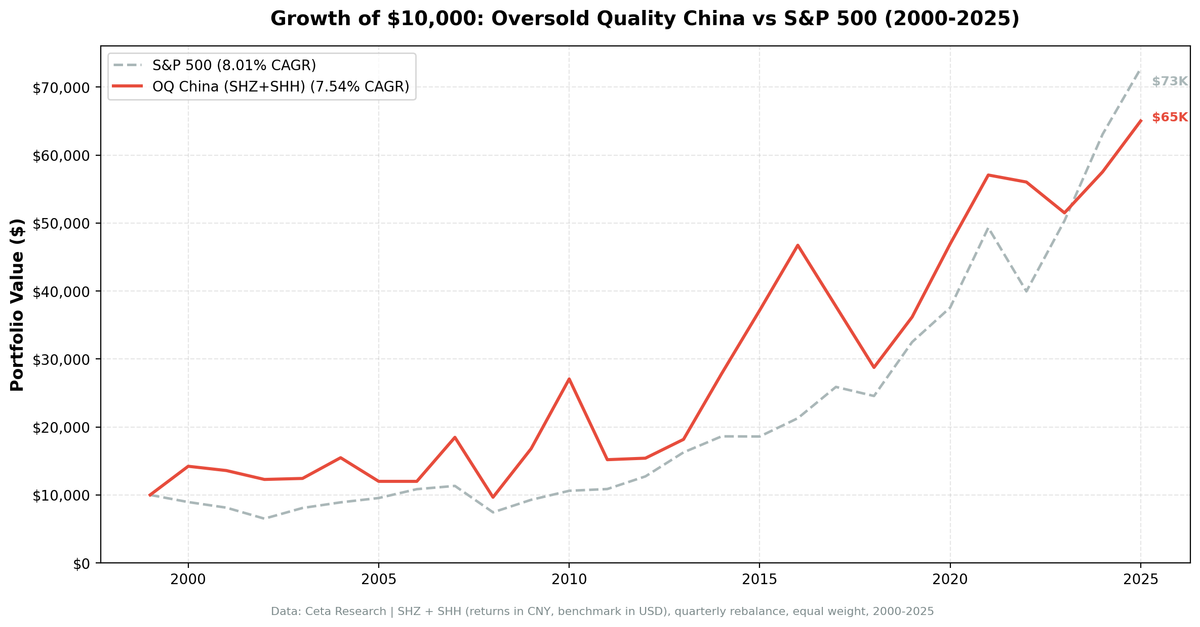
The Oversold Quality strategy on Chinese A-shares produced 7.54% CAGR over 25 years, compared to 8.01% for SPY. The gap is almost nothing. But the more interesting number is the down-capture ratio: 12.5%. When SPY falls, this portfolio barely moves. That's not primarily a strategy effect. It reflects the structural independence of Chinese A-shares from US market cycles. The quality and RSI filters shape which stocks get selected, but the low US correlation is a property of the asset class.

The Strategy
The Oversold Quality strategy combines two independent signals. Both must be true at each quarterly rebalance date for a stock to enter the portfolio.
Piotroski F-Score >= 7 (out of 9): Developed by Joseph Piotroski in a 2000 accounting research paper, the score checks nine binary conditions across three financial dimensions:
- Profitability (4 signals): Return on assets positive, ROA improving year-over-year, operating cash flow positive, accruals negative (meaning cash earnings exceed reported earnings, a sign of earnings quality)
- Leverage and liquidity (3 signals): Debt-to-assets ratio declining, current ratio improving, no new shares issued in the past year
- Operating efficiency (2 signals): Gross margin improving, asset turnover improving
A score of 7 or higher means the company passes at least seven of the nine tests, indicating broad financial improvement across multiple dimensions simultaneously.
RSI-14 < 30: The Relative Strength Index, introduced by J. Welles Wilder (1978), measures price momentum on a 0-100 scale. Values below 30 indicate a stock has fallen faster than its historical norm over the past 14 trading periods. The hypothesis is that sound companies at RSI < 30 have been oversold by the market, creating a temporary mispricing.
The portfolio holds the top 30 qualifying stocks by lowest RSI, equally weighted, rebalanced each quarter.
For a full methodology description, see the US flagship blog.
Methodology
- Universe: Shenzhen Stock Exchange (SHZ) and Shanghai Stock Exchange (SHH), A-shares only
- Market cap filter: ¥2B+ (roughly $276M USD-equivalent at current rates)
- Rebalancing: Quarterly (January, April, July, October rebalance dates)
- Portfolio size: Up to 30 stocks, equal weight. Holds cash if fewer than 5 stocks qualify.
- RSI lookback: 14 trading periods, computed from daily price data
- Transaction costs: Size-tiered model based on market cap at time of trade
- Data period: January 2000 through December 2025 (25.8 years, 103 quarterly periods)
- Cash periods: 22 of 103 quarters (21%). The RSI < 30 condition is moderately restrictive even in China's large A-share universe.
- Benchmark: SPY (S&P 500 ETF), used for cross-strategy consistency across all exchanges
- Returns: All results are in CNY. Currency effects between CNY and USD aren't reflected.
- Data source: Ceta Research FMP financial data warehouse
Full methodology, including metric definitions and cost modeling, is at backtests/METHODOLOGY.md.
Results
| Metric | Oversold Quality (China) | SPY |
|---|---|---|
| CAGR | 7.54% | 8.01% |
| Total return (25.8yr) | 550.3% | 627.5% |
| Max drawdown | -47.7% | -45.5% |
| Sharpe ratio | 0.167 | — |
| Volatility (annualized) | 30.28% | — |
| Up capture vs SPY | 66.9% | — |
| Down capture vs SPY | 12.5% | — |
| Win rate vs SPY | 39.8% | — |
| Cash periods | 22 of 103 quarters | — |
| Avg stocks (when invested) | 25.2 | — |
A $10,000 investment in January 2000 grew to roughly $65,000 by end of 2025. The same investment in SPY grew to roughly $72,700. The absolute gap is real, but the behavioral gap between the two portfolios during US market stress is striking.
The Sharpe ratio of 0.167 is nearly double the US result (0.087). Part of that reflects the lower US correlation: the portfolio's volatility doesn't coincide with SPY's volatility, so periods where both strategies fall simultaneously are rare.
The flip side is down-capture of 66.9% when SPY rises. The portfolio participates in less than two-thirds of SPY's upside. Over 25 years, missing one-third of every bull market rally compounds into a meaningful return drag.
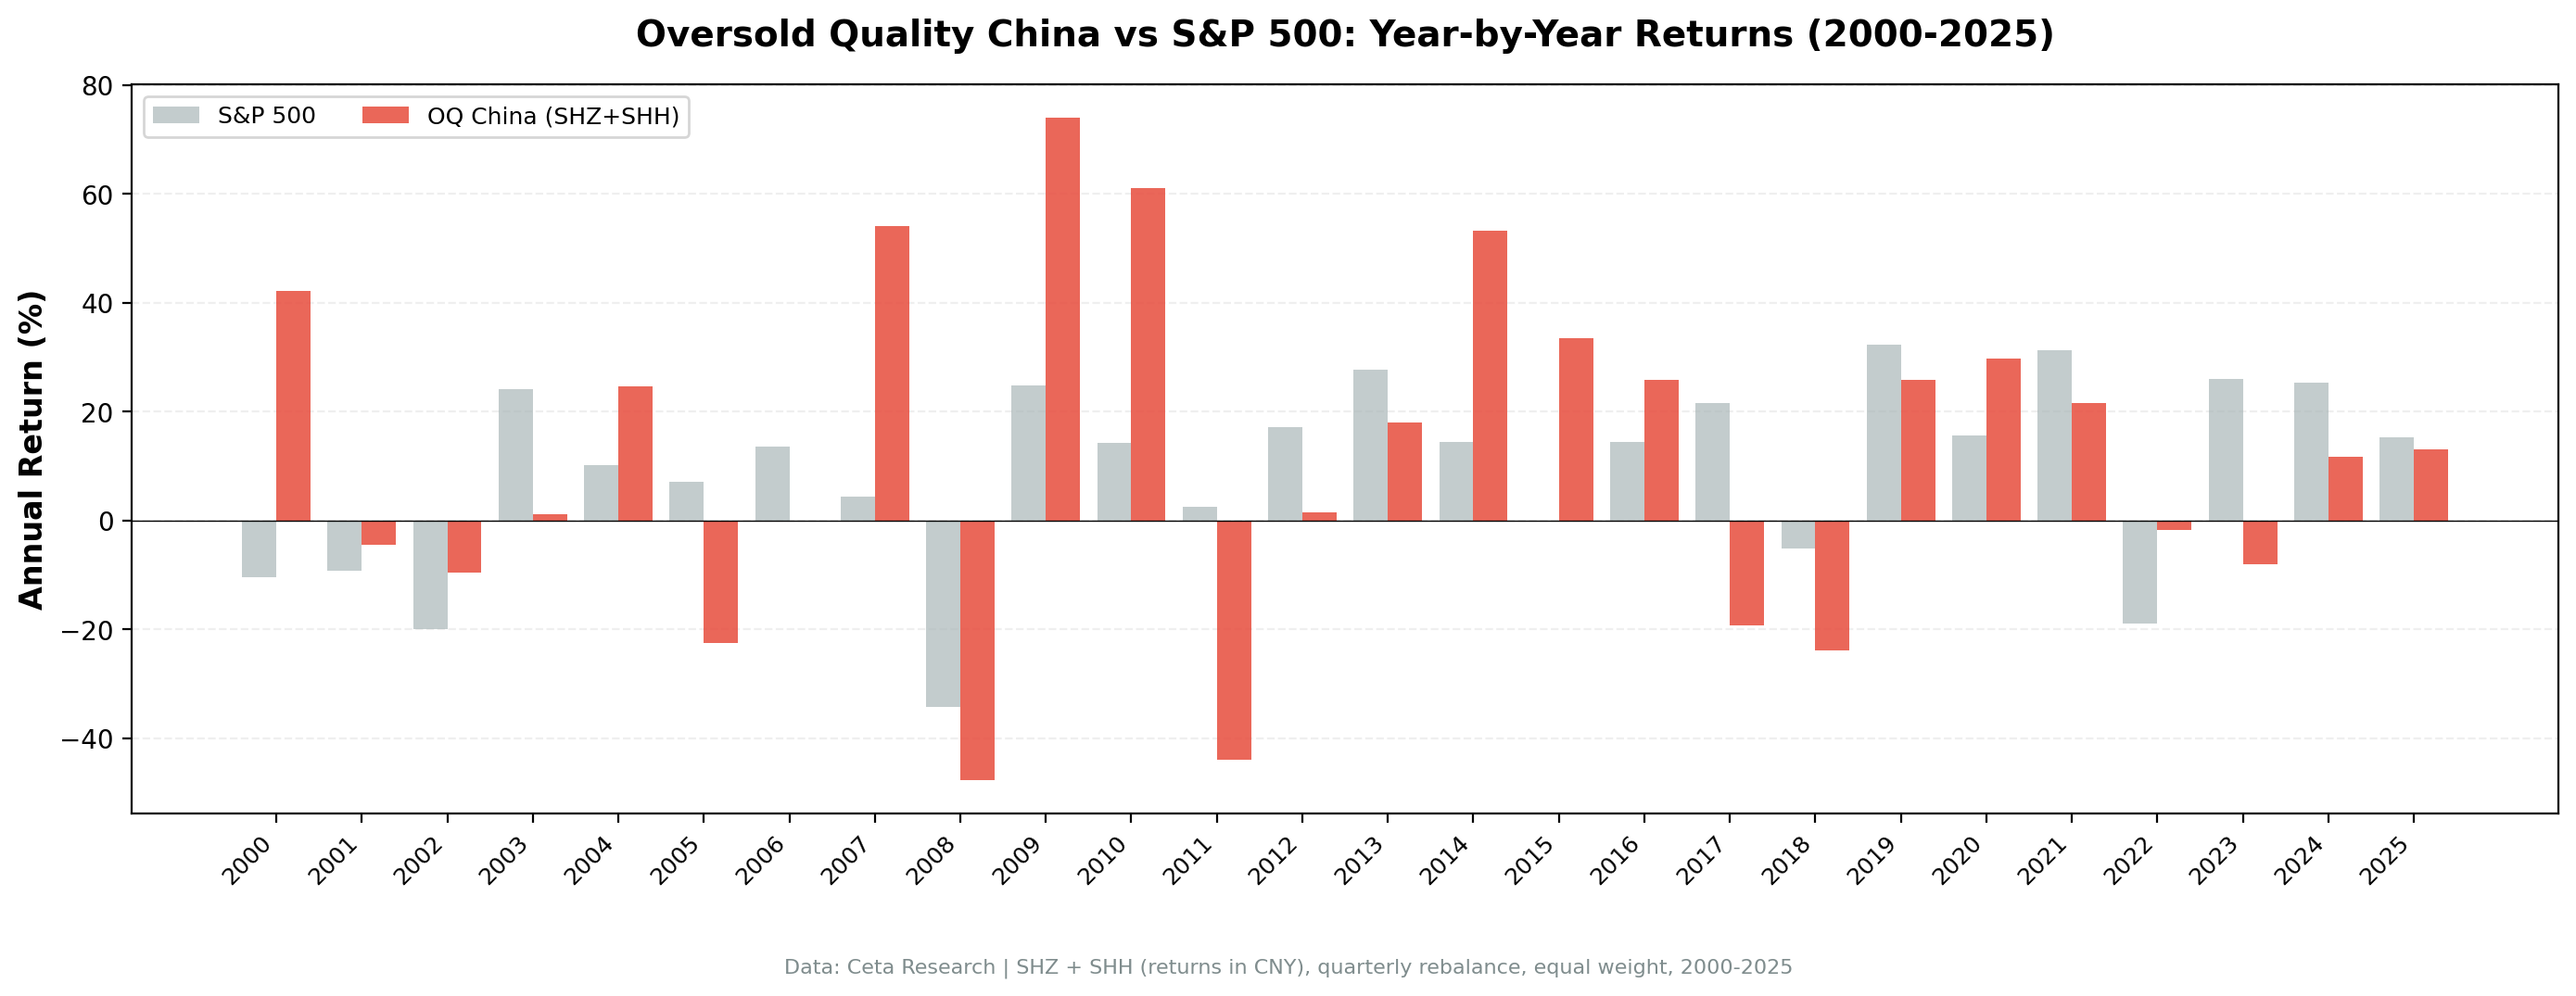
Annual returns:
| Year | Portfolio (CNY) | SPY | Excess |
|---|---|---|---|
| 2000 | +42.16% | -10.50% | +52.66% |
| 2001 | -4.42% | -9.17% | +4.74% |
| 2002 | -9.63% | -19.92% | +10.29% |
| 2003 | +1.20% | +24.12% | -22.92% |
| 2004 | +24.55% | +10.24% | +14.31% |
| 2005 | -22.49% | +7.17% | -29.66% |
| 2006 | 0.00% | +13.65% | -13.65% |
| 2007 | +54.00% | +4.40% | +49.60% |
| 2008 | -47.72% | -34.31% | -13.41% |
| 2009 | +73.99% | +24.73% | +49.25% |
| 2010 | +61.03% | +14.31% | +46.72% |
| 2011 | -43.88% | +2.46% | -46.34% |
| 2012 | +1.45% | +17.09% | -15.64% |
| 2013 | +17.95% | +27.77% | -9.83% |
| 2014 | +53.19% | +14.50% | +38.70% |
| 2015 | +33.52% | -0.12% | +33.64% |
| 2016 | +25.74% | +14.45% | +11.28% |
| 2017 | -19.23% | +21.64% | -40.87% |
| 2018 | -23.82% | -5.15% | -18.67% |
| 2019 | +25.79% | +32.31% | -6.52% |
| 2020 | +29.77% | +15.64% | +14.13% |
| 2021 | +21.57% | +31.26% | -9.69% |
| 2022 | -1.81% | -18.99% | +17.18% |
| 2023 | -8.09% | +26.00% | -34.09% |
| 2024 | +11.71% | +25.28% | -13.57% |
| 2025 | +13.03% | +15.34% | -2.31% |
When It Works
Chinese bull cycles. The 2007-2010 period illustrates the amplitude of Chinese A-share markets. The portfolio returned +54% in 2007, -48% in 2008, +74% in 2009, and +61% in 2010. That's not a stable return stream, but the quality filter kept the portfolio in companies with improving fundamentals during a speculative cycle that destroyed many weaker businesses.
US bear markets. The down-capture ratio tells the story: 2001, 2002, and 2022 all show the portfolio holding up while SPY fell. In 2022, the portfolio returned -1.81% against SPY's -18.99%, a 17.18% outperformance. That's structural. Chinese A-shares don't track the Federal Reserve rate cycle or US earnings recessions the same way US stocks do.
China-specific recoveries. 2014-2016 was a Chinese market cycle (a policy-driven bull market in 2014-2015 followed by a sharp correction). The strategy captured much of the upside because quality A-share companies were also among the oversold names heading into that cycle.
When It Struggles
China-specific bear markets. The 2011 result (-43.88%) is the clearest case. Shenzhen fell roughly 25% that year due to tightening monetary policy and growth concerns in China. The Piotroski filter didn't provide protection because the selloff was macro-driven, not company-specific. Every quality stock fell with the market.
When SPY rallies hard without China. 2017 was a painful year: the portfolio returned -19.23% while SPY gained +21.64%. Chinese A-shares were in a downcycle that year. The benchmark comparison looks terrible, but that's partly because SPY and Chinese A-shares operate on different cycles.
2023's divergence. The portfolio returned -8.09% against SPY's +26.00%. China's economy underperformed global expectations in 2023, and that showed up in A-share returns. A Piotroski quality filter doesn't hedge against macro headwinds at the national level.
High volatility. The 30.28% annualized volatility is nearly 50% higher than a typical US equity portfolio. Individual A-shares are volatile, and even the quality and oversold filters don't fully dampen that.
Run It Yourself
Current screen (live data for China A-shares):
-- Current Oversold Quality Screen (China A-shares)
-- Quality proxy: Piotroski-style TTM filters
SELECT
 k.symbol,
 p.companyName,
 p.exchange,
 ROUND(k.returnOnAssetsTTM * 100, 1) AS roa_pct,
 ROUND(k.returnOnEquityTTM * 100, 1) AS roe_pct,
 ROUND(k.incomeQualityTTM, 2) AS income_quality,
 ROUND(k.currentRatioTTM, 2) AS current_ratio,
 ROUND(k.netDebtToEBITDATTM, 2) AS net_debt_ebitda
FROM key_metrics_ttm k
JOIN profile p ON k.symbol = p.symbol
WHERE k.returnOnAssetsTTM > 0
 AND k.returnOnEquityTTM > 0.10
 AND k.incomeQualityTTM > 1.0
 AND k.currentRatioTTM > 1.0
 AND k.netDebtToEBITDATTM BETWEEN -10 AND 3.0
 AND k.marketCap > 2000000000 -- ¥2B+ (~$276M USD) for China
 AND p.exchange IN ('SHZ', 'SHH')
ORDER BY k.symbol
Run this query on Ceta Research Data Explorer
Note: RSI is computed from daily price data at each quarterly rebalance date and isn't available directly in this quality screen. The SQL above identifies the quality-passing universe; RSI filtering happens in the backtest engine.
Run the full historical backtest:
git clone https://github.com/ceta-research/backtests.git
cd backtests
pip install -r requirements.txt
python3 oversold-quality/backtest.py --preset china --output results.json --verbose
Limitations
Currency: All returns are computed in CNY. A US investor holding Chinese A-shares would experience additional CNY/USD currency volatility. CNY appreciated against USD during parts of the backtest period and depreciated in others. The 7.54% CAGR in CNY translates to a different number in USD depending on the period.
A-share market access: Foreign investors can't freely buy Chinese A-shares directly. Access historically required QFII quotas or Stock Connect programs. This backtest assumes direct access at each quarterly rebalance, which overstates the practical opportunity for most non-Chinese investors.
Data coverage: FMP's coverage of Chinese A-shares, particularly for the 2000-2005 period, may be less complete than US data. Stocks with partial data histories are more likely to be excluded from the backtest universe, which may introduce a mild survivorship effect.
Benchmark comparison: We compare against SPY throughout for cross-strategy consistency. A more appropriate local benchmark would be the CSI 300 or SSE Composite Index. The portfolio's actual performance relative to Chinese market indices would look different.
The 2006 cash year: In 2006, the portfolio held 100% cash because the RSI < 30 condition was met by fewer than 5 qualifying A-shares. The China A-share market was entering a speculative bull run in 2006, and oversold quality stocks were scarce. That year's SPY gain of 13.65% was fully missed.
Volatility: The 30.28% annualized volatility reflects the underlying A-share market, not just the strategy. Investors with low volatility tolerance will find this uncomfortable regardless of the long-term CAGR.
Part of a Series
This is part of our Oversold Quality backtest series, testing the combination of Piotroski F-Score >= 7 and RSI-14 < 30 across global markets.
- Oversold Quality US (flagship methodology): NYSE + NASDAQ + AMEX, 25.8 years. 3.89% CAGR, bear market alpha.
- Oversold Quality Germany: XETRA, best Sharpe in the series (0.193). Coming soon.
- Oversold Quality Global Comparison: 14 exchanges, full results. Coming soon.
Data: Ceta Research (FMP financial data warehouse), January 2000 through December 2025. Returns in CNY. Full methodology: github.com/ceta-research/backtests/blob/main/METHODOLOGY.md.
Academic references: Piotroski, J.D. (2000). "Value Investing: The Use of Historical Financial Statement Information to Separate Winners from Losers." Journal of Accounting Research, 38. Wilder, J.W. (1978). New Concepts in Technical Trading Systems. Trend Research. Jegadeesh, N. (1990). "Evidence of Predictable Behavior of Security Returns." Journal of Finance.


